介绍:
通过推断细胞间相互作用和免疫细胞预后价值来研究时间的计算方法。我们的方法将存活统计数据与批量转录组学图谱相结合,以构建免疫细胞-细胞相互作用网络,其中边缘(例如,X → Y)表明高 X/Y 比值与良好的预后相关。
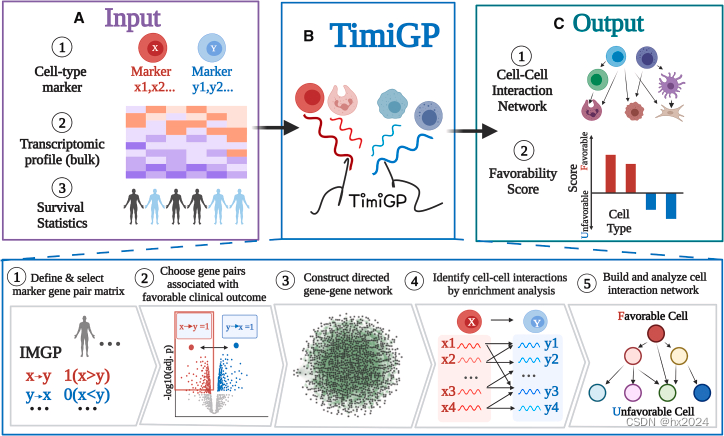
TimiGP代表了一个广泛适用的框架,用于剖析浸润细胞的细胞间相互作用和预后关联。该策略可用于研究不同尺度的临床相关肿瘤微环境,并借助 scRNA-seq 标记物从低分辨率的批量图谱中进行高分辨率分析。该框架可以扩展到其他有表达谱和临床统计数据的疾病。它通过网络分析系统地确定细胞环境与临床结果之间的关联。因此,基于这些见解,TimiGP可以用于生物学发现和预测。
示例:
TimiGP/data at master · CSkylarL/TimiGP (github.com)
步骤1:输入input
rm(list = ls())
library(TimiGP)#1. Load SCKCM06 data ----
data("SKCM06info")
head(SKCM06info)
data("SKCM06rna")
#2. Load cell type and marker annotation ----
data("CellType_Bindea2013_cancer")
geneset <- CellType_Bindea2013_cancer
marker <- unique(geneset$Gene)
#3. Preprocess: TimiCheckEvent & TimiPrePropress ----
info <- TimiCheckEvent(SKCM06info)
rna <- TimiPrePropress(marker = marker,rna = SKCM06rna,cohort = rownames(info))

注意:考虑到生存分析的统计功效,该分析的最小建议队列规模为 30。
临床数据编码:(例如,死亡、复发等)编码为“1”;当由于受试者在研究结束时未经历该事件或失访而导致数据不完整时,出现删截,编码为“0”(感兴趣的事件没有发生)。
步骤2:定义和选择标记基因对矩阵
默认情况下,TimiGenePair将捕获任意两个标记对的逻辑关系,并生成标记对得分矩阵(MPS):
-
1 or TRUE = the expression of gene A > that of gene B,
-
0 or FALSE = the expression of gene A < that of gene B.
#4. Generate marker pair score: TimiGenePair  ----
mps <- TimiGenePair(rna)
步骤3:定向IMGP选择
TimiCOX将执行单变量COX回归,将每个标记对作为变量进行拟合。Cox回归的结果作为第一个列表返回。如果一对A_B与不良预后(HR > 1)相关,即使不显著,也会将其更改为B_A,并在该对的矩阵中反转其值。新的标记对得分矩阵(MPS)作为第二个列表返回。 这个步骤大约需要5-10分钟,这取决于基因对的数量。
#5. Perform univariate Cox regression to find the association between marker pair and survival: TimiCOX ----
res <- TimiCOX(mps = mps,info = info,p.adj = "BH")
mps <- res[[1]]
cox_res <- res[[2]]
#mps <- res$mps
#cox_res <- res$ cox_res#“cox_res”已重命名为“Bindea2013c_COX_MP_SKCM06”并保存为示例数据
data(Bindea2013c_COX_MP_SKCM06)
cox_res <- Bindea2013c_COX_MP_SKCM06
步骤4:确定条件和临界值以选择预后对
# Count the number of marker pairs with Adjusted P-value (QV) less than 0.05
sum(cox_res$QV < 0.05) # Returns 2773# Calculate the percentage of significant marker pairs relative to the total number of marker pairs
round(sum(cox_res$QV < 0.05)/ nrow(cox_res) * 100, 2) # Returns 2.52# Set up a variable to define the condition for selecting marker pairs based on the Adjusted P-value.
GPcondition <- "QV"
# Set up a variable to define the cutoff value for the Adjusted P-value.
GPcutoff <- 0.05
# GP represents Gene Pair
注意:默认情况下,条件为调整后的P值,截止值为0.05。它受到生存信息质量的影响。高质量的生存信息,包括大规模的队列(如> 200)和合理的事件数量,是确保生存分析的统计功效的首选。我们建议预后基因对的百分比在1%–5%的范围内。如果您的目标是更保守的结果,您可以选择更严格的临界值,例如,通过设置“gp condition <--“QV”和“GPcutoff <- 0.01”来调整P值< 0.01。否则,如果您想要更敏感的结果和保守的结果,您可以选择一个宽松的临界值,例如,通过设置“gp condition <--“PV””和“GPcutoff <- 0.05”,P值< 0.05。

步骤5:构建定向基因-基因网络
GeneNET <- TimiGeneNetwork( resdata = cox_res, select = NULL,dataset = "Bindea2013_Cancer",geneset = NULL,condition = GPcondition,cutoff = GPcutoff,export = TRUE,path = "./")# Display the first few rows of the 'network' component in the NET object
head(GeneNET$network)
# Display the first few rows of the 'node' component in the NET object
head(GeneNET$node)
# Display the first few rows of the 'edge' component in the NET object
head(GeneNET$edge)
步骤6:通过富集分析鉴定细胞间相互作用
GP <- rownames(cox_res)[which(cox_res[,GPcondition] < GPcutoff)]
background <- TimiBG(marker.pair = row.names(cox_res))
cell_pair <- TimiCellPair(geneset = geneset, core = 6)
res <- TimiEnrich( gene = GP,background = background,geneset = cell_pair,p.adj = "BH",core = 6,pair=TRUE)
绘图:
p <- TimiDotplot(resdata = res,select = c(1:10))
p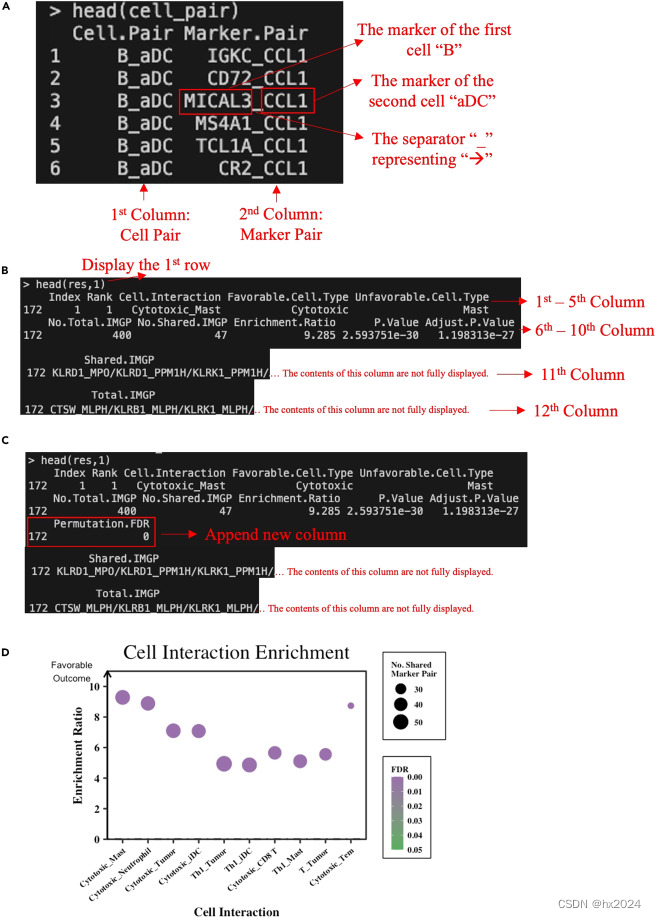
步骤7:确定条件和截止值以定义细胞间相互作用。
# Count the number of marker pairs with an Adjusted P-value less than 0.05
sum(res$Adjust.P.Value < 0.05) # Returns 54
# Calculate the percentage of cell-cell interaction defined by the above condition and the cutoff
round(sum(res$Adjust.P.Value < 0.05)/nrow(res) * 100, 2) # Returns 11.69
# Set up a variable to define the condition for cell-cell interaction based on the Adjusted P-value.
CIcondition <- "Adjust.P.Value"
# Set up a variable to define the cutoff value for the Adjusted P-value.
CIcutoff <- 0.05
# CI represents Cell-cell Interaction
res <- TimiPermFDR( resdata = res,geneset = geneset,gene = GP,background = background,niter = 100,core = 6)
未完待续。。。。。
参考:
1:TimiGP: Inferring cell-cell interactions and prognostic associations in the tumor immune microenvironment through gene pairs
2:TimiGP: An R package to depict the tumor microenvironment from bulk transcriptomics
3:细胞互作新算法:TimiGP! - 知乎 (zhihu.com)


