目录
1.VS Code是什么
2. VS Code的下载和安装
2.1 下载和安装
2.2.1 下载
2.2.2 安装
2.2 环境的介绍
2.3 安装中文插件
3. VS Code配置C/C++开发环境
3.1 下载和配置MinGW-w64编译器套件
3.1.1 下载
3.1.2 配置
3.2 安装C/C++插件
3.3 重启VSCode
4. 在VSCode上编写C语言代码并编译成功
4.1 打开文件夹
4.2 新建C语言文件,编写C语言代码
4.3 设置C/C++编译的选项: c_cpp_properties.json
4.4 创建执行任务: tasks.json
4.5 编译+执行
4.5.1 编译
4.5.2 执行
4.6 再写一个代码怎么办?
4.6.1 方法一
4.6.1.1 新建文件
4.6.1.2 执行
4.6.2 方法二
4.6.2.1 新建文件夹2025_02_17_test
4.6.2.2. 打开文件夹选择2025_02_17_test
4.6.2.3 编写代码
4.6.2.4 拷贝配置文件
4.5.2.5 编译+执行
4.7 一个工程中有多个.c文件怎么办?
4.7.1 创建文件
4.7.2 编写代码
4.7.3 修改配置文件tasks.json并验证结果
4.7.3.1 效果一
4.7.3.2 效果二
4.7.4 编译 + 运行
5. VSCode 怎么写C++的代码呢?
5.1 创建文件,编写代码
5.2配置g++.exe为编译器
5.3 生成C++源文件编译的tasks信息
5.4 编译 + 执行
6. VSCode的调试
6.1 创建launch.json文件
6.2 修改配置文件
6.3 开始调试
1.VS Code是什么
Visual Studio Code 简称 VS Code,是一款跨平台的、免费且开源的现代轻量级代码编辑器,支持几乎主流开发语言的语法高亮、智能代码补全、自定义快捷键、括号匹配和颜色区分、代码片段提示、代码对比等特性、也拥有对git的开箱即用的支持。同时、它还支持插件扩展,通过丰富的插件,用户能获得更多高效的功能。
一般有稳定版和体验版两个版本。
2. VS Code的下载和安装
2.1 下载和安装
2.2.1 下载
下载地址:Visual Studio Code - Code Editing. RedefinedVisual Studio Code redefines AI-powered coding with GitHub Copilot for building and debugging modern web and cloud applications. Visual Studio Code is free and available on your favorite platform - Linux, macOS, and Windows.![]() https://code.visualstudio.com/
https://code.visualstudio.com/
迅雷链接:
迅雷云盘迅雷云盘![]() https://pan.xunlei.com/s/VOJ4TaX7OG6cK489gNBNqnPvA1?pwd=fddh
https://pan.xunlei.com/s/VOJ4TaX7OG6cK489gNBNqnPvA1?pwd=fddh
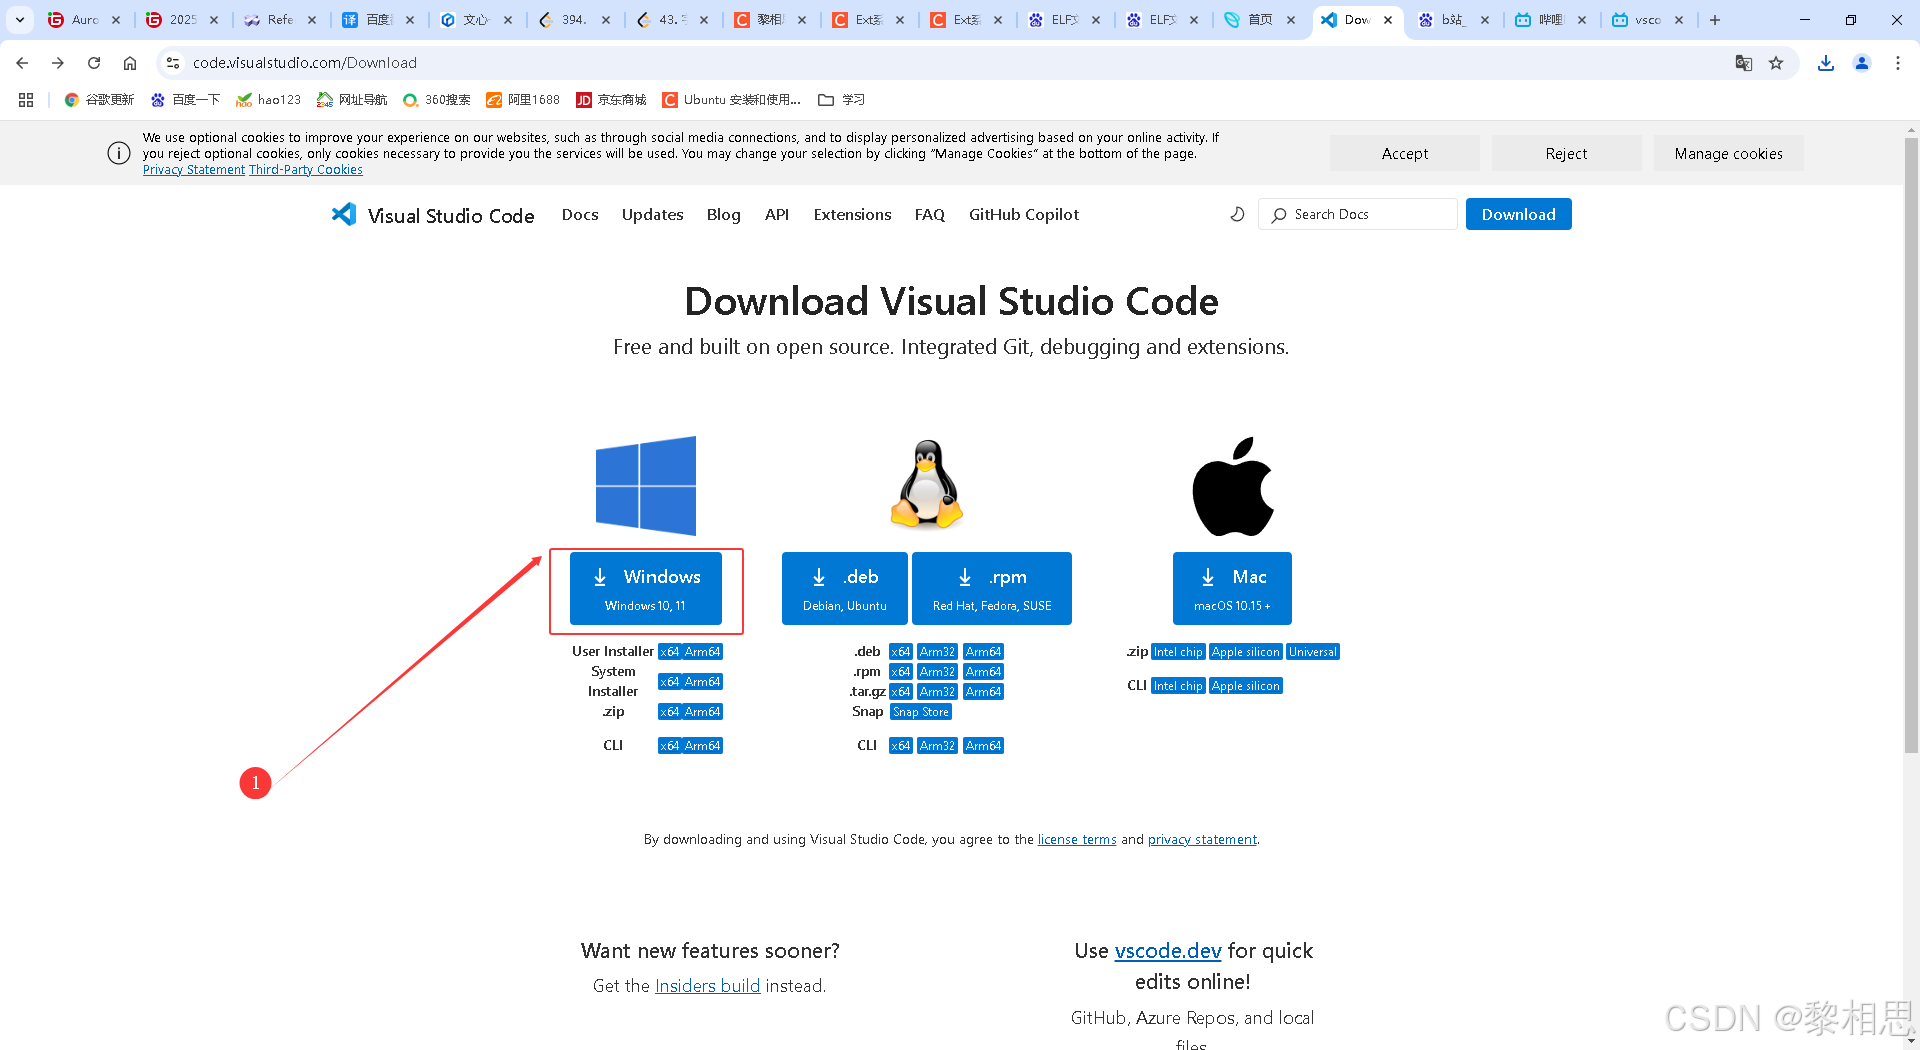
1. 点击Download

2. 点击Windows下载
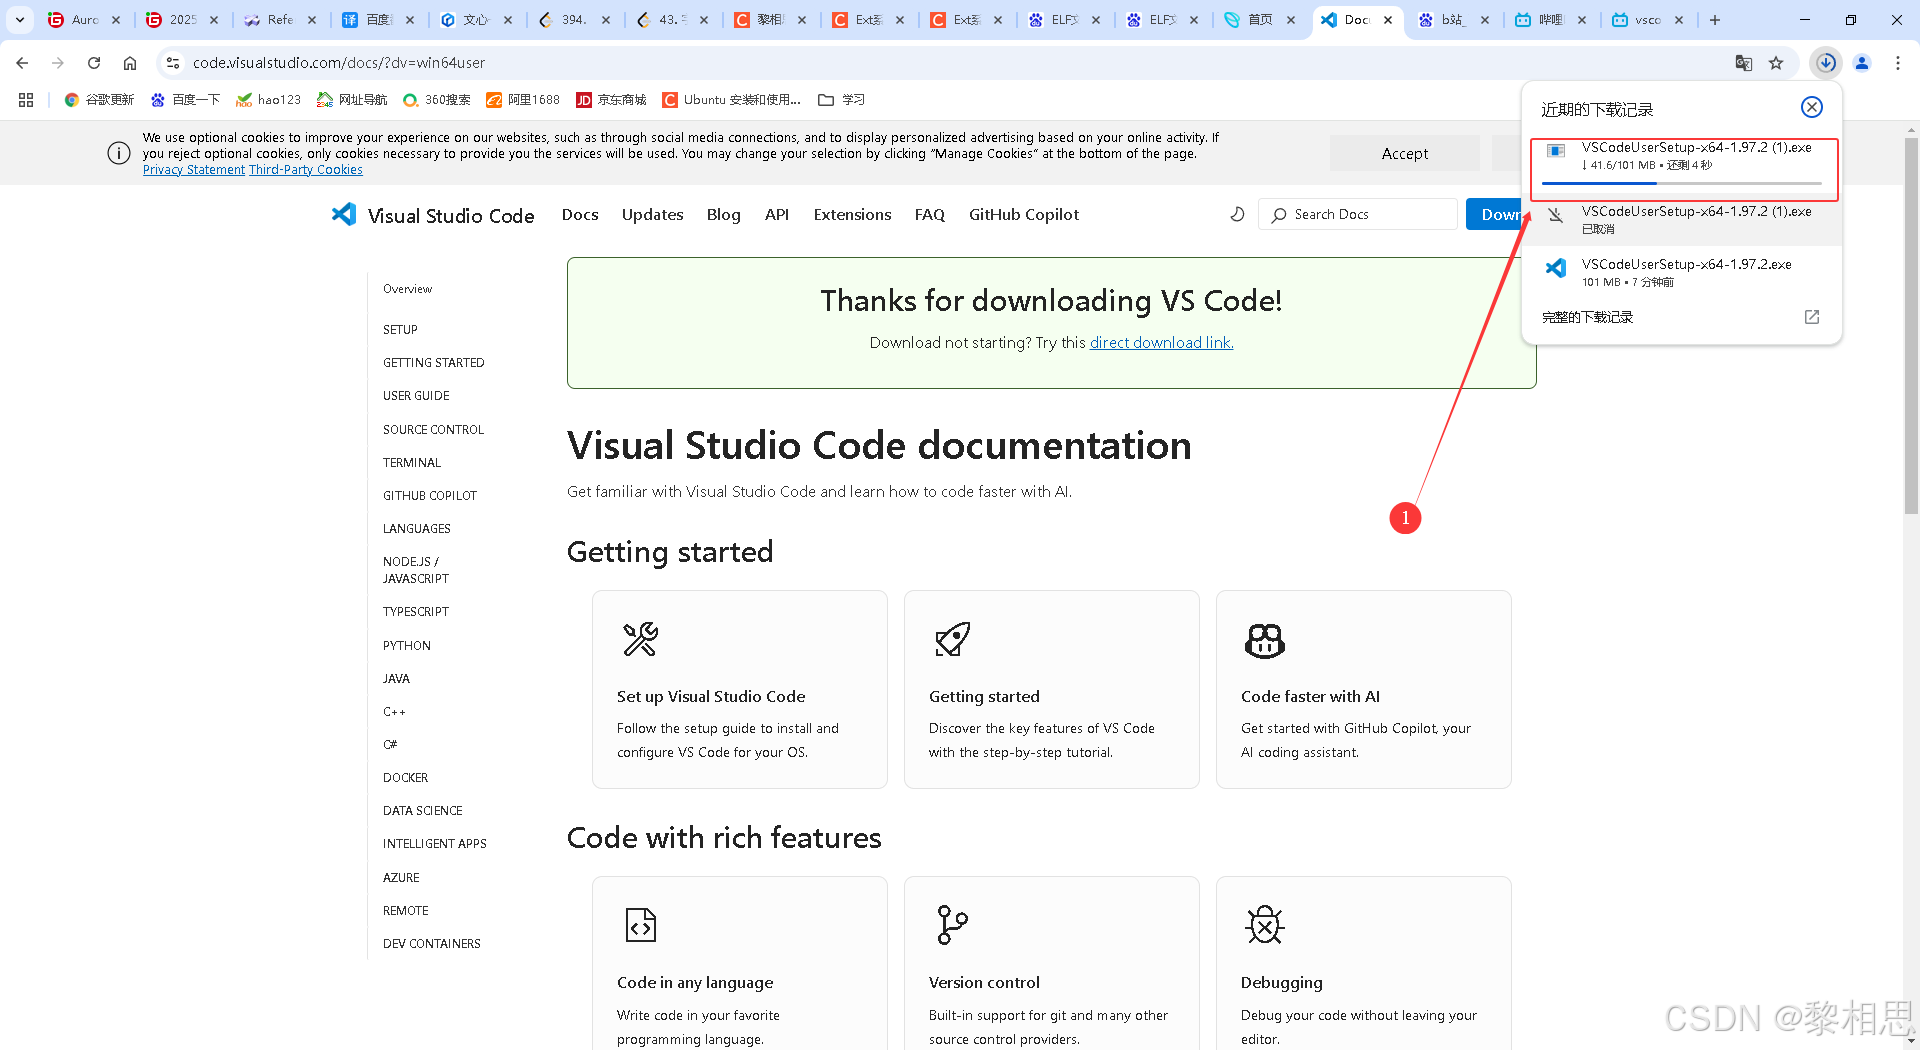
3.下载中,等待任务栏下载完成即可
2.2.2 安装
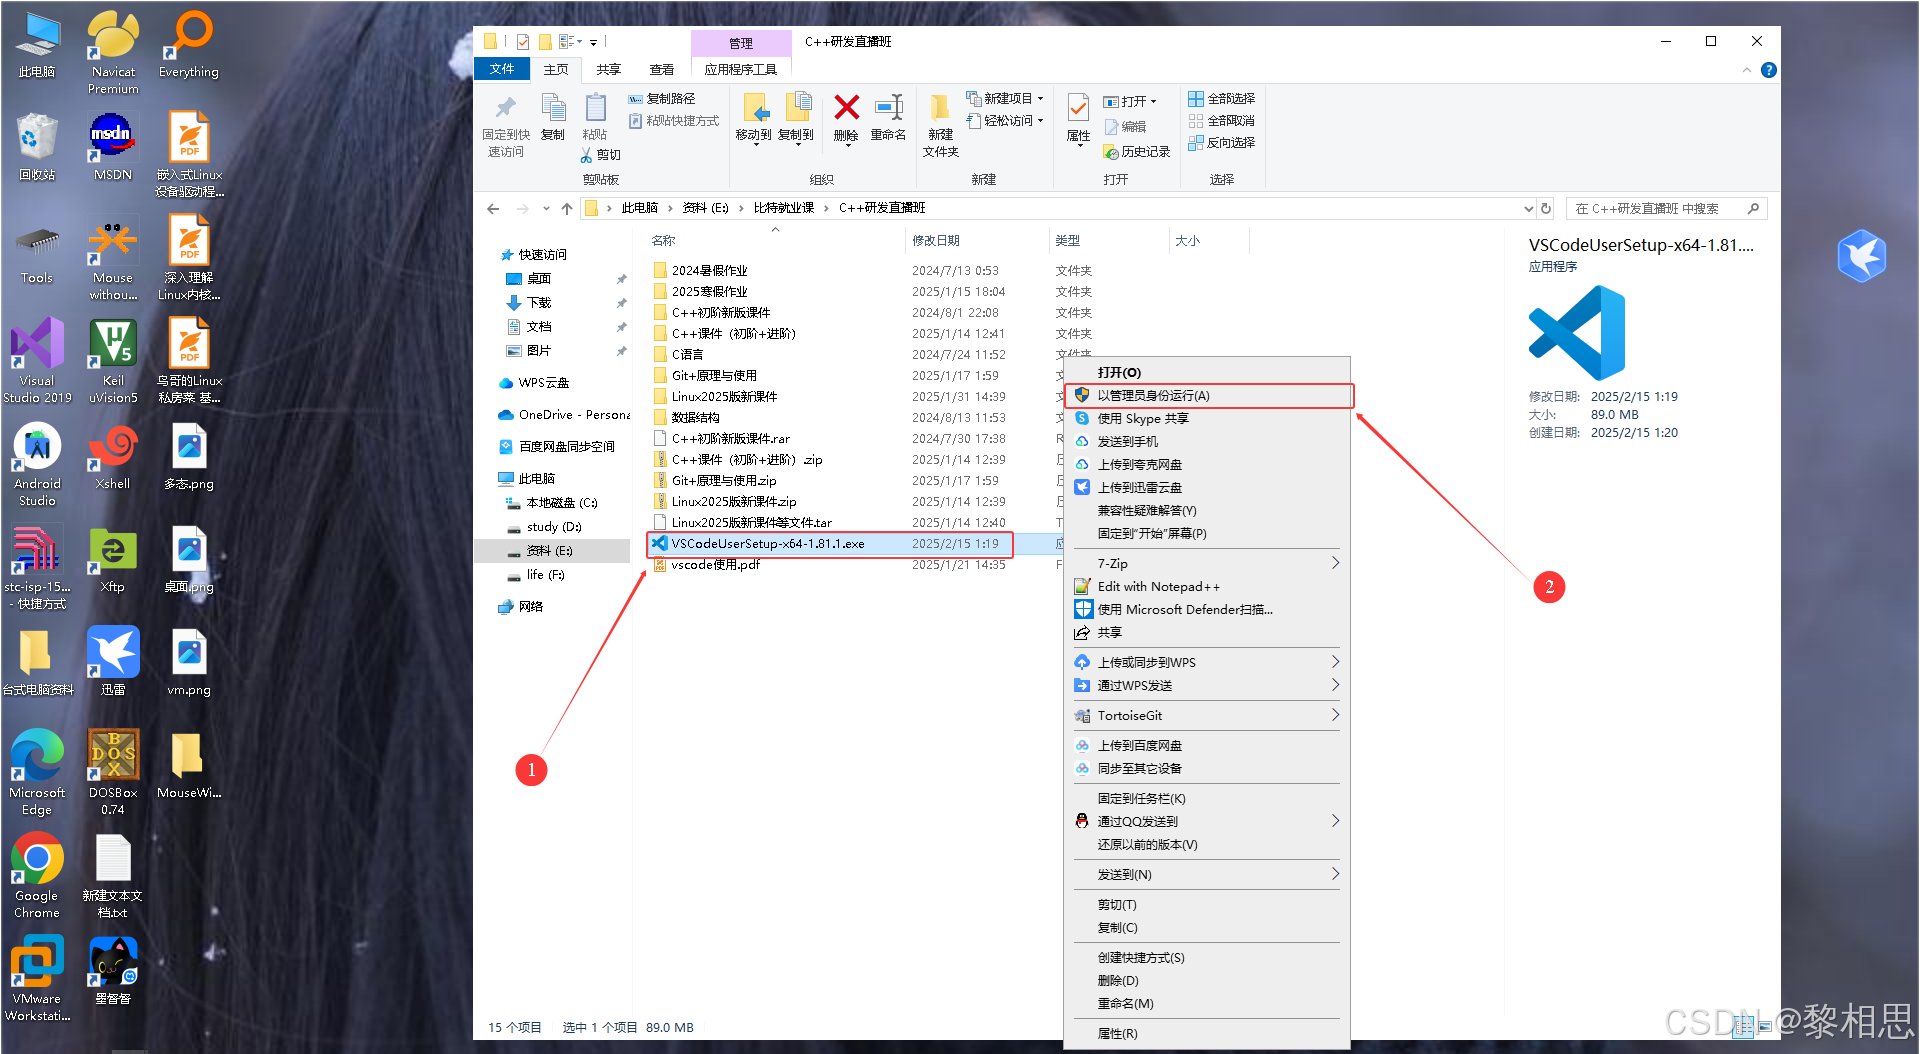
1. 右击以管理员身份打开我们的可执行程序
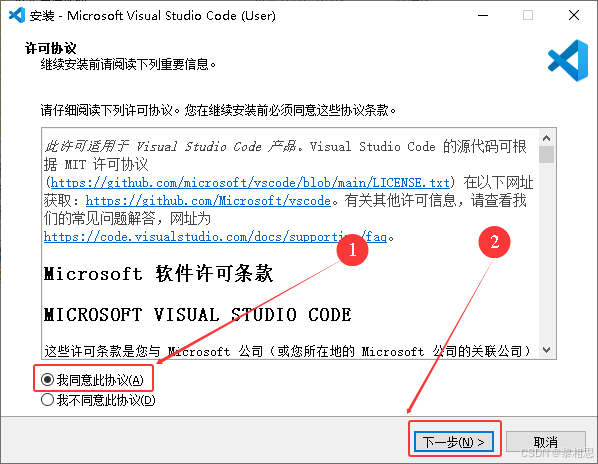
2. 点击同意此协议,然后下一步
3. 更改路径
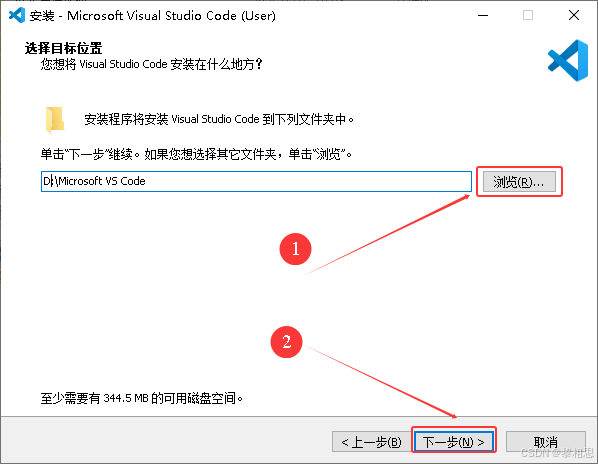
在这里可以更改软件的安装位置,我呢喜欢装在D盘,你也可以自己选择。然后点击下一步。
4. 点击下一步
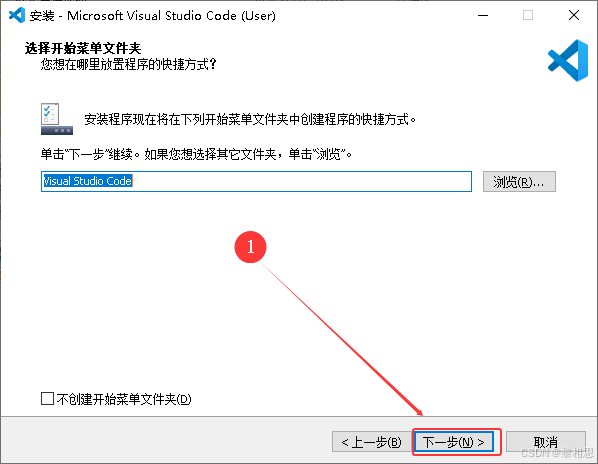
5. 选择项

可以全部勾选上,至于快捷方式,看个人自己,然后点击下一步。
6. 安装
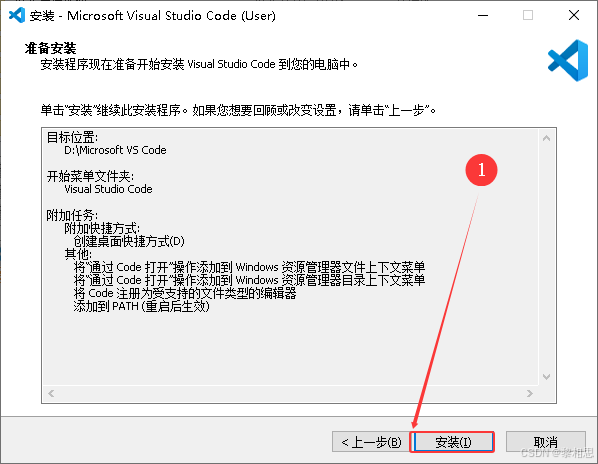
7. 等待安装完成
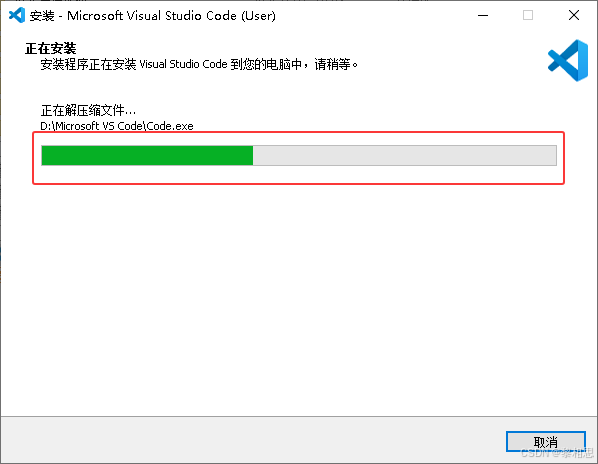
8. 点击完成
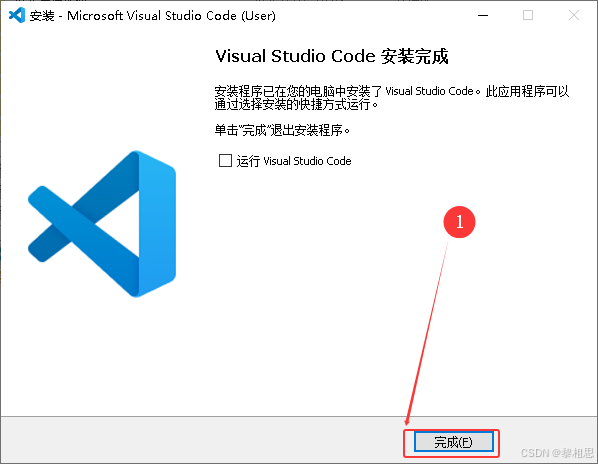
此时我们的VS Code就安装完成了。
2.2 环境的介绍
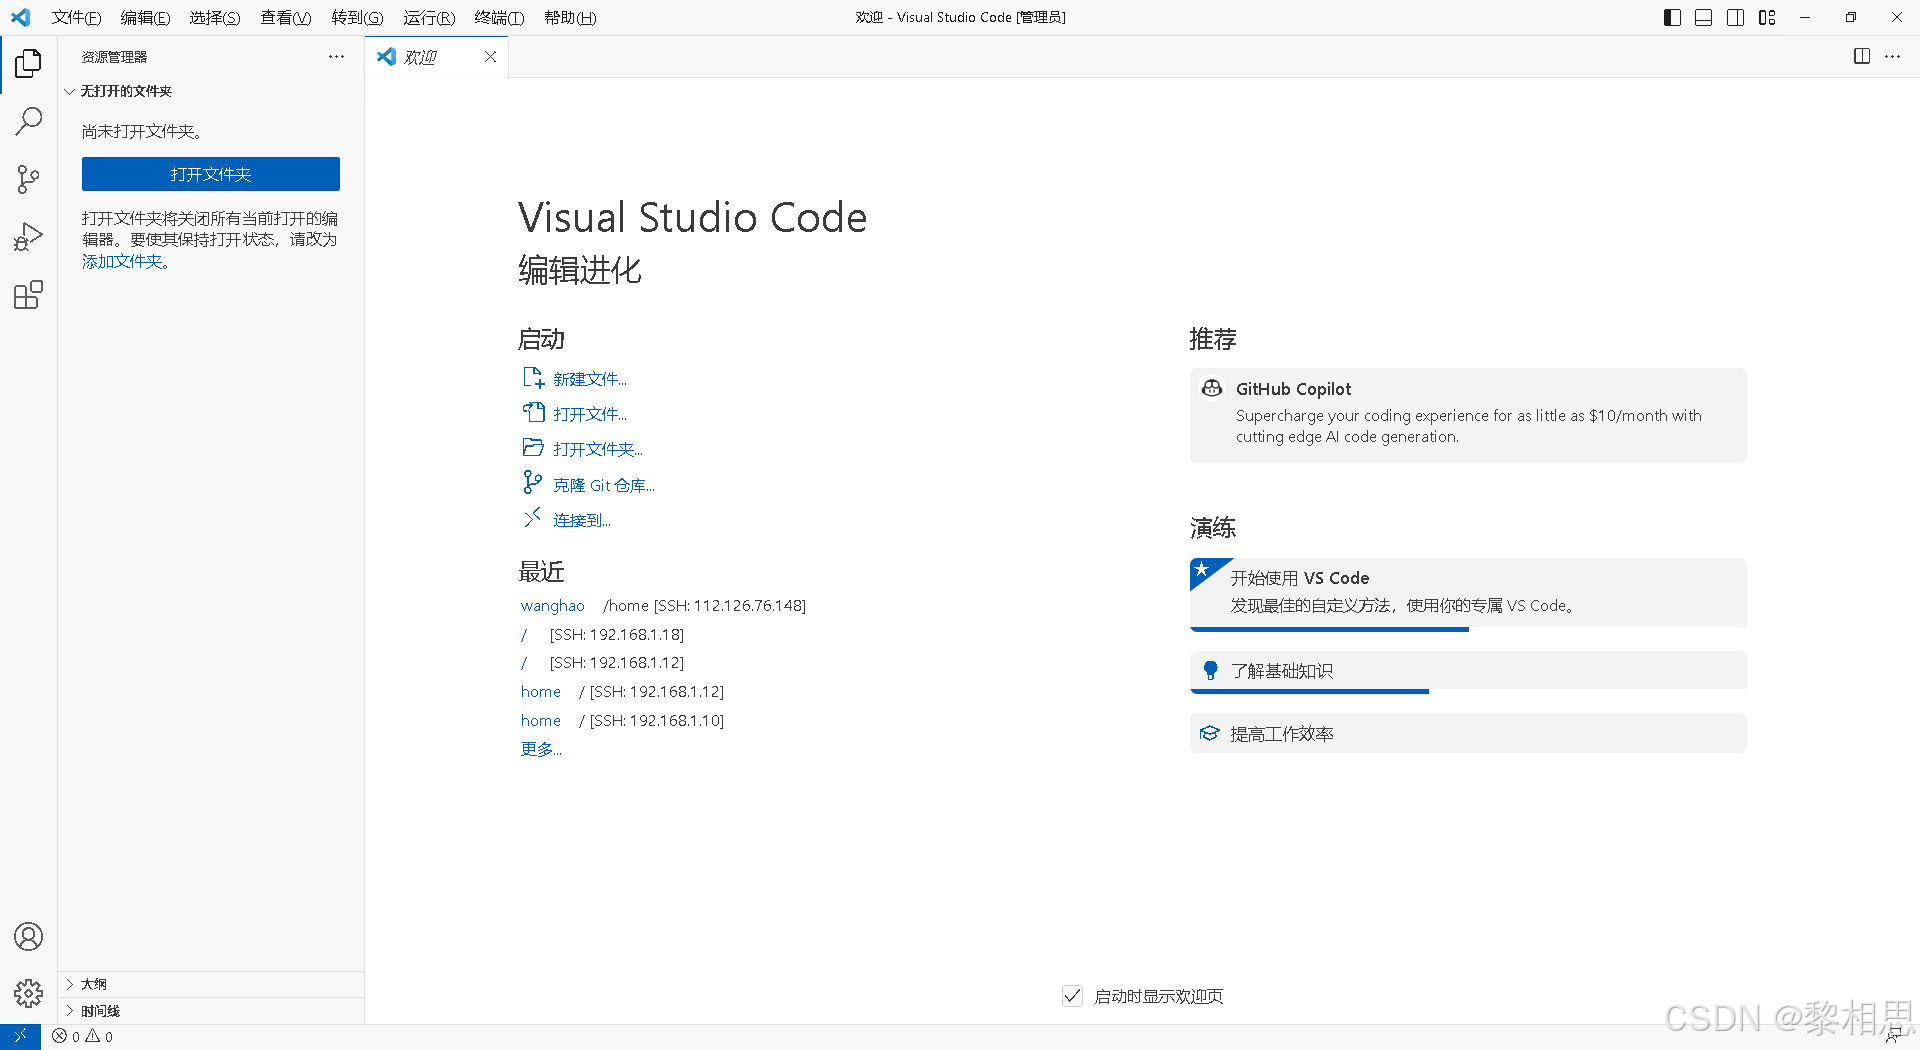
打开我们安装好的VS Code软件。
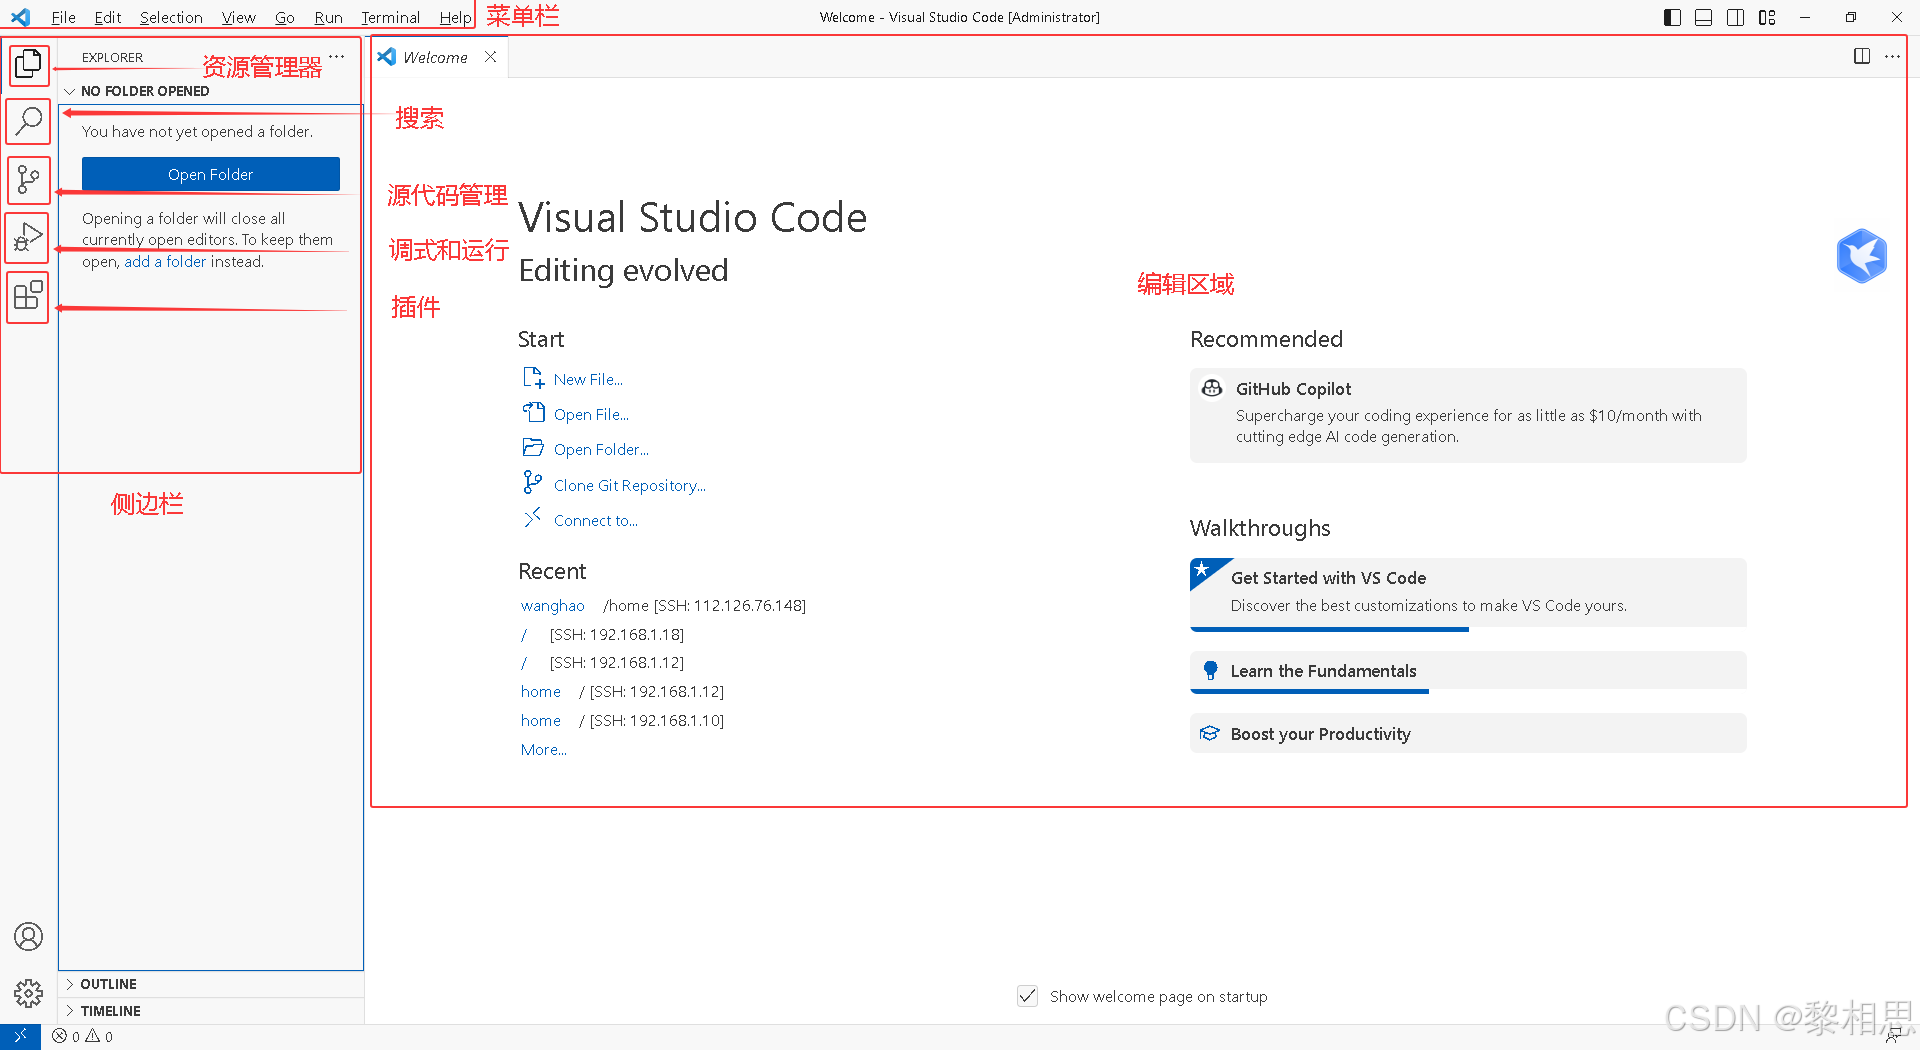
2.3 安装中文插件
毕竟这个VSCode默认是英文的,我们使用不习惯的话,可以安装中文插件,将VSCode的界面汉化的,
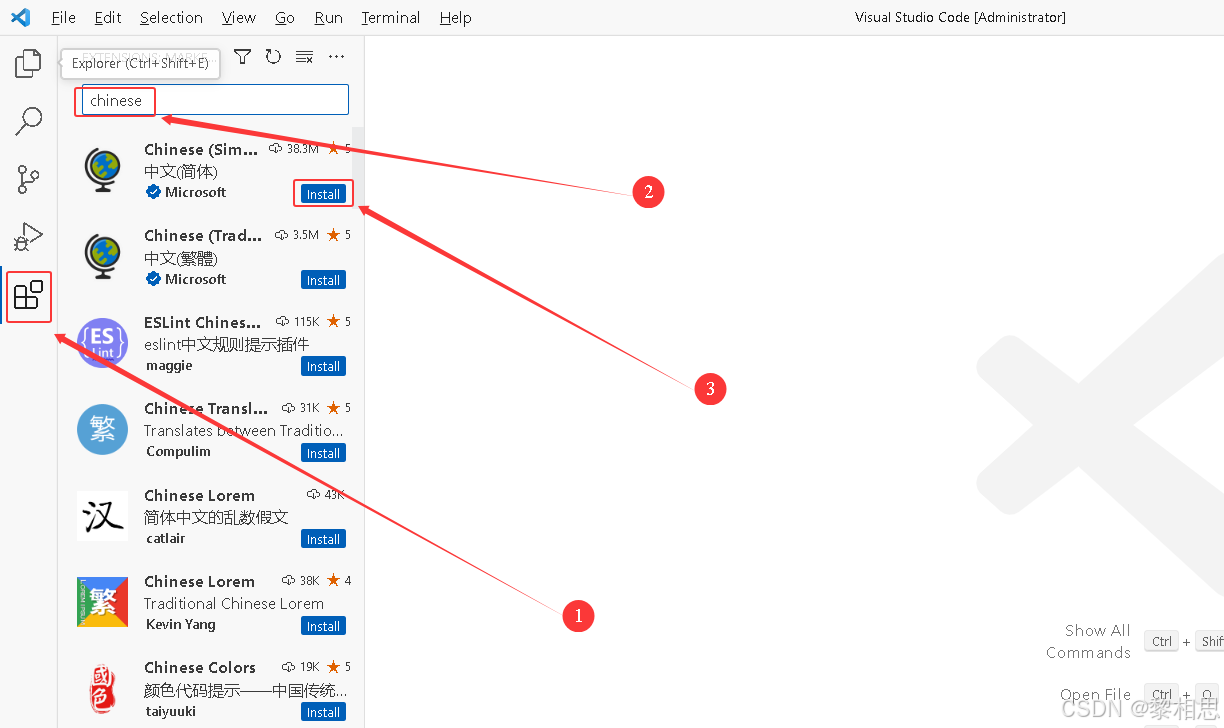
下载完成点击右下角.重启一下即可。
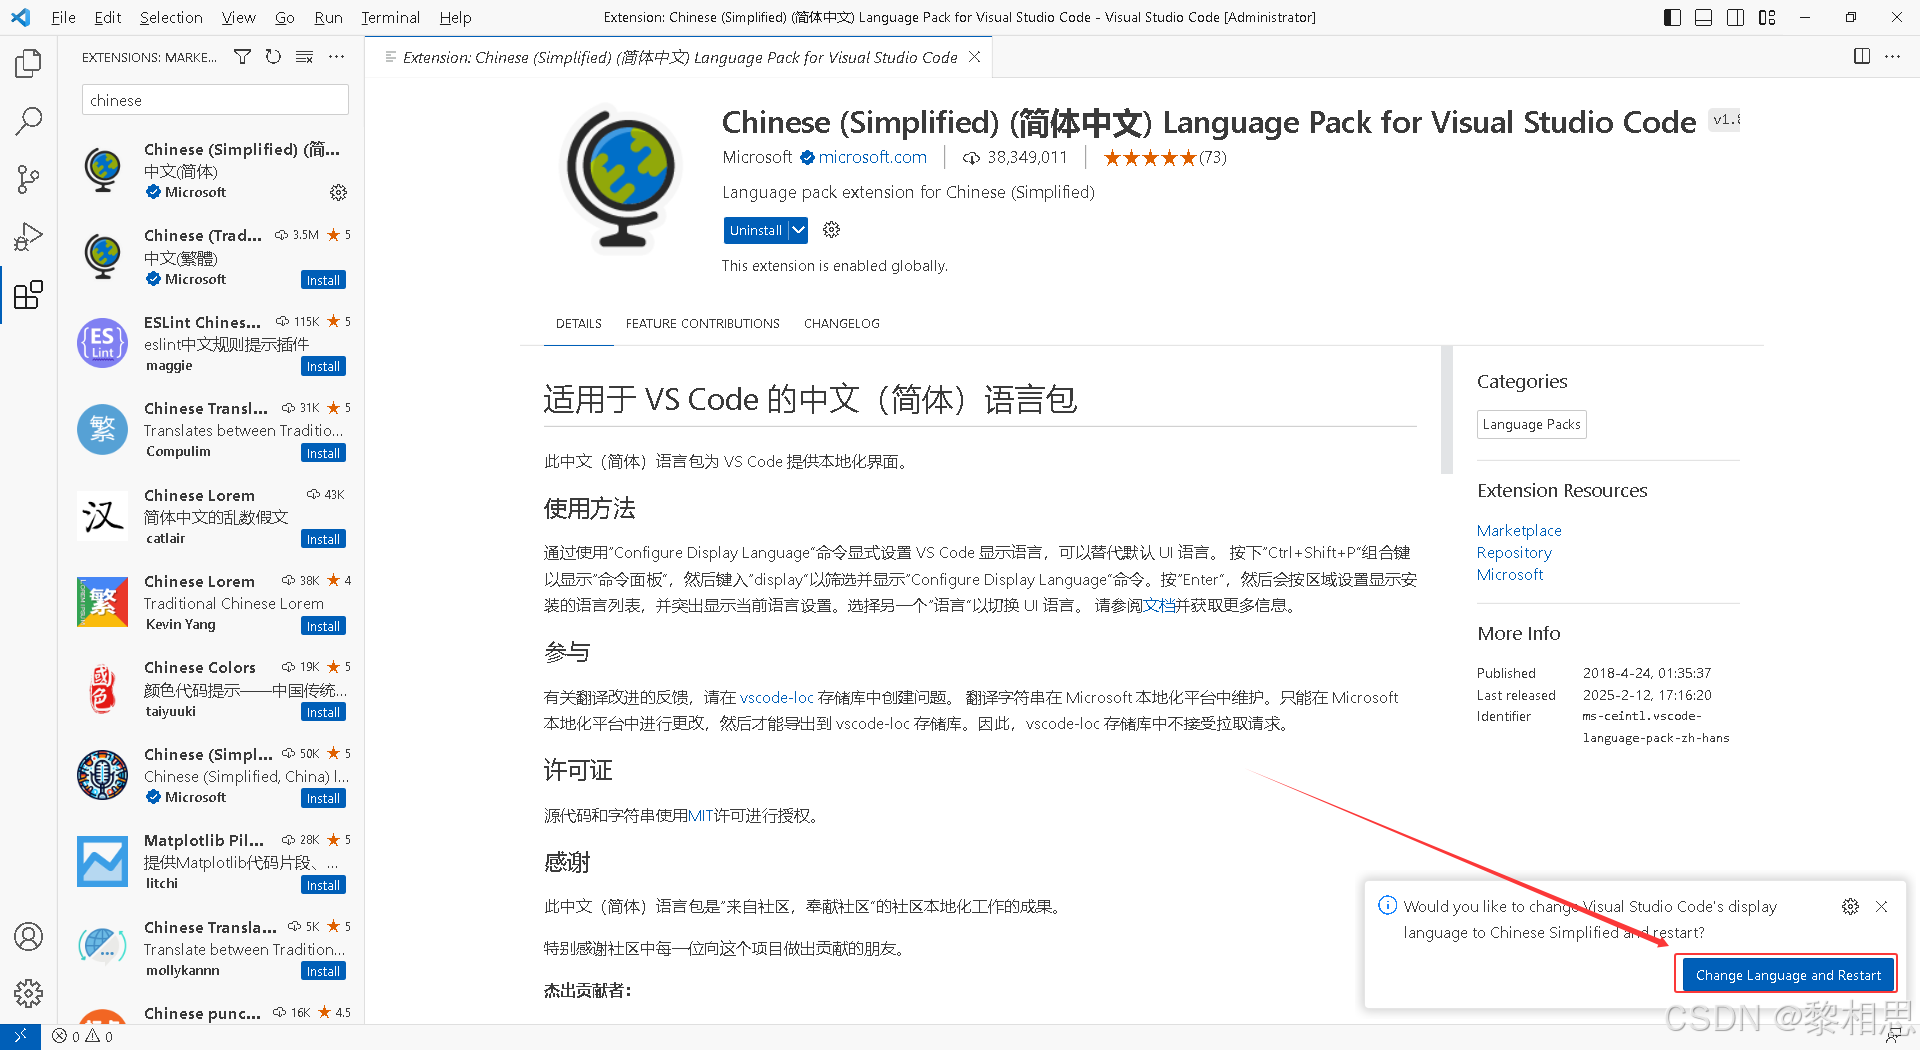
再次打开我们就汉化好了。
3. VS Code配置C/C++开发环境
VSCode 安装好之后,我们还是要知道,VSCode毕竟是一个高级的编辑器,只能用来写C/C++代码,不能直接编译代码。所以,如果我们要能使用VSCode搭建C/C++的编译和调试环境,还必须有编译器使用。为了方便,我们就使用 MinGw-w64, MinGw-w64 移植到windows平台的一个gcc编译器,使用起来也是非常方便的。
3.1 下载和配置MinGW-w64编译器套件
3.1.1 下载
下载地址:https://sourceforge.net/projects/mingw-w64/files/![]() https://sourceforge.net/projects/mingw-w64/files/
https://sourceforge.net/projects/mingw-w64/files/
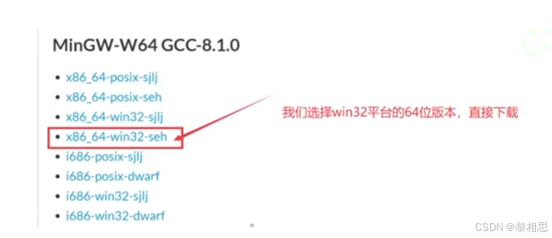
建议选择这个版本。
迅雷链接:
迅雷云盘迅雷云盘![]() https://pan.xunlei.com/s/VOJ9ibzwlQ452IPLeoQ4jTAdA1?pwd=k4iw#接下来就是解压,解压出来后,进到文件夹中,拷贝mingw64这个文件夹到一个最简单的目录下,路径的名字不要有中文、空格、特殊字符等。
https://pan.xunlei.com/s/VOJ9ibzwlQ452IPLeoQ4jTAdA1?pwd=k4iw#接下来就是解压,解压出来后,进到文件夹中,拷贝mingw64这个文件夹到一个最简单的目录下,路径的名字不要有中文、空格、特殊字符等。

此时mingw64的编译器的路径就是: D : \mingw64

3.1.2 配置
配置MinGW64:
在windows电脑上,按win+s快捷键,或者直接在搜索框中搜索:环境变量
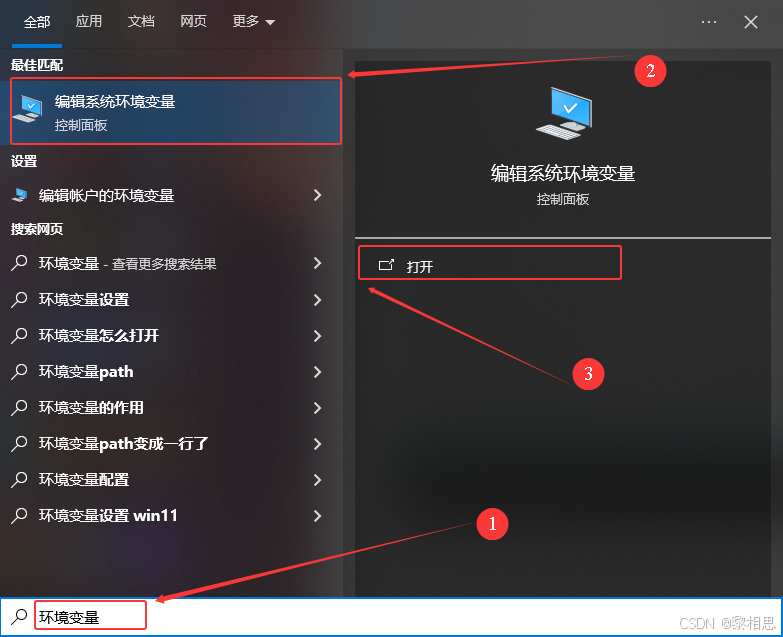
进入系统属性,点击【环境变量】
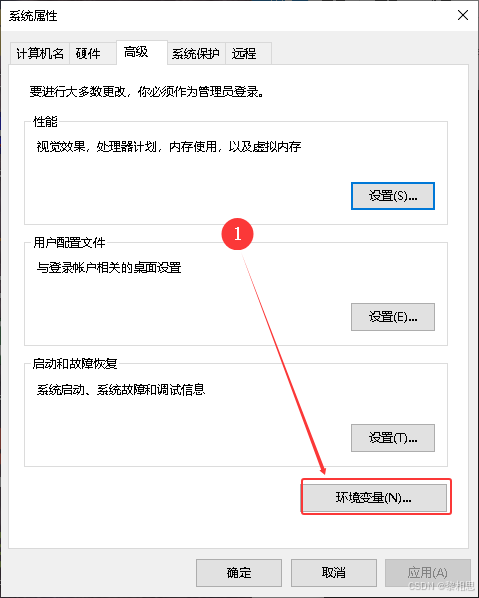
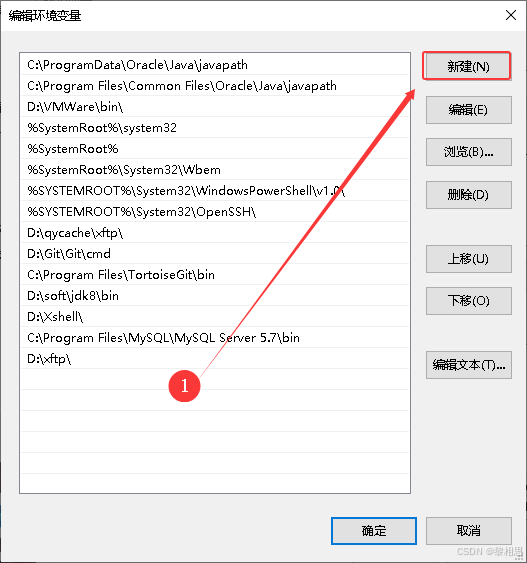
修改path环境变量
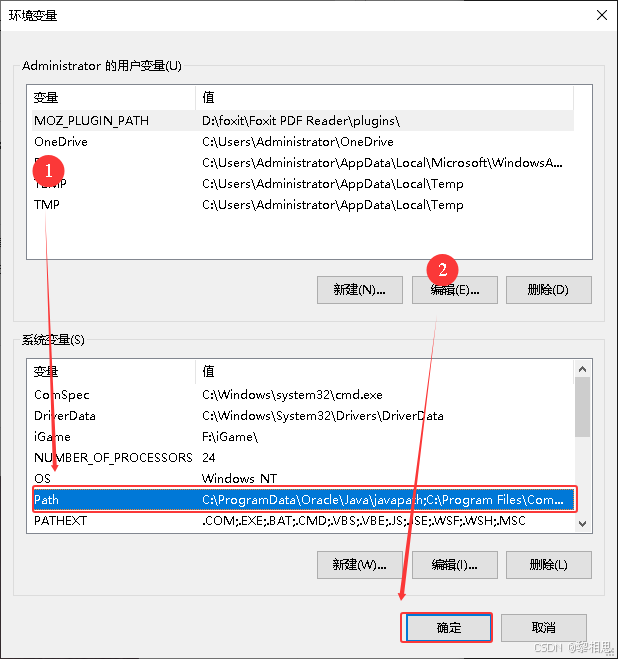
添加环境变量
添加的是mingw64的bin目录,我的我是放在了D盘下的。
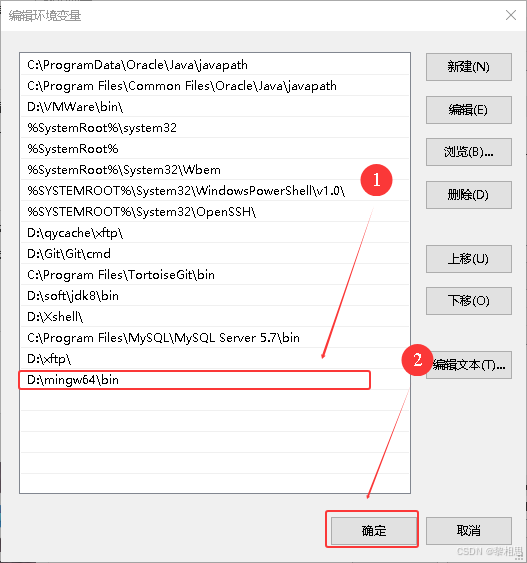
然后一路确定下去即可。
验证一下:
在windows电脑上打开cmd窗口,输入:gcc --version或者 where gcc,要是能看到下面的界面,就说明minGW-w64的编译器套件依旧配置好了。

到此为止,Windows版本的gcc/g++编译器已经配置好了,如果你会使用gcc/g++命令行编译代码的话,已经可以正常使用了,但是我们如果使用VSCode来写代码,并且完成编译,还是不够的。
3.2 安装C/C++插件
要在VSCode上编译代码,还得配置C/C++插件,再次在扩展中搜索C/C++,点击安装。
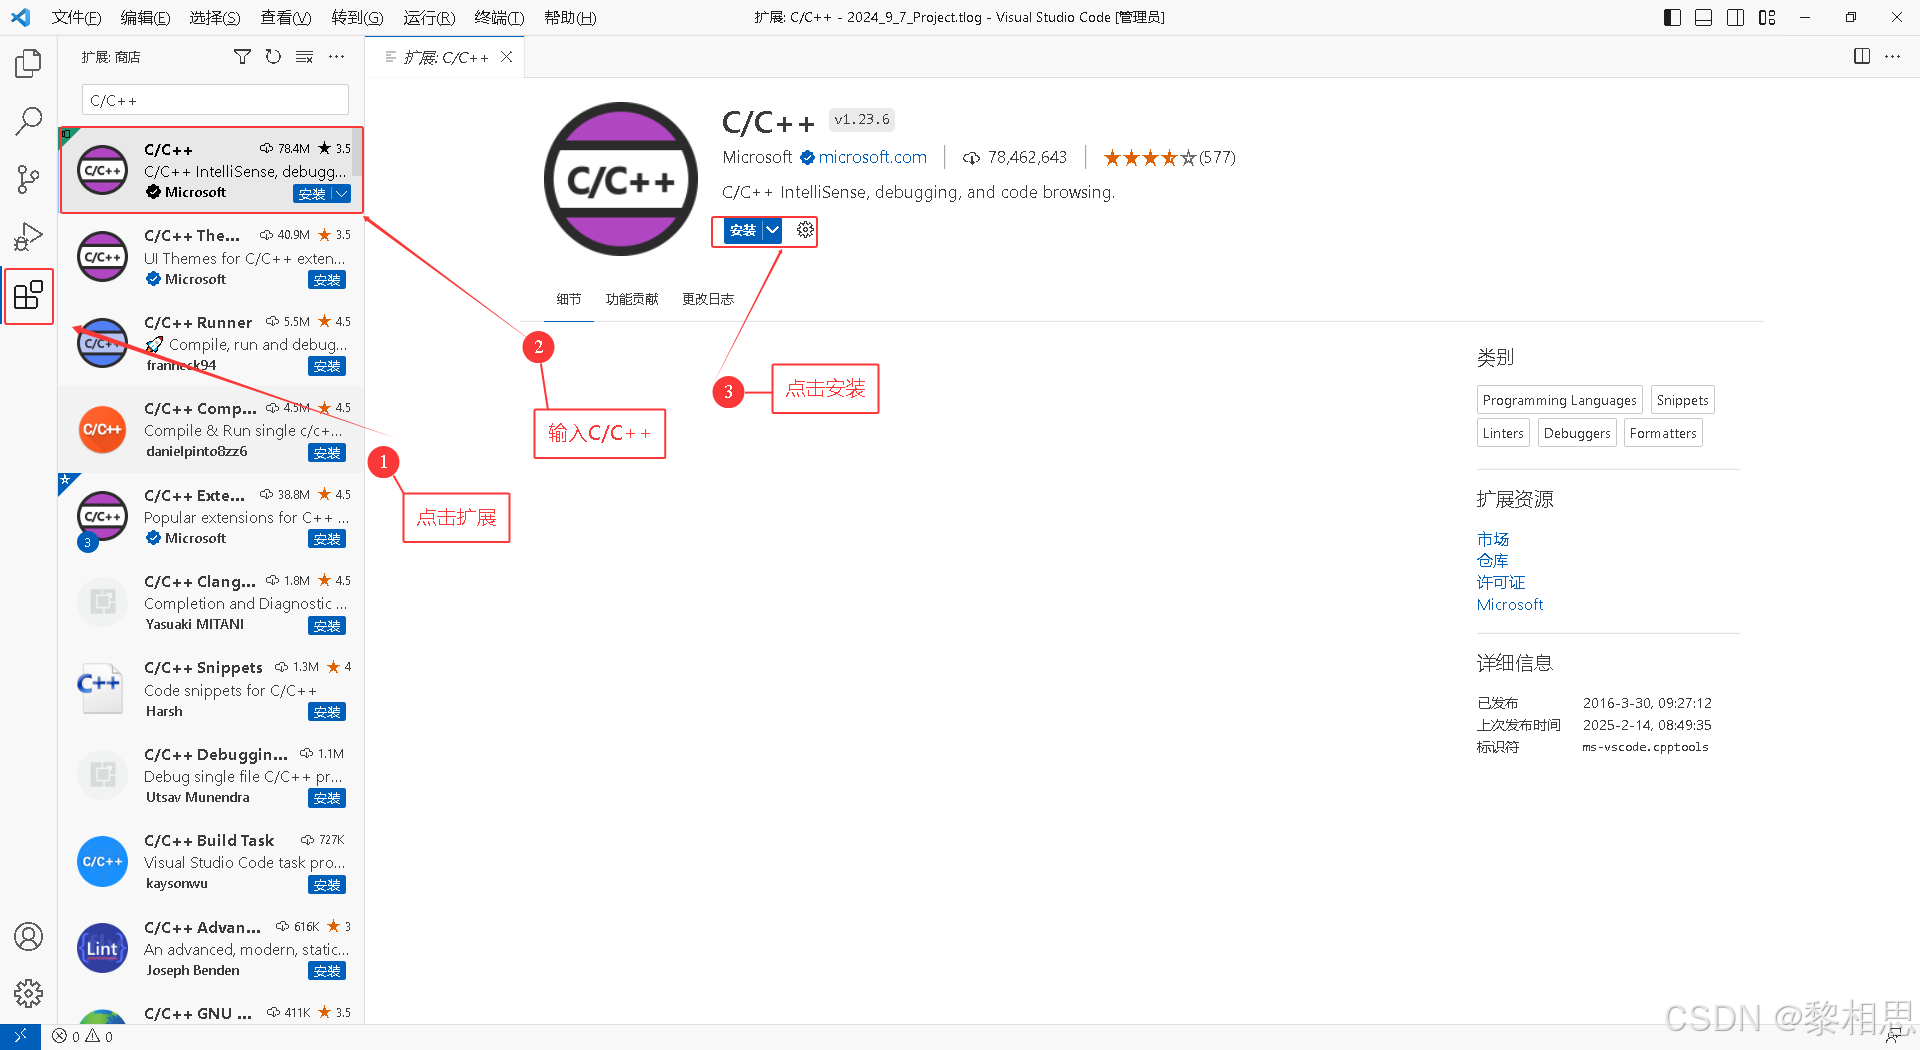
3.3 重启VSCode
这一步很重要,让前面的设置生效,要不然后面会出现问题。
4. 在VSCode上编写C语言代码并编译成功
4.1 打开文件夹
在VSCode上写代码都是首先要打开文件夹的,这样也方便管理代码和编译器产生的可执行程序,和VSCode生成的配置文件等。
在写代码之前,我们要想清楚要把代码放在什么地方管理,比如在F盘下创建一个Code文件夹,用来管理我所写的代码,然后里面再创建一个文件夹,存放我的一个工程文件。
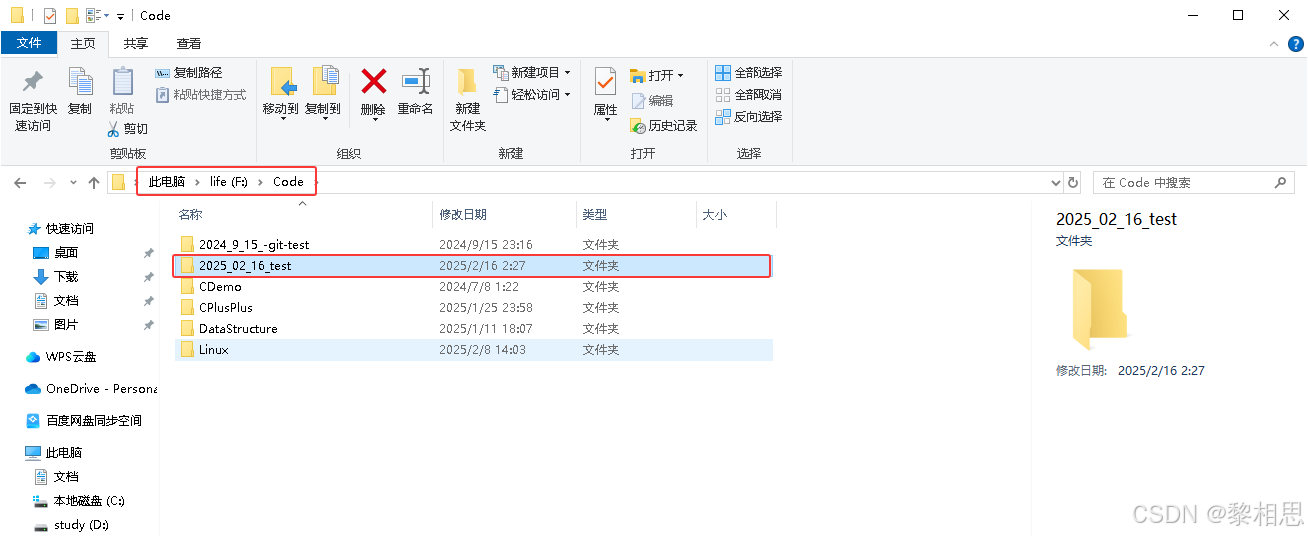
在我们写代码前先创建好文件夹,然后在VSCode中打开所新建的文件夹。
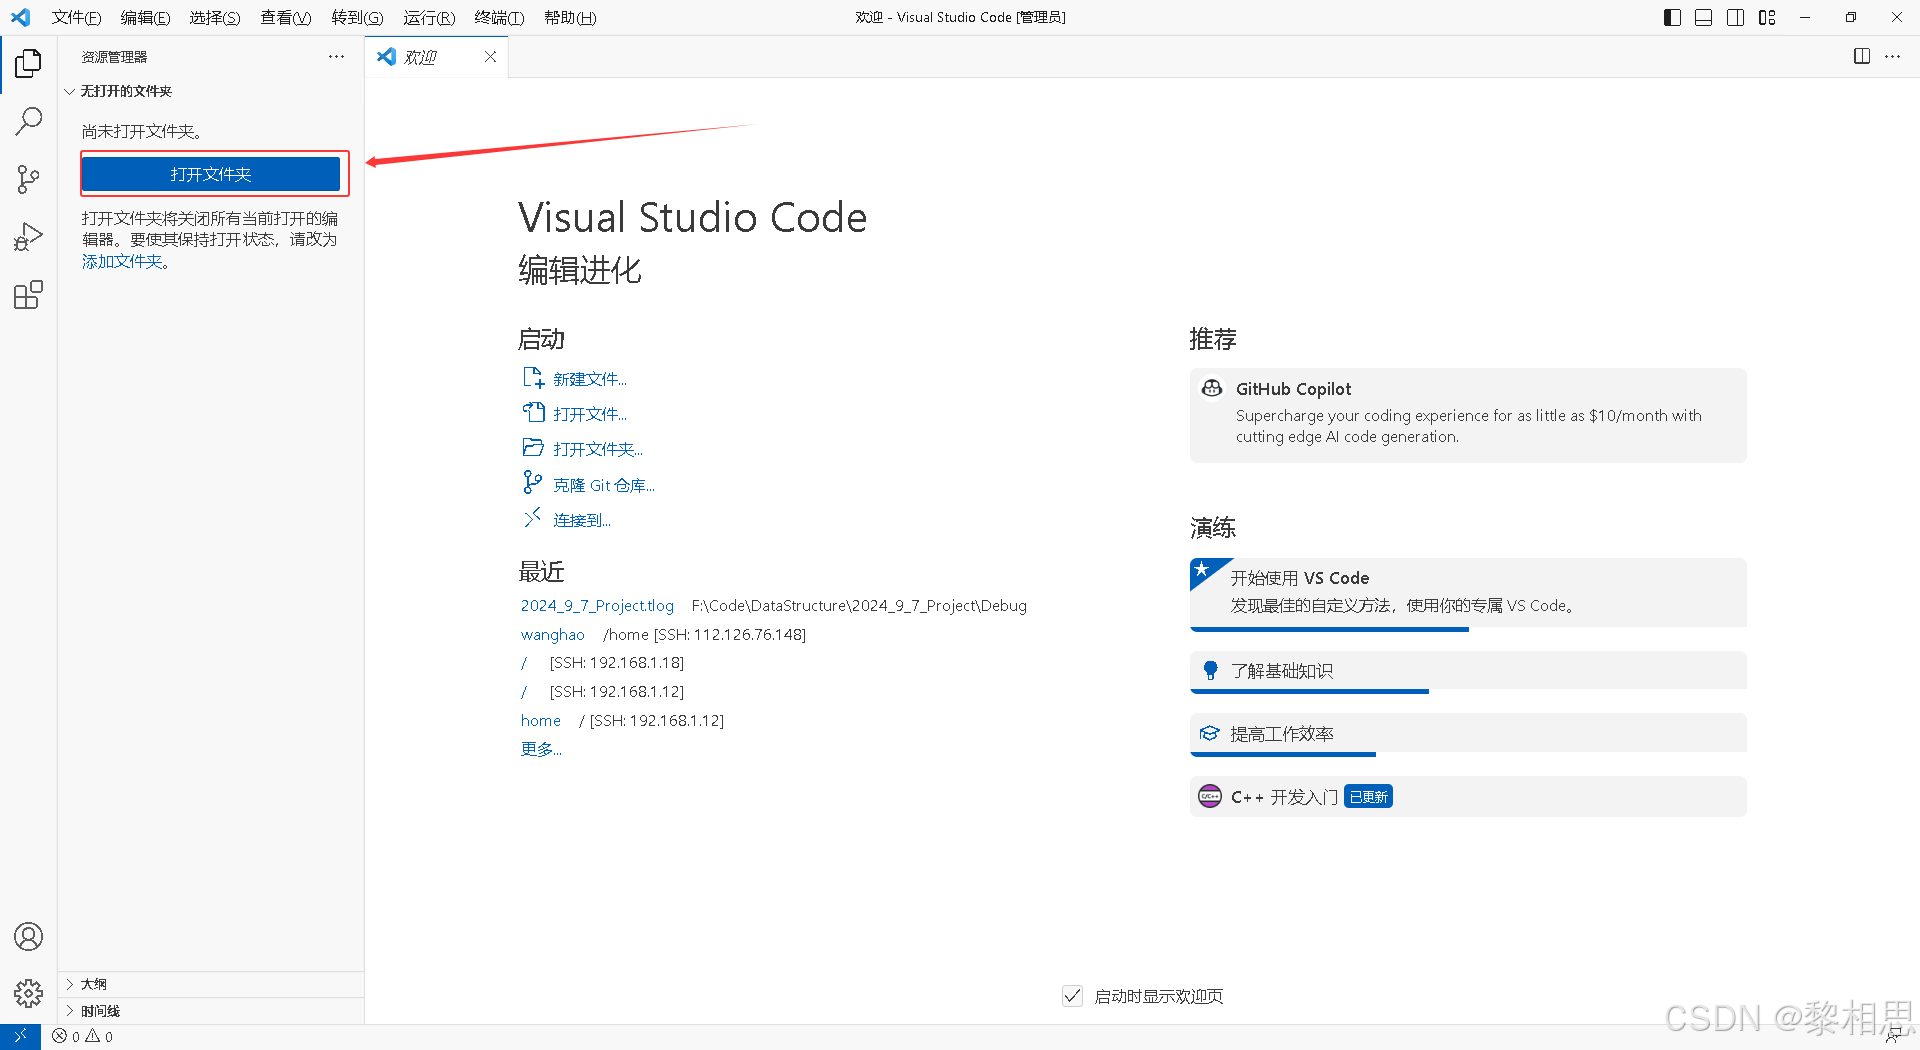
选择我们刚刚创建的文件夹。
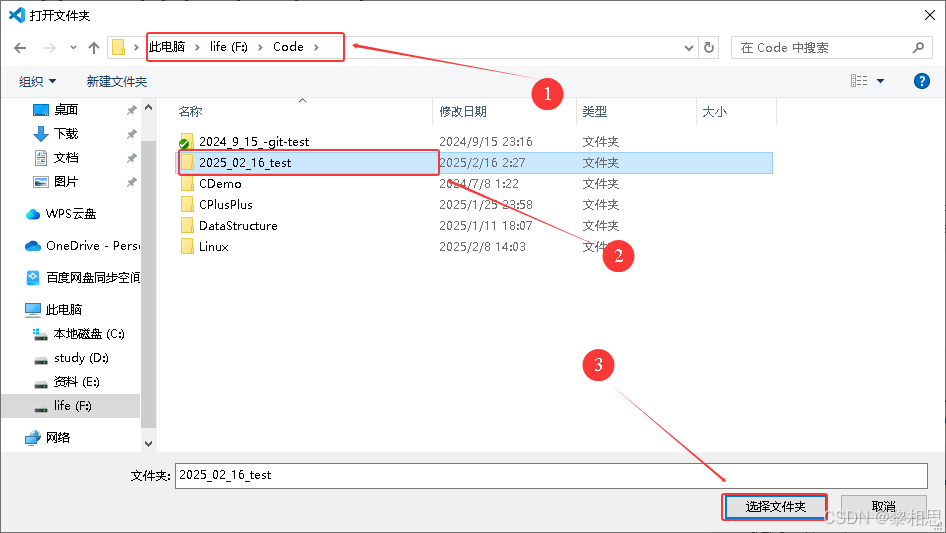
然后点击信任此作者
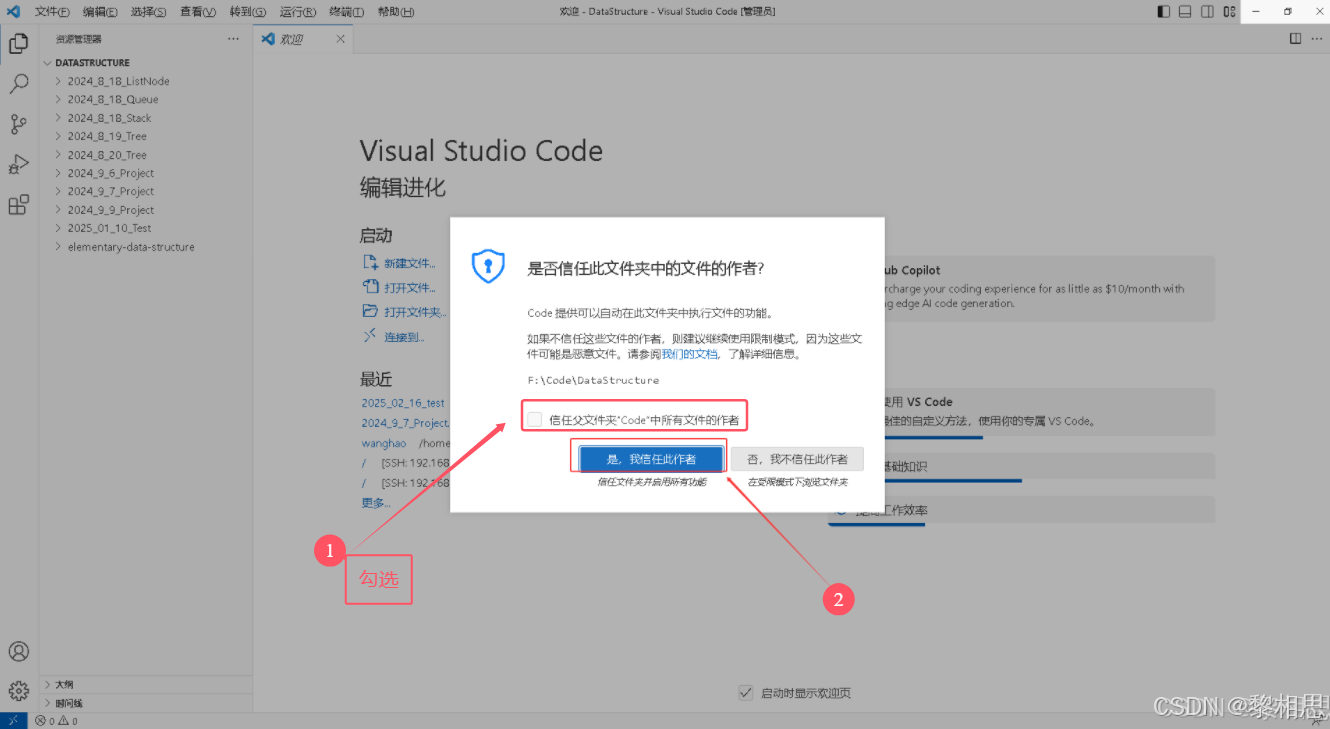
然后在左边就能看见我的文件夹了,名字被大写了,这是VSCode的一个特点。
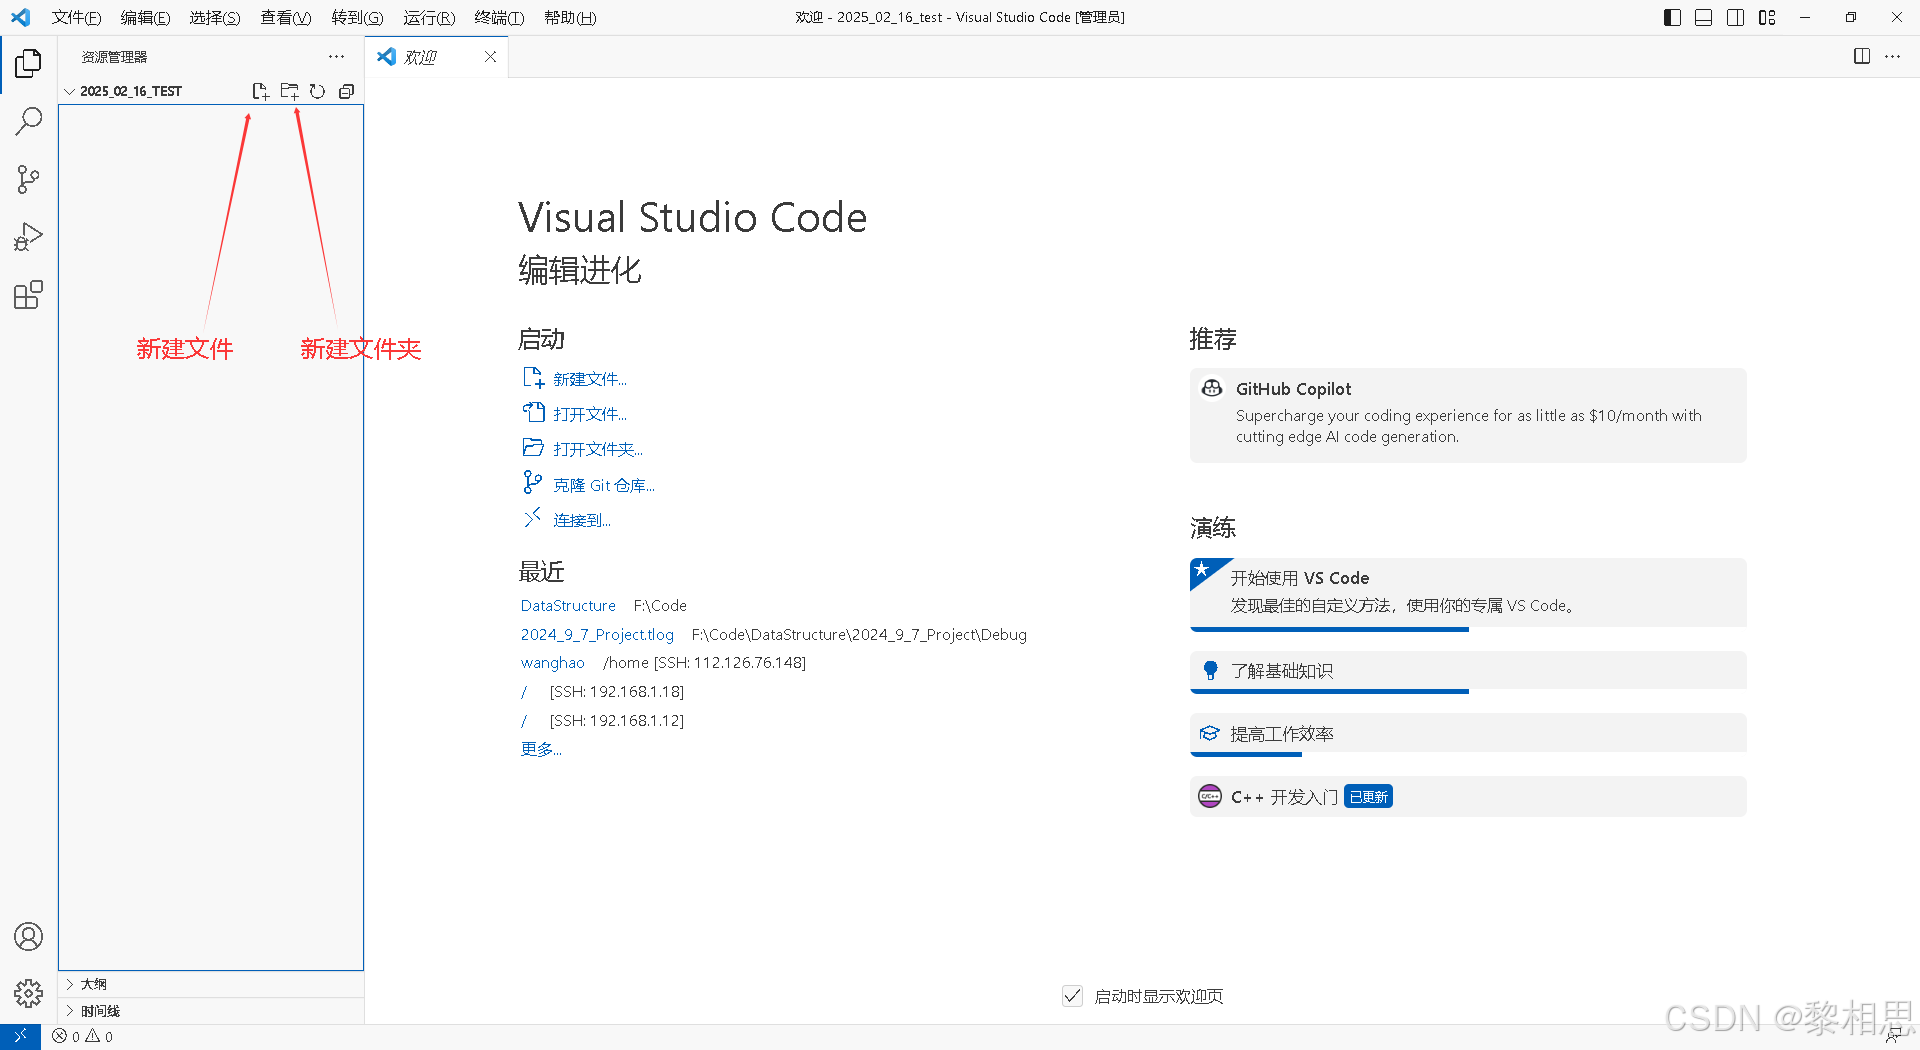
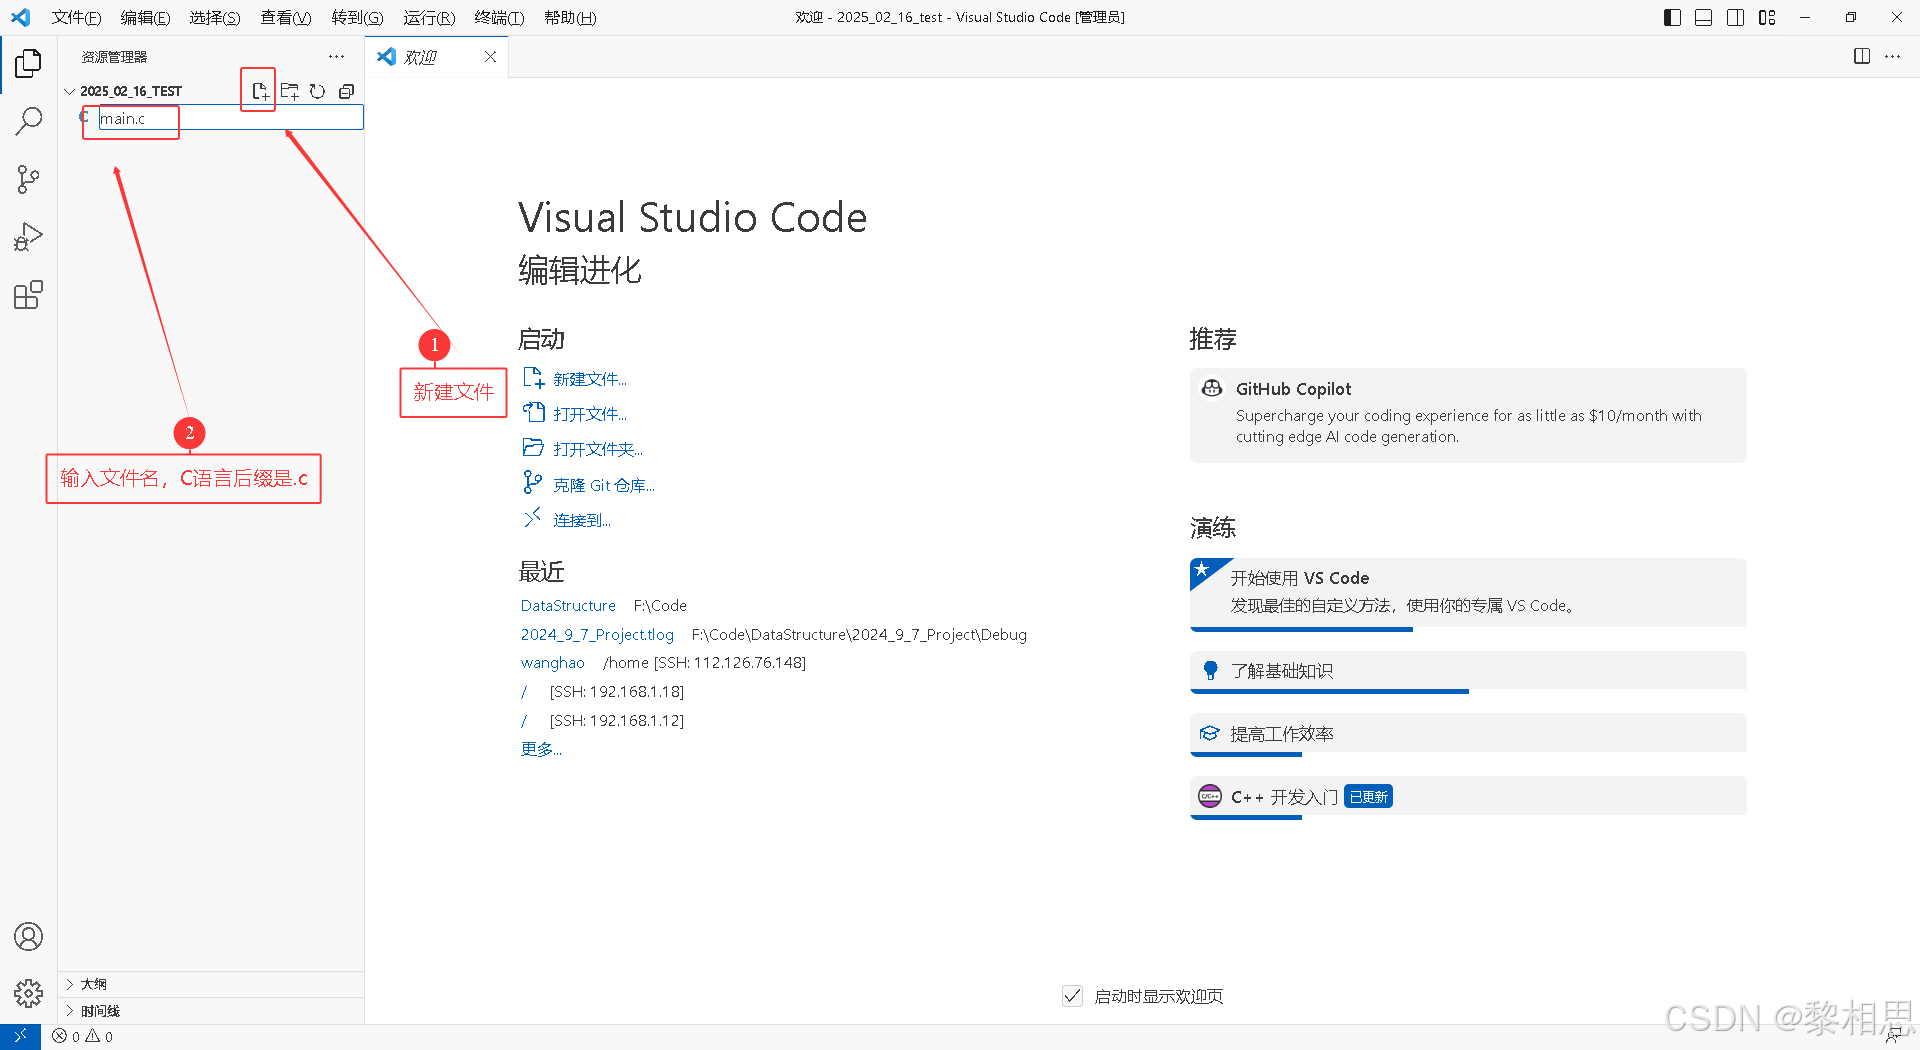
4.2 新建C语言文件,编写C语言代码
创建C语言文件:
编写代码:
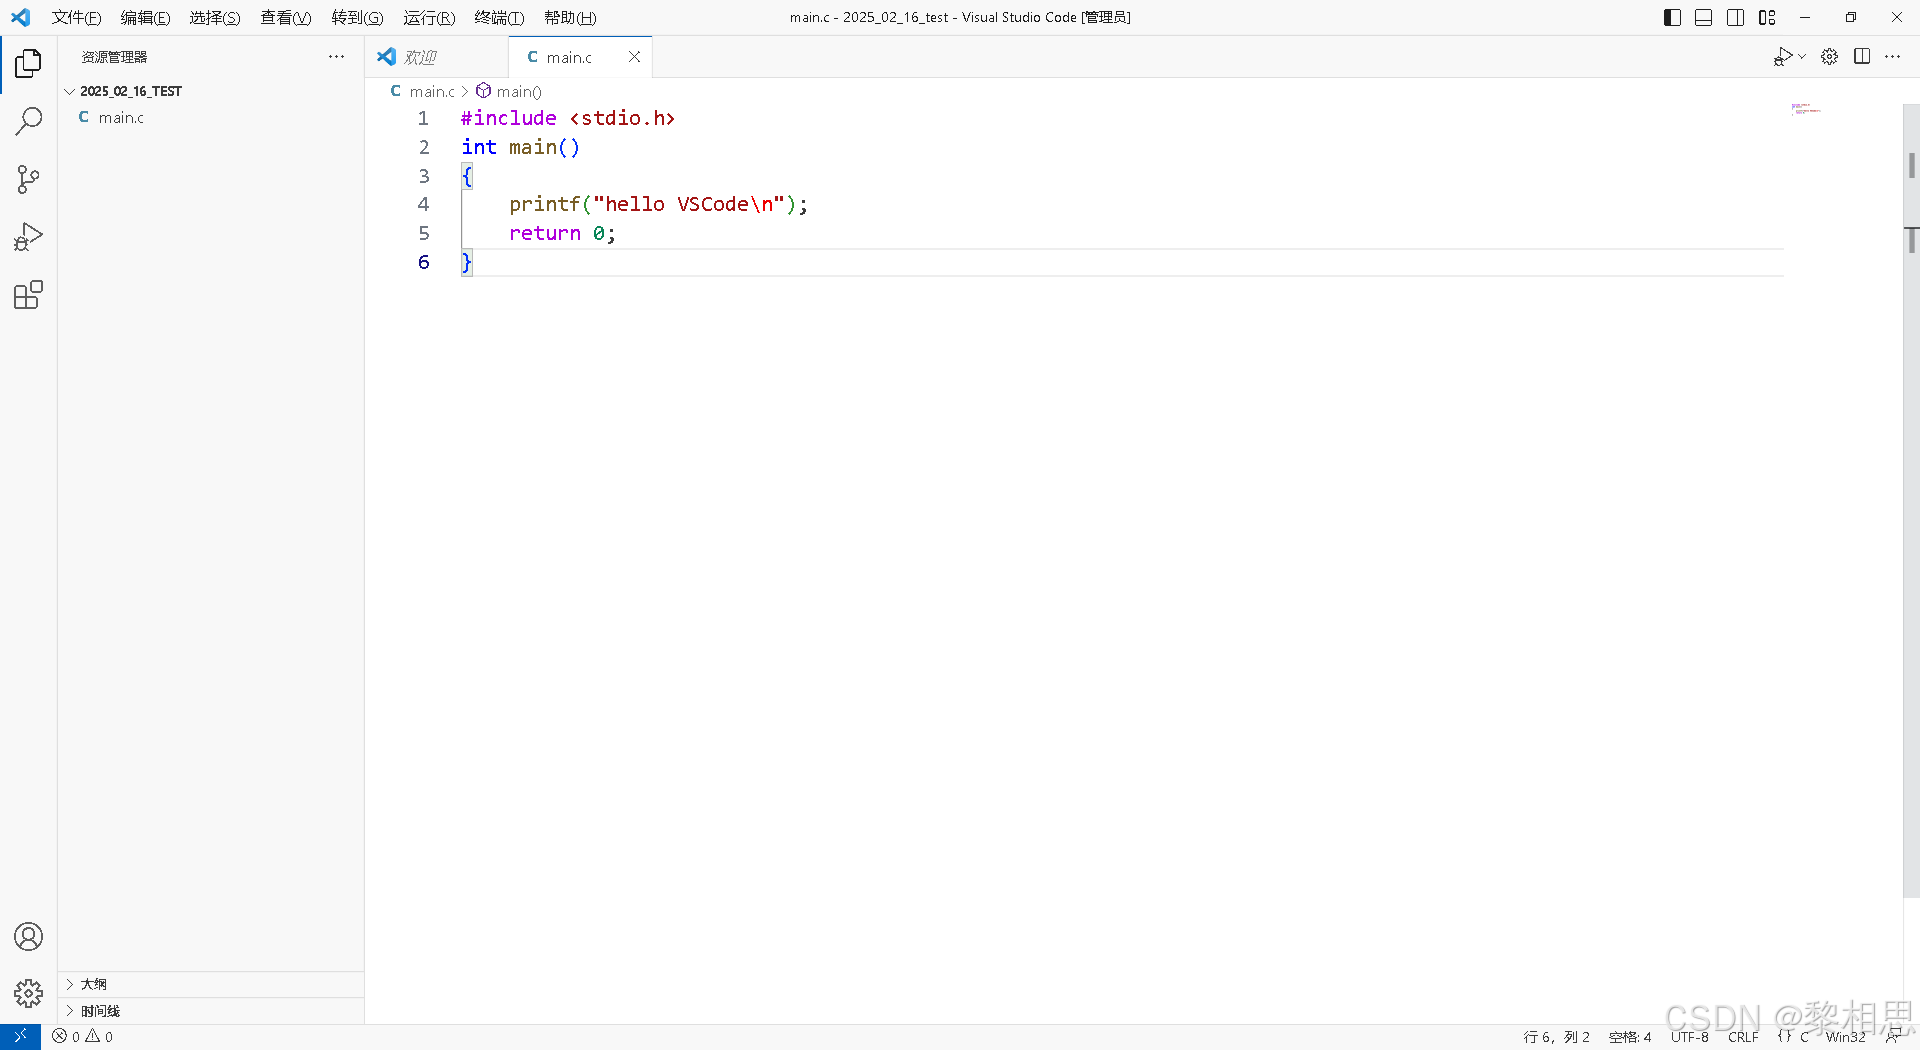
代码写好了,接下来我们要编译代码。
4.3 设置C/C++编译的选项: c_cpp_properties.json
鼠标点在.c的源文件内部,按ctrl+shift+p快捷键,在弹出的界面中选择:【C/C++:编辑配置(UI)】,然后进入设置页面。(找不到了可以搜一下)
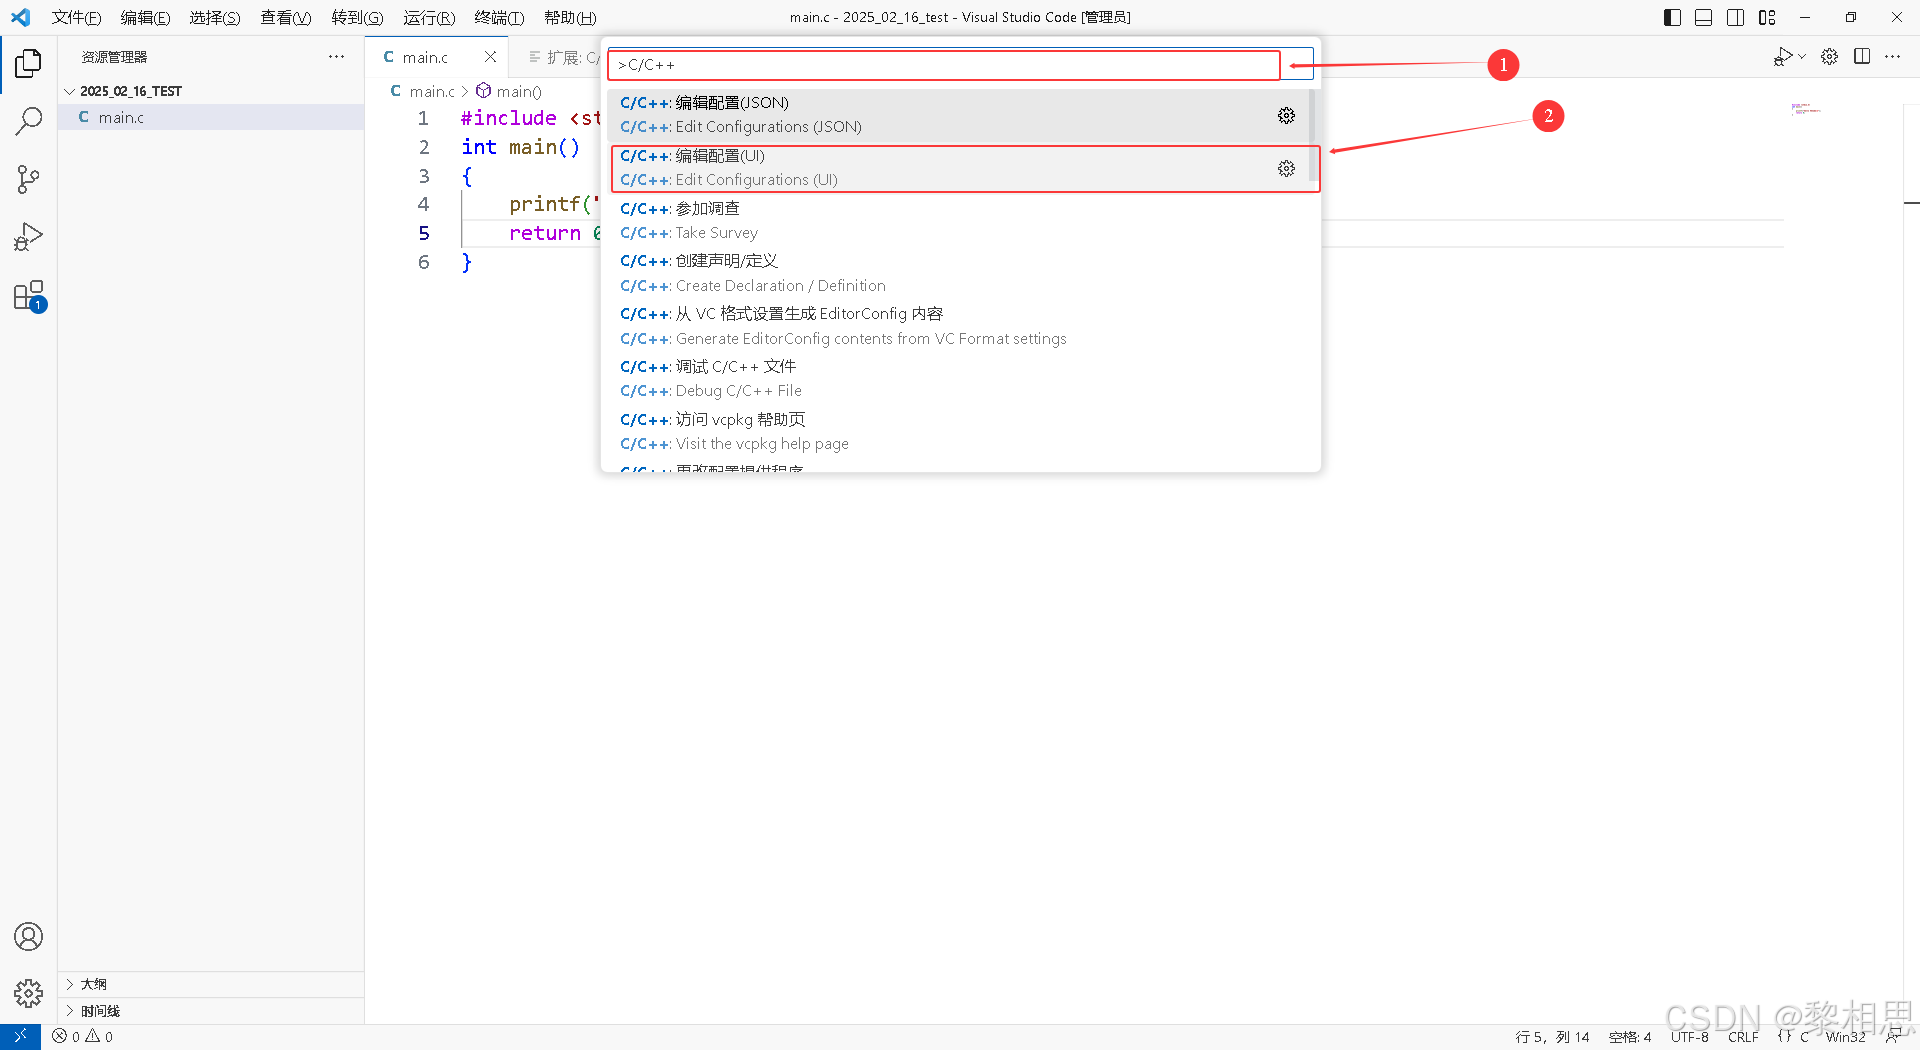
选择编译器:

点开小三角,选择mingw64下的bin目录下的gcc.exe,因为我还装了VS2019,所以选项很多。
IntelliSense模式配置:
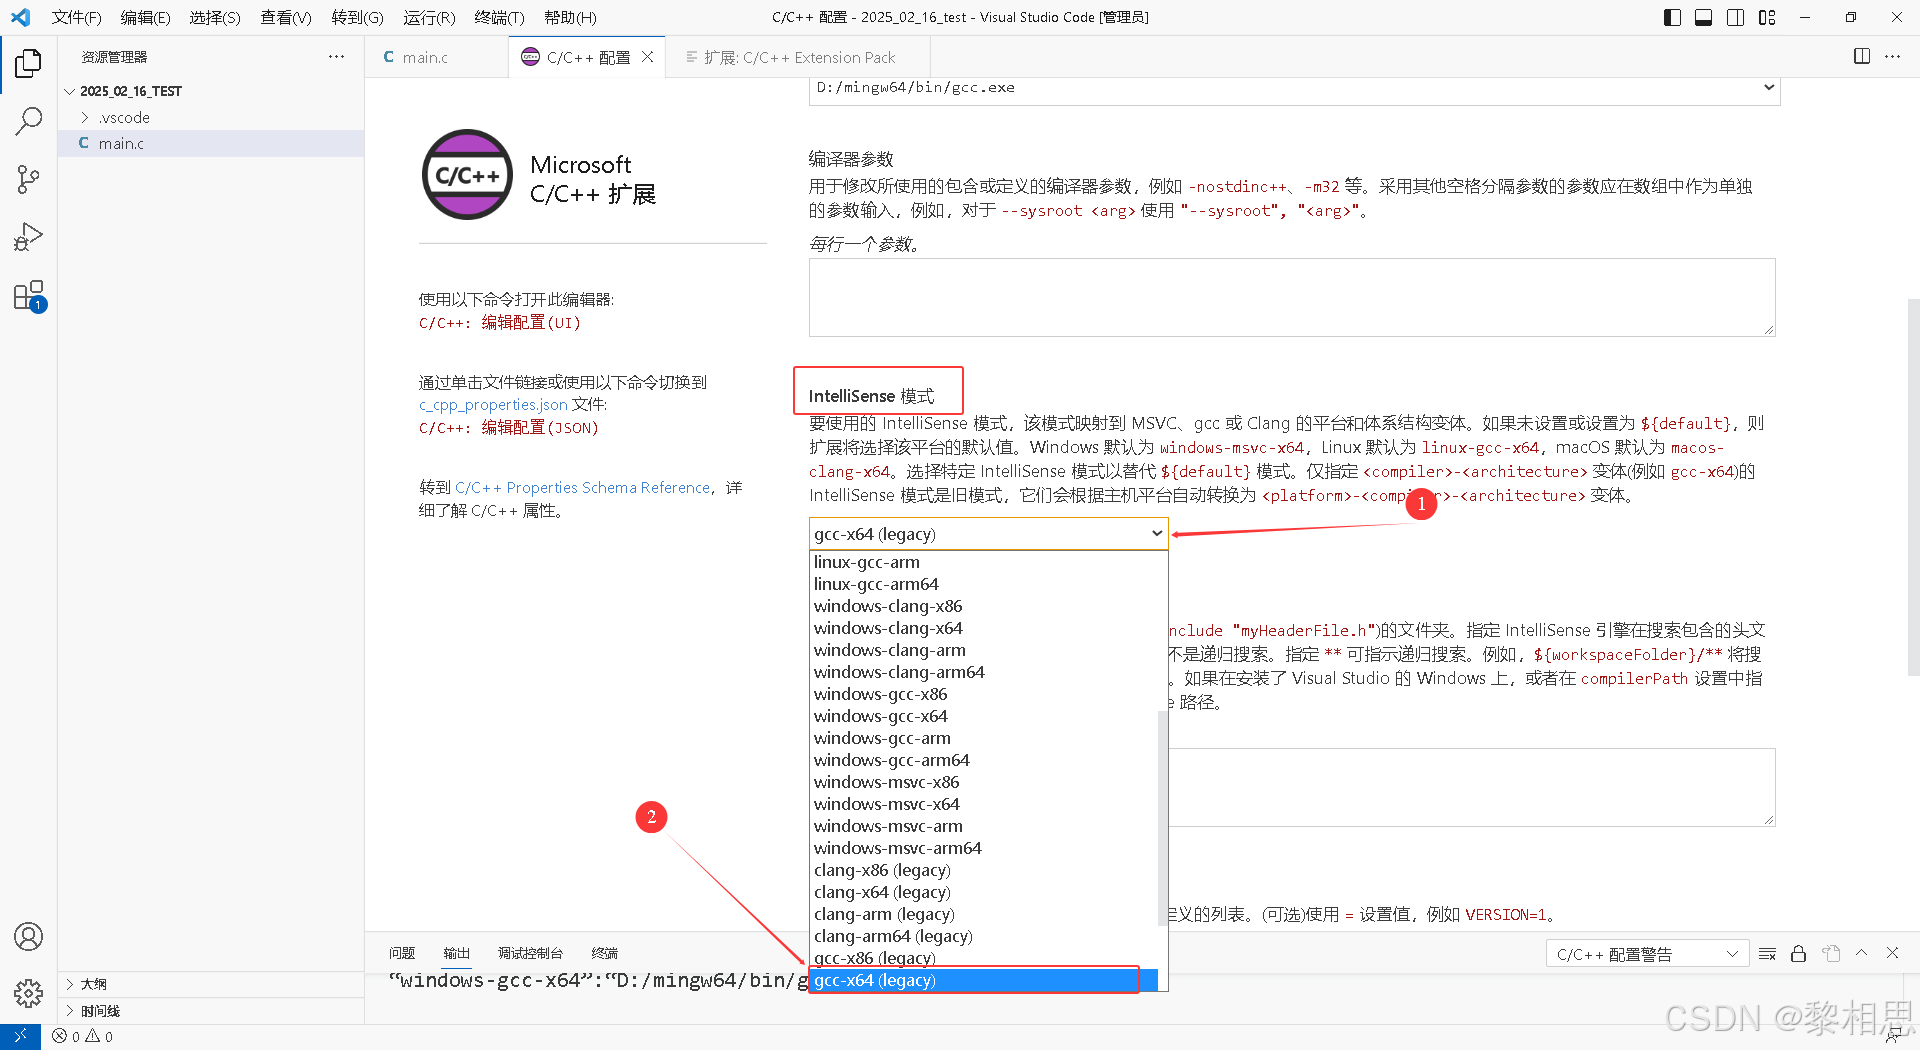
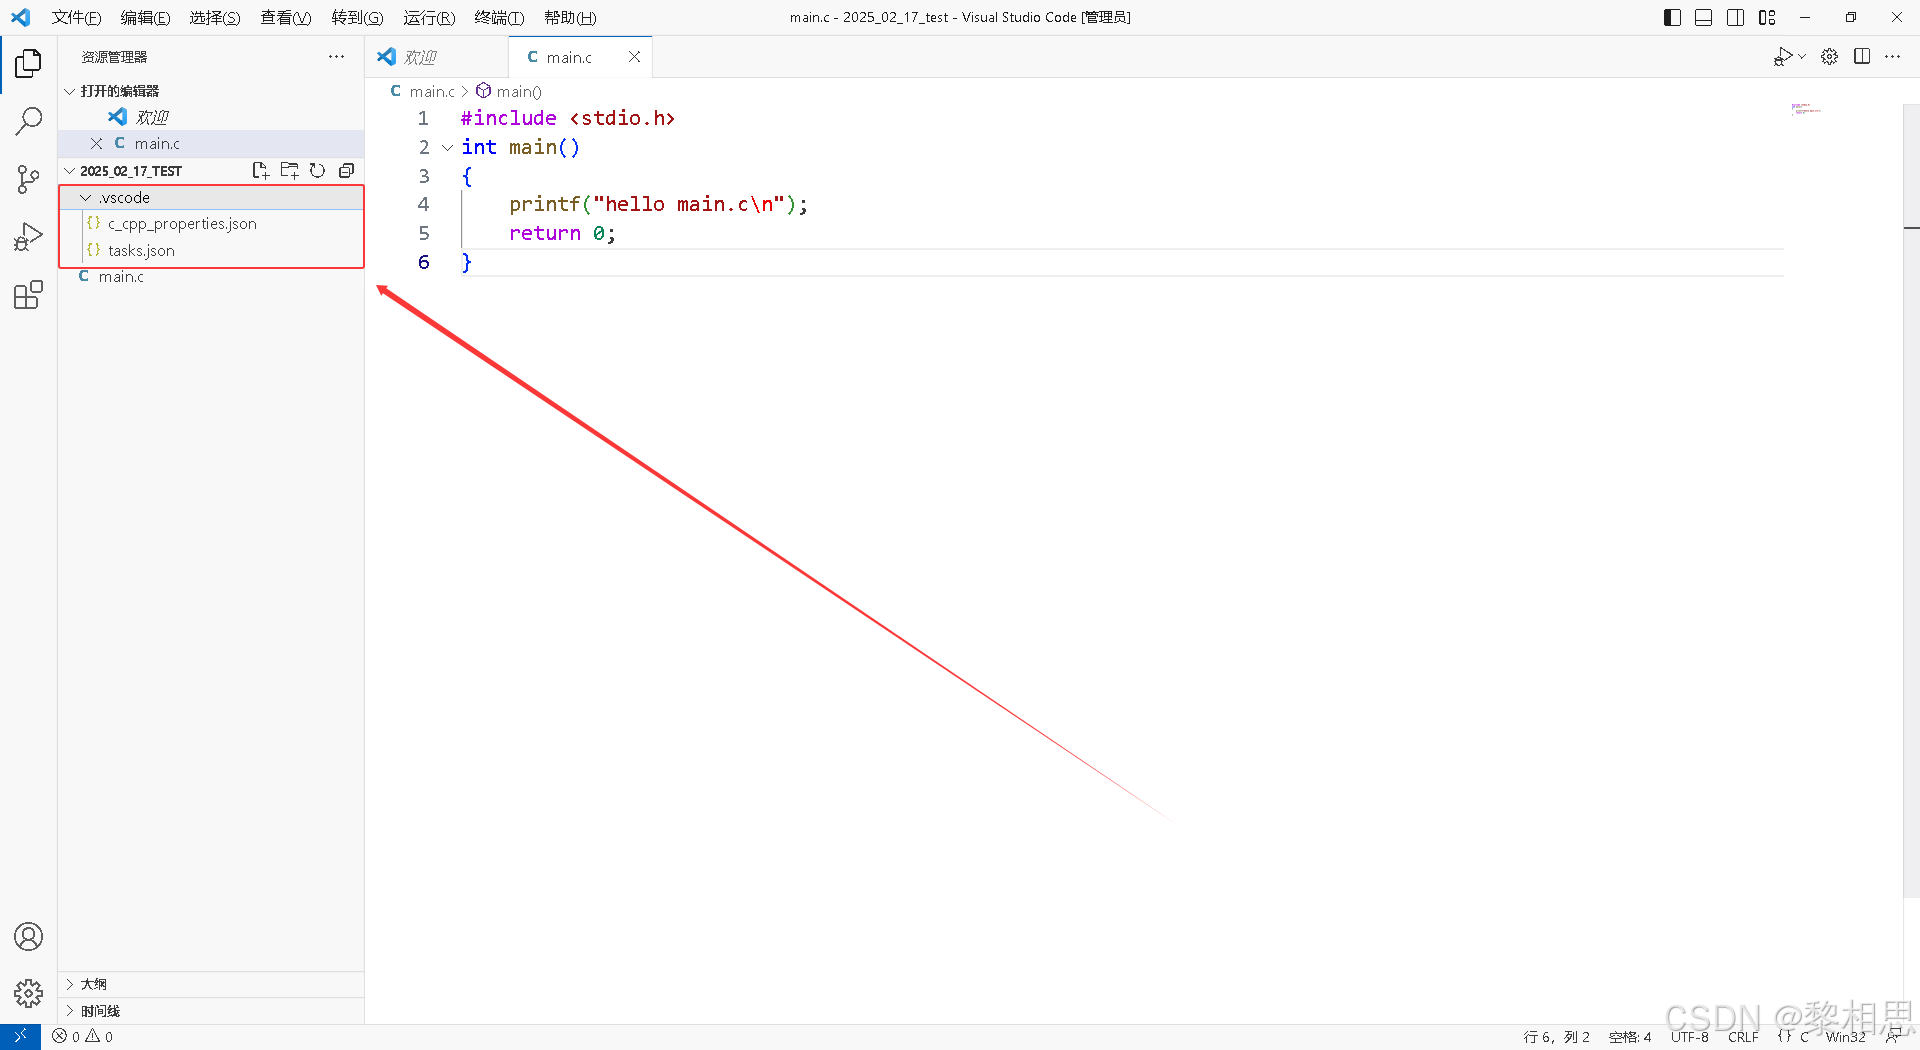
当我们配置好之后旁边会多出一个.vscode的文件。
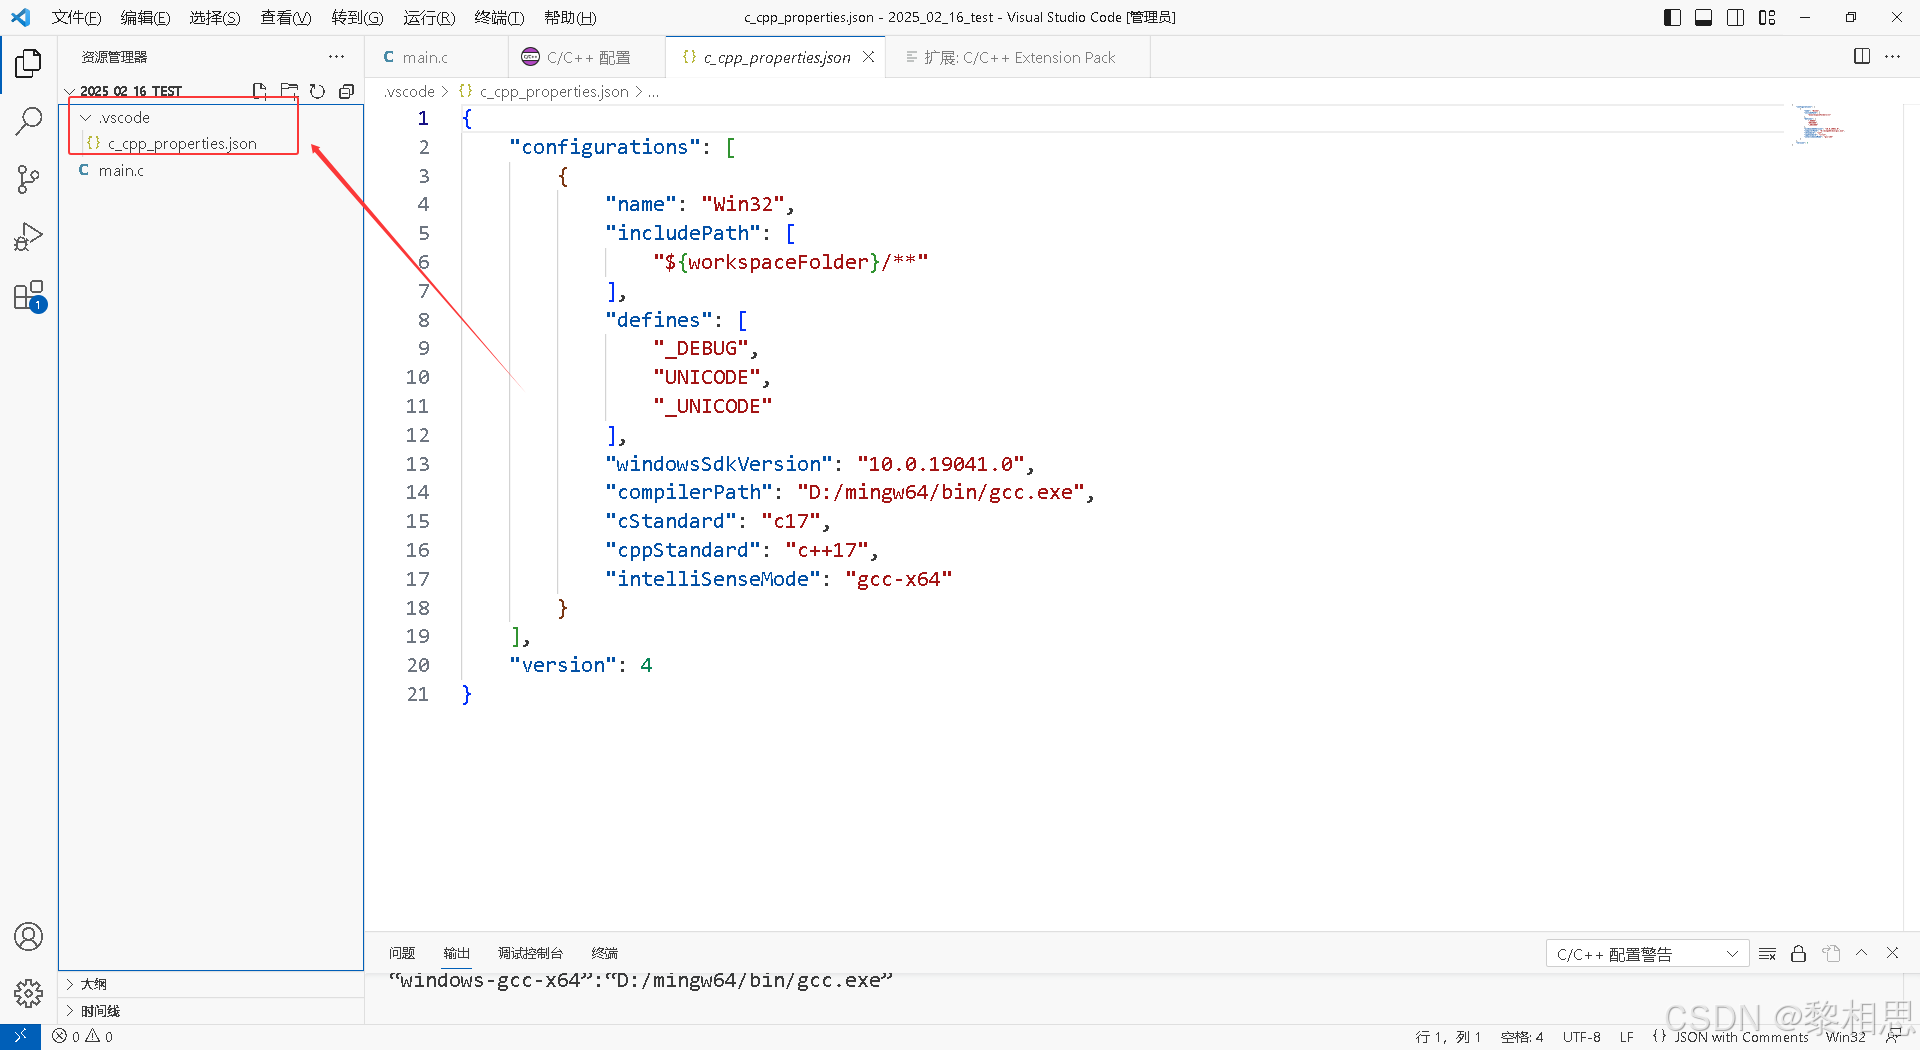
这个里面就指定了我们用的编译器是什么样的编译器,windows下的sdk是什么样的,以及C语言和C++编译的标准,代码提示的模式是什么。
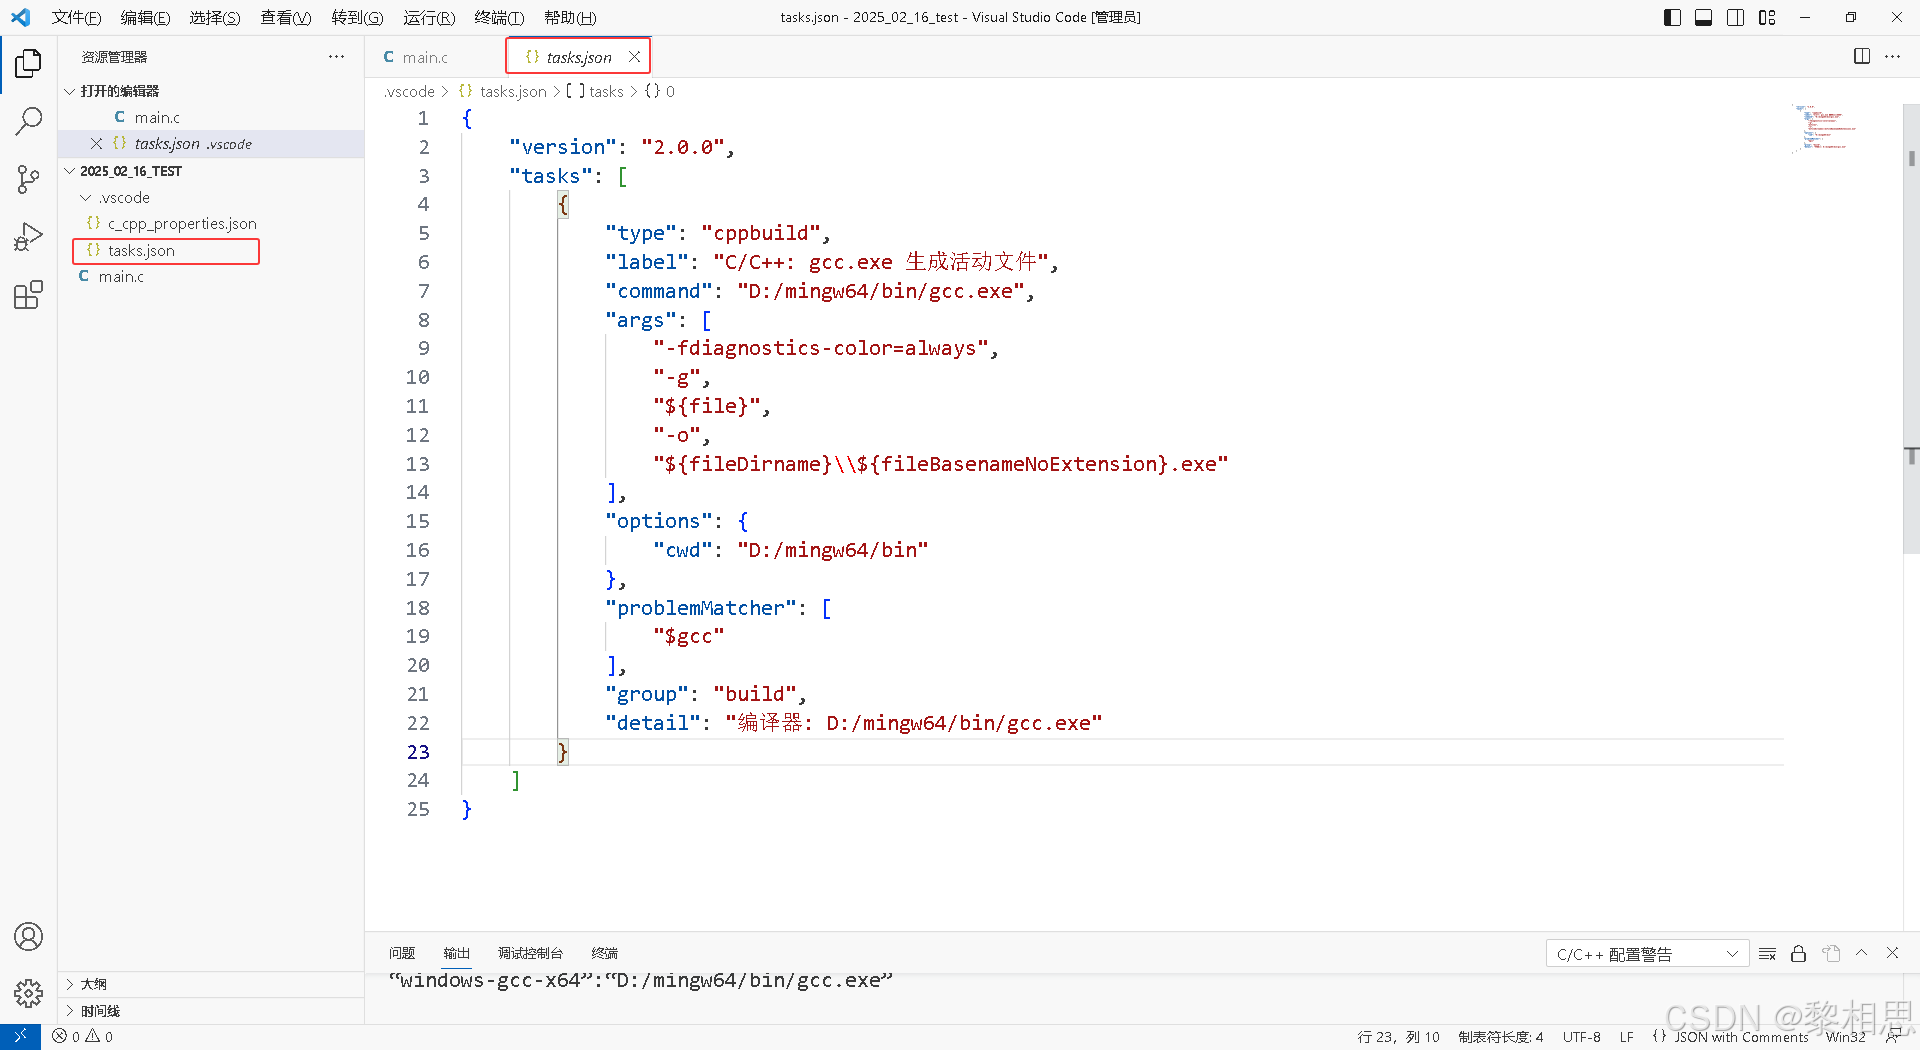
4.4 创建执行任务: tasks.json
要编译代码,我们接下来,在终端中:配置任务:
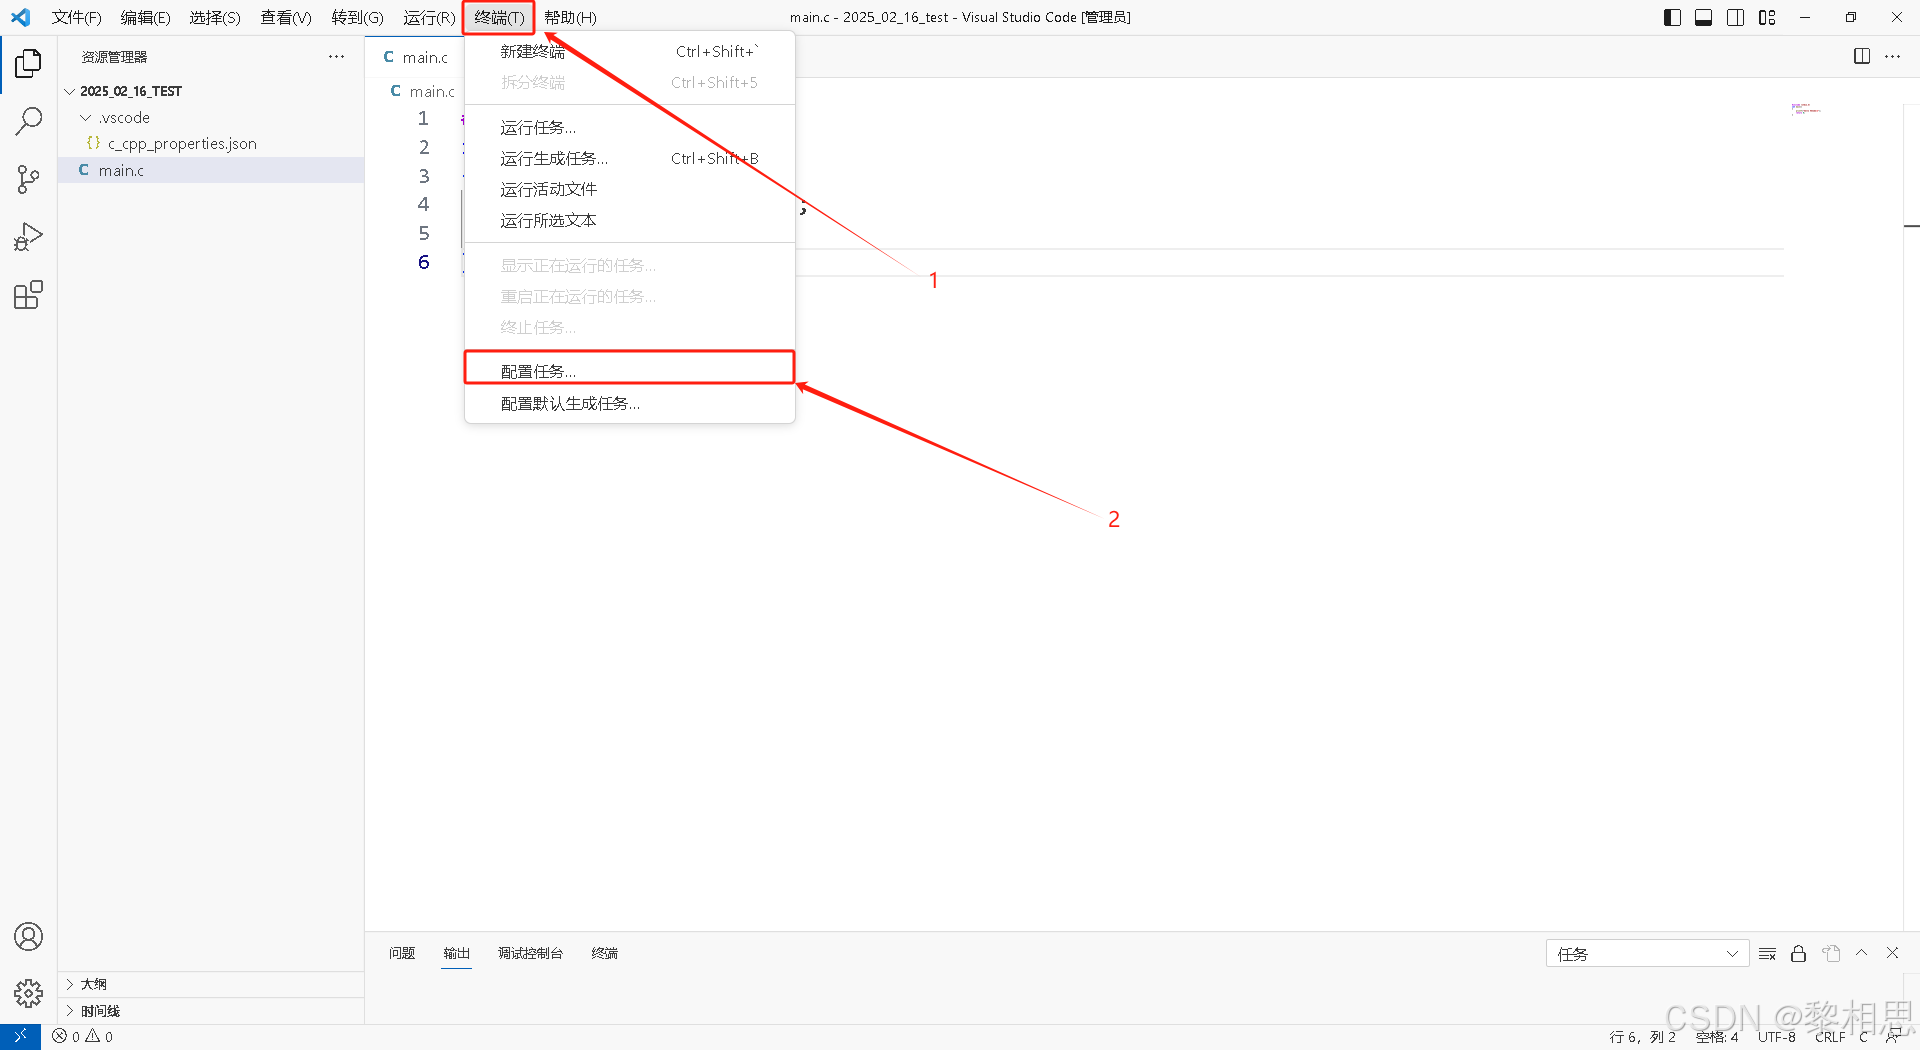
在弹出的页面中,选择【C/C++:gcc.exe 生成活动文件】
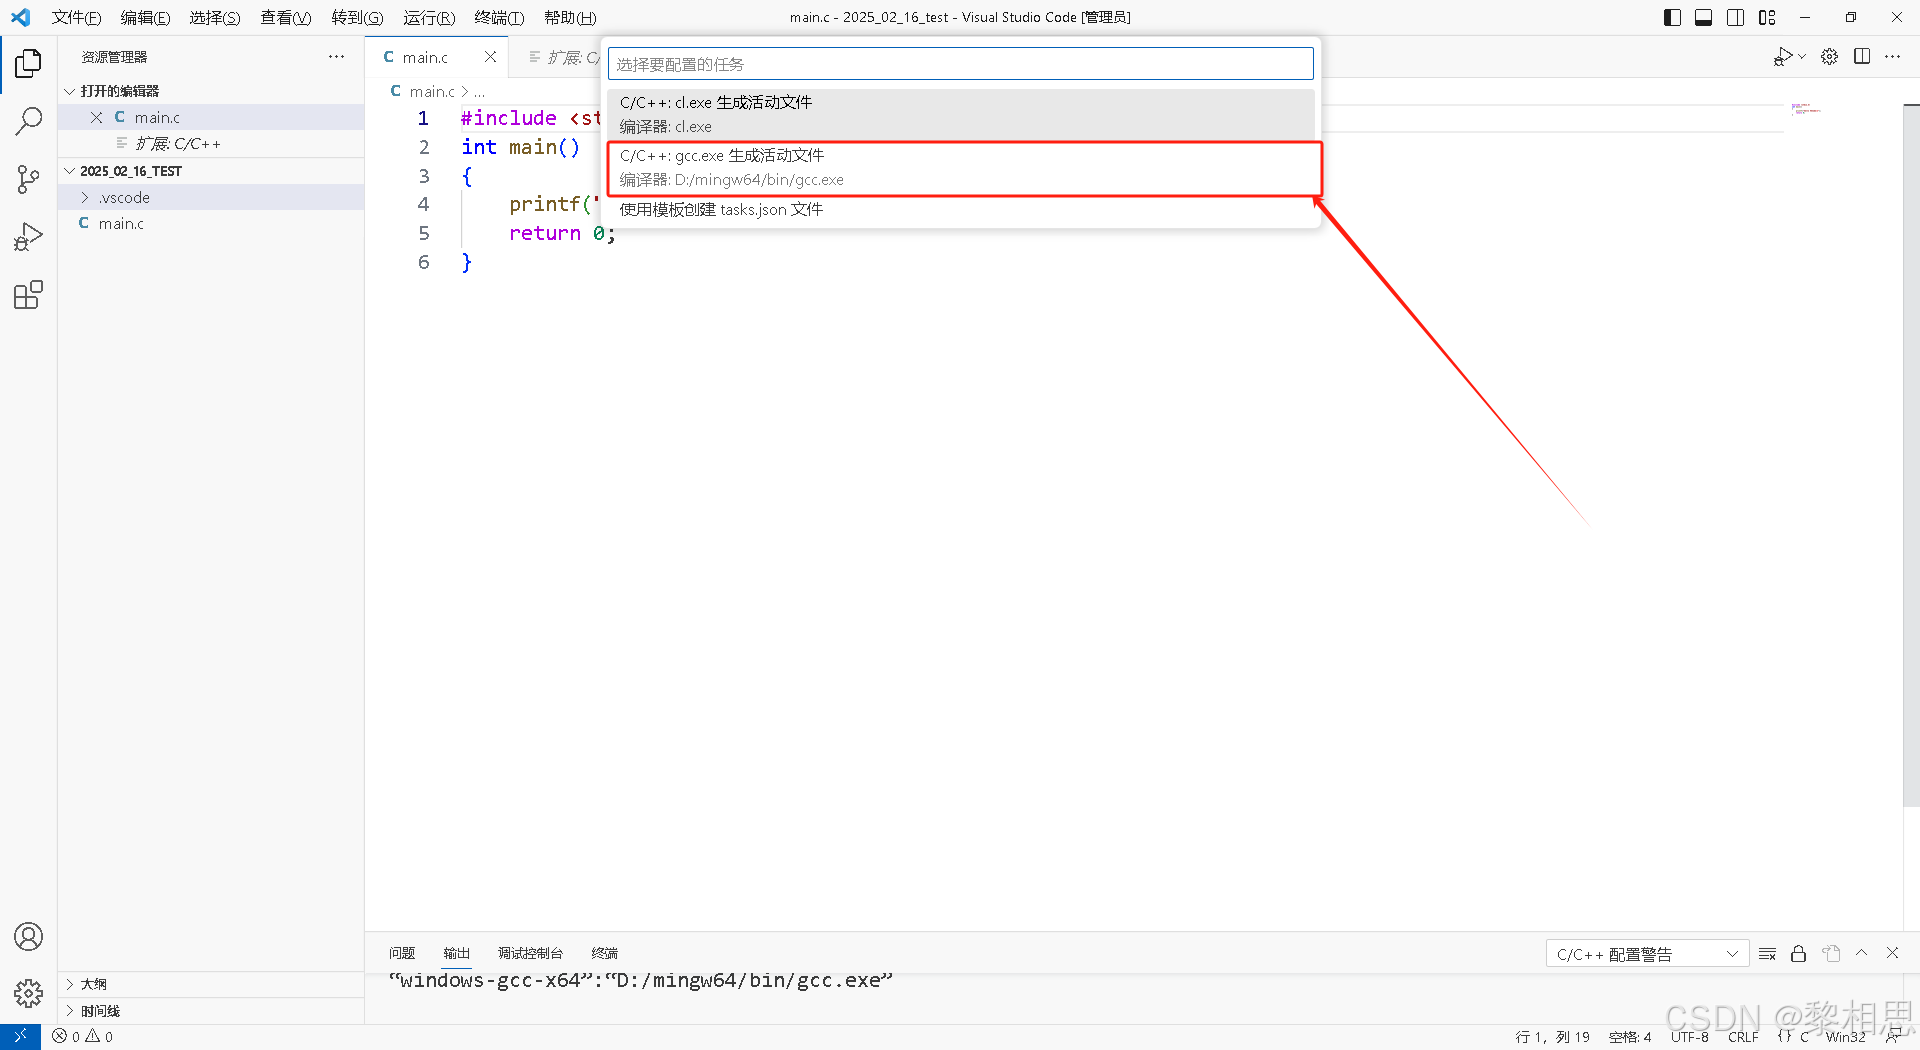
因为我这里还装了vs2019,所以有第一个,这里我们只需要选择第二个即可。
这时就生成了一个tasks.json文件,这个文件是专门是用来执行代码的编译任务的。
4.5 编译+执行
4.5.1 编译
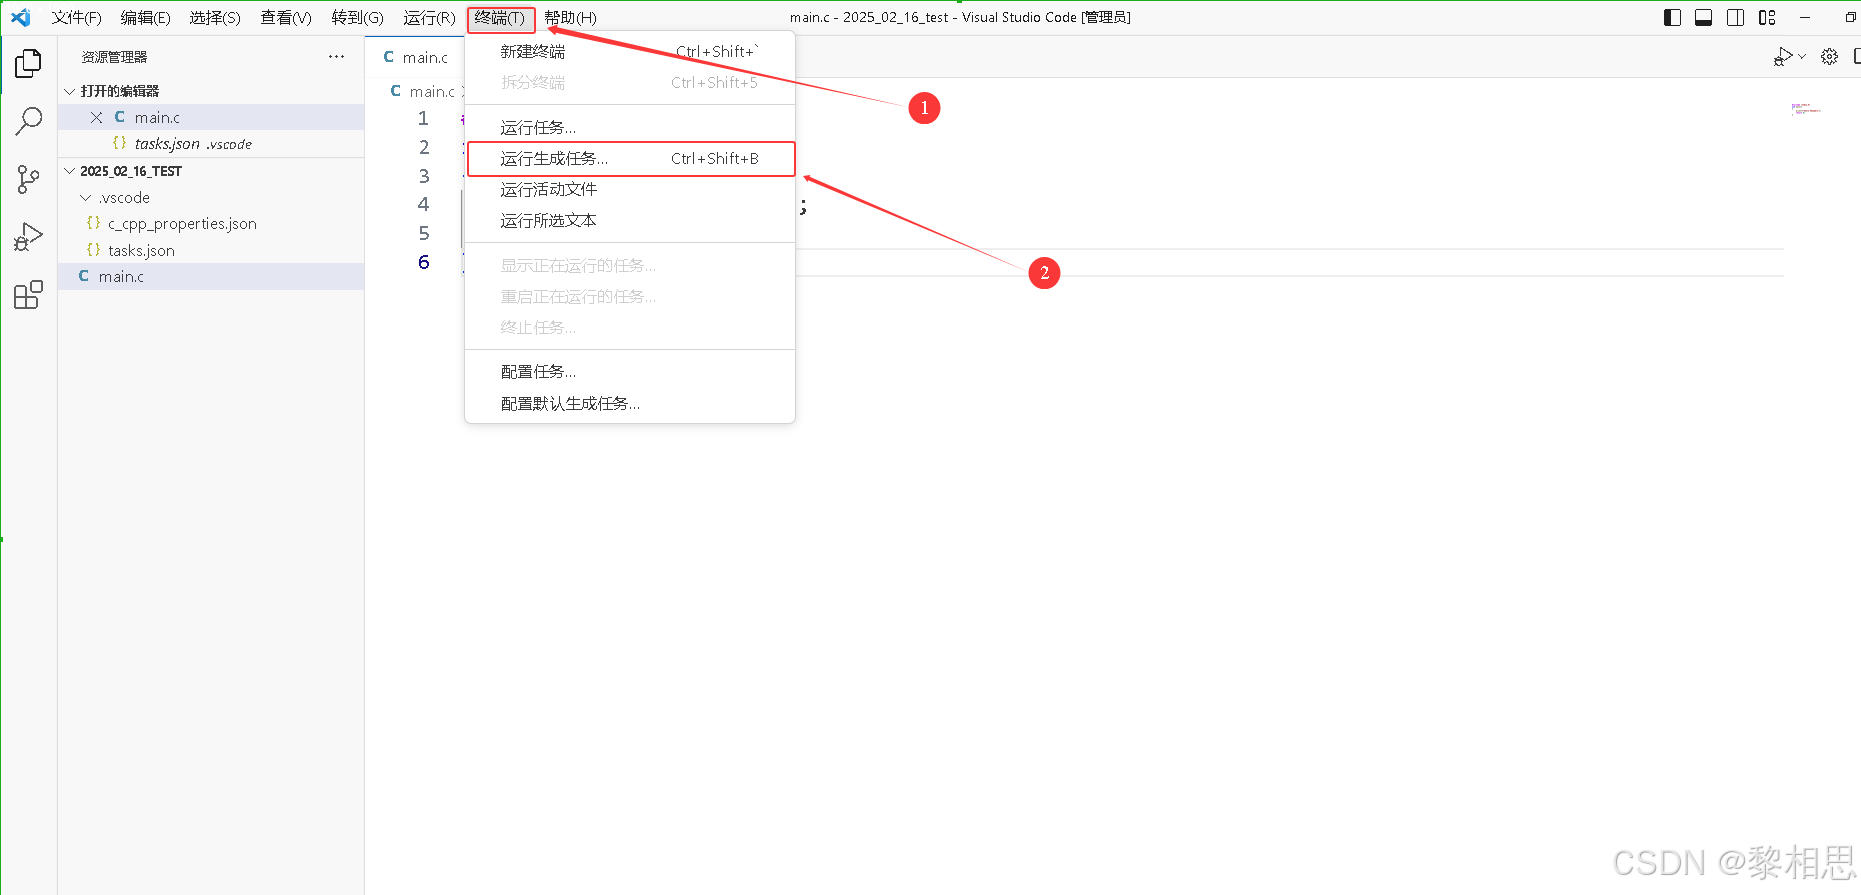
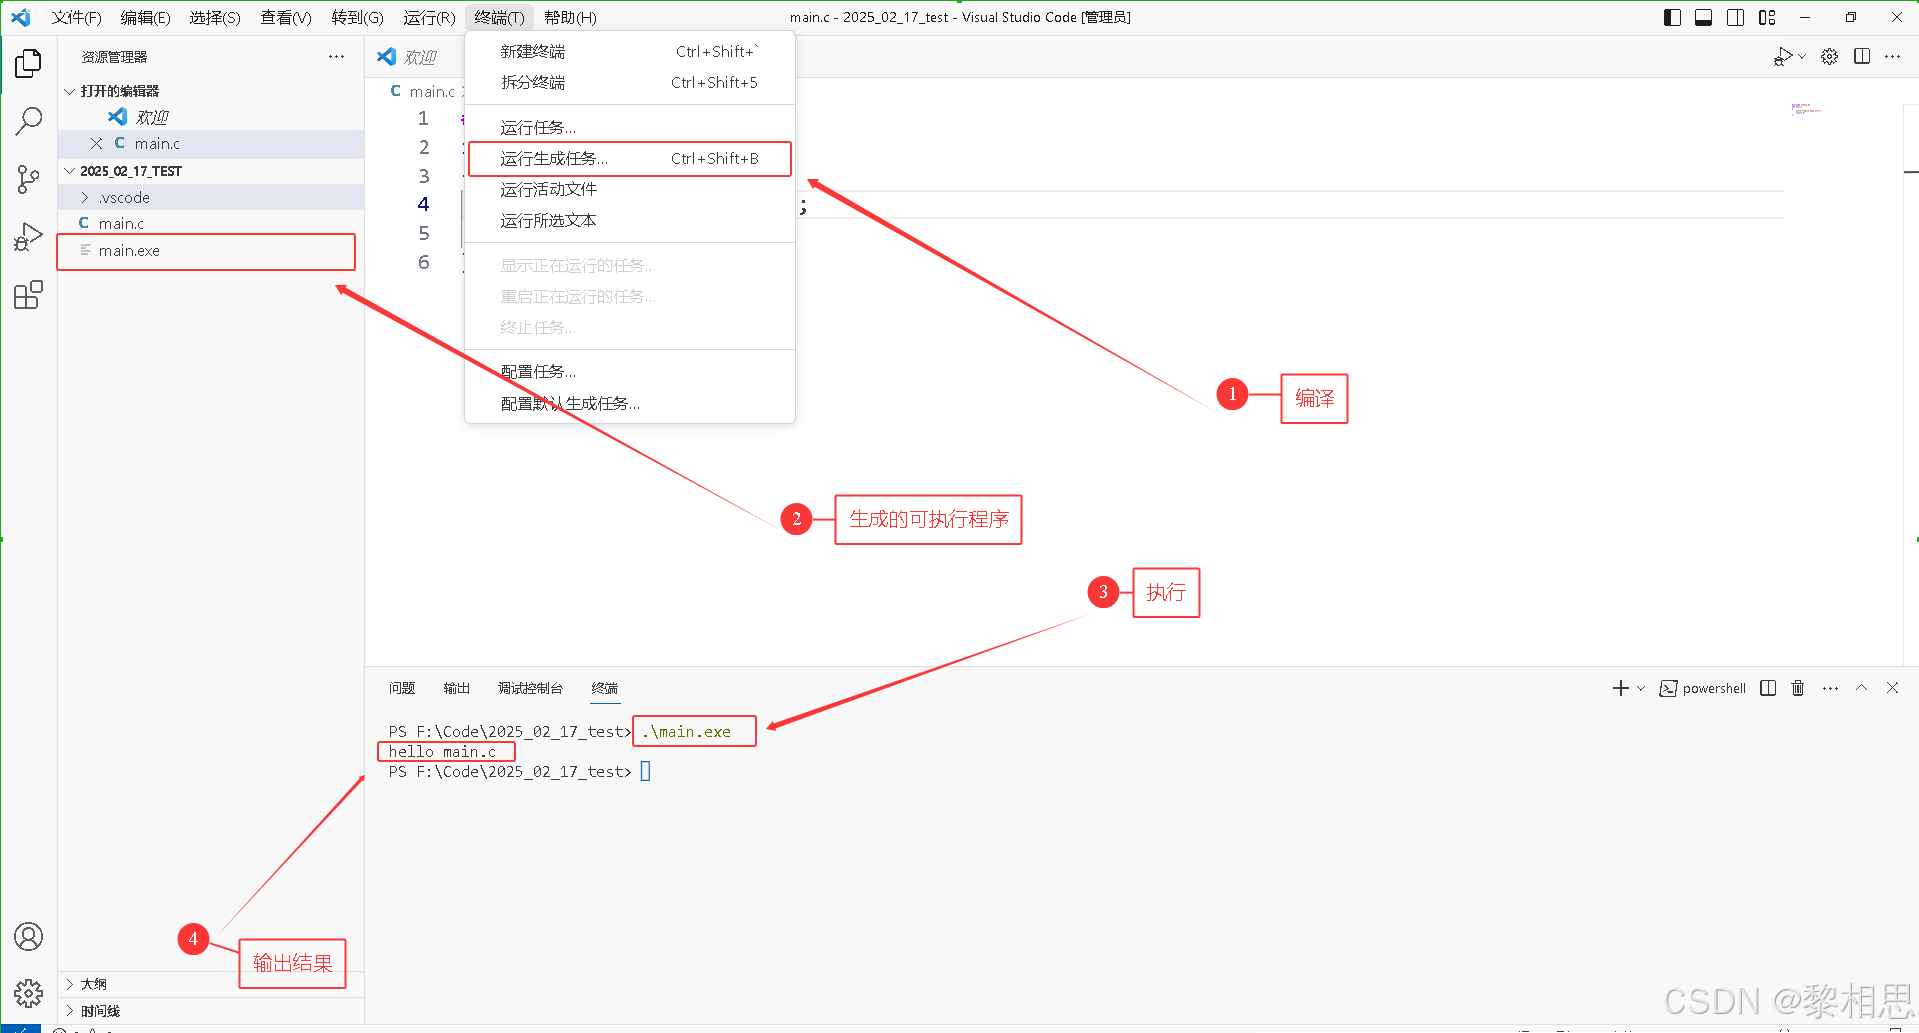
完成上述的步骤,我们就准备好了所有的准备,接下来就可以编译并生成可执行程序了。
具体操作如下:
- 鼠标点在要编译的C语言代码中
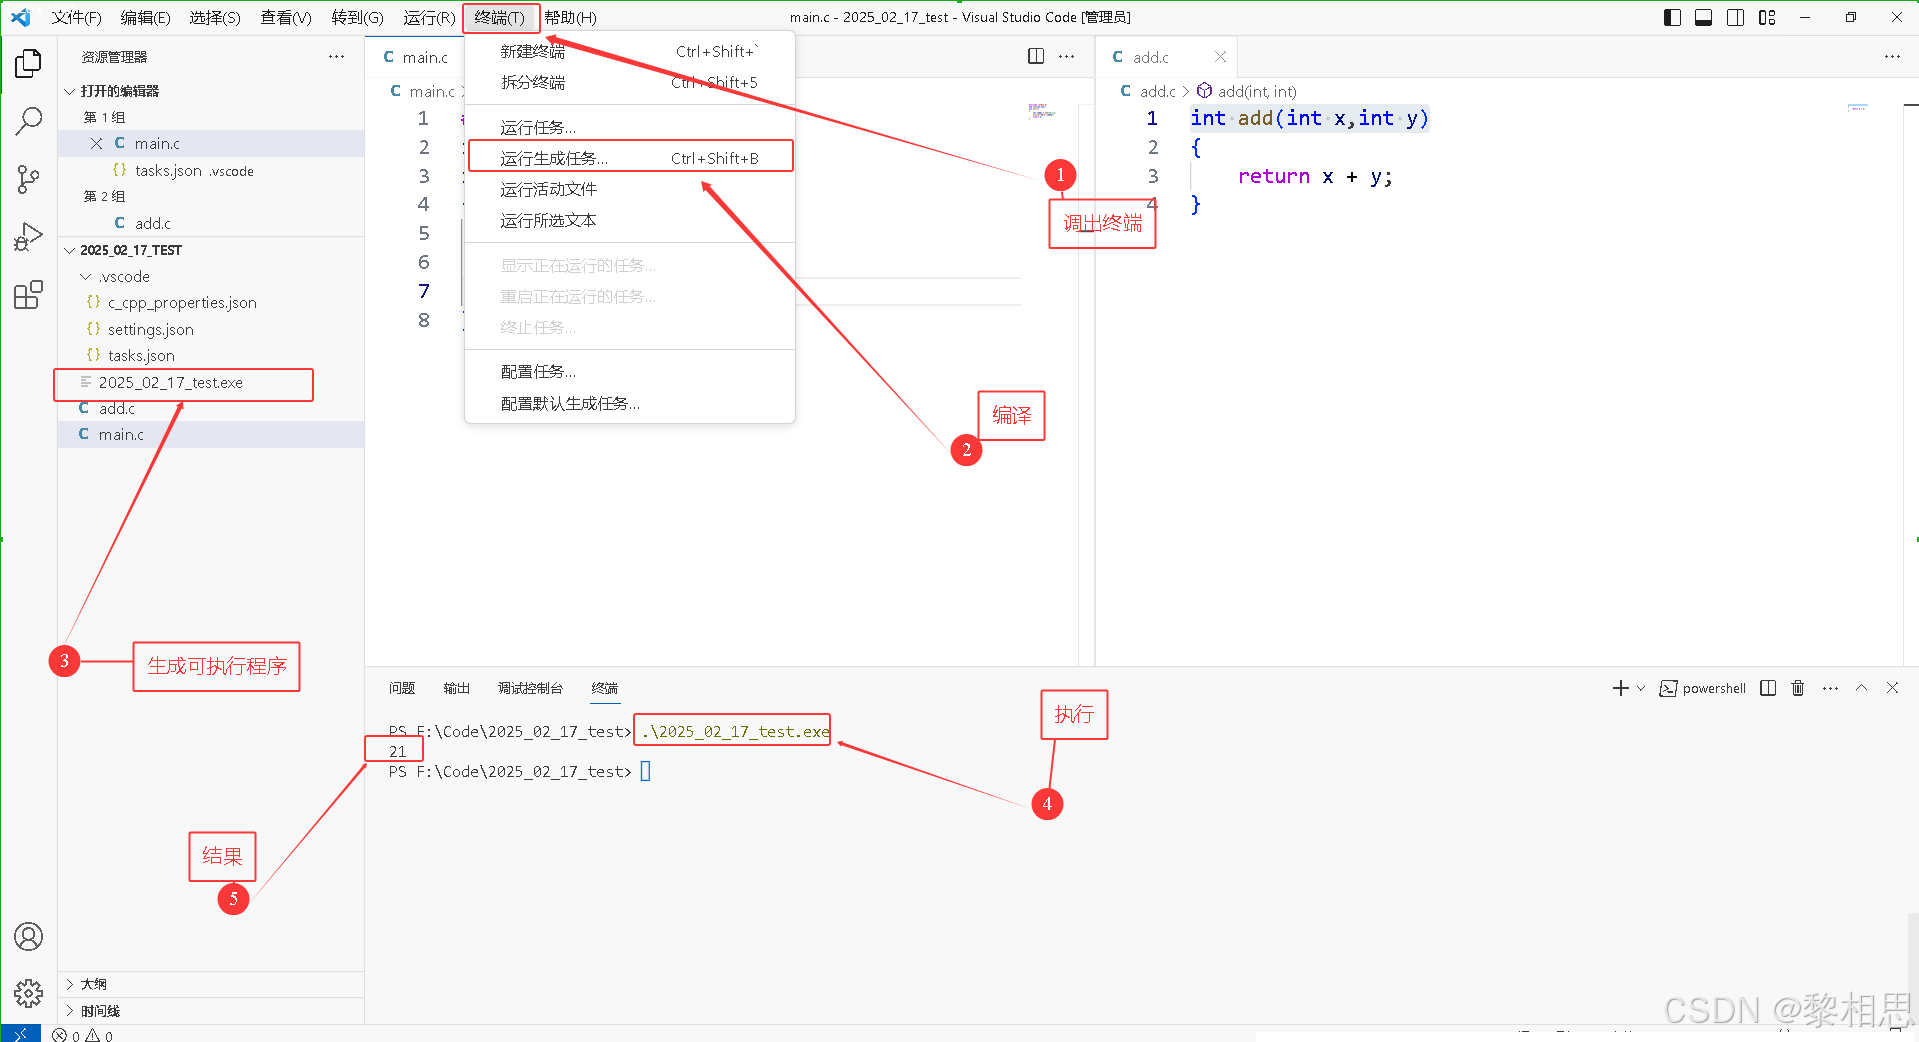
- 然后执行【终端】-> 【运行生成任务】
如果一切正常的话,我们就能看到【终端】提示,就说明编译成功了。
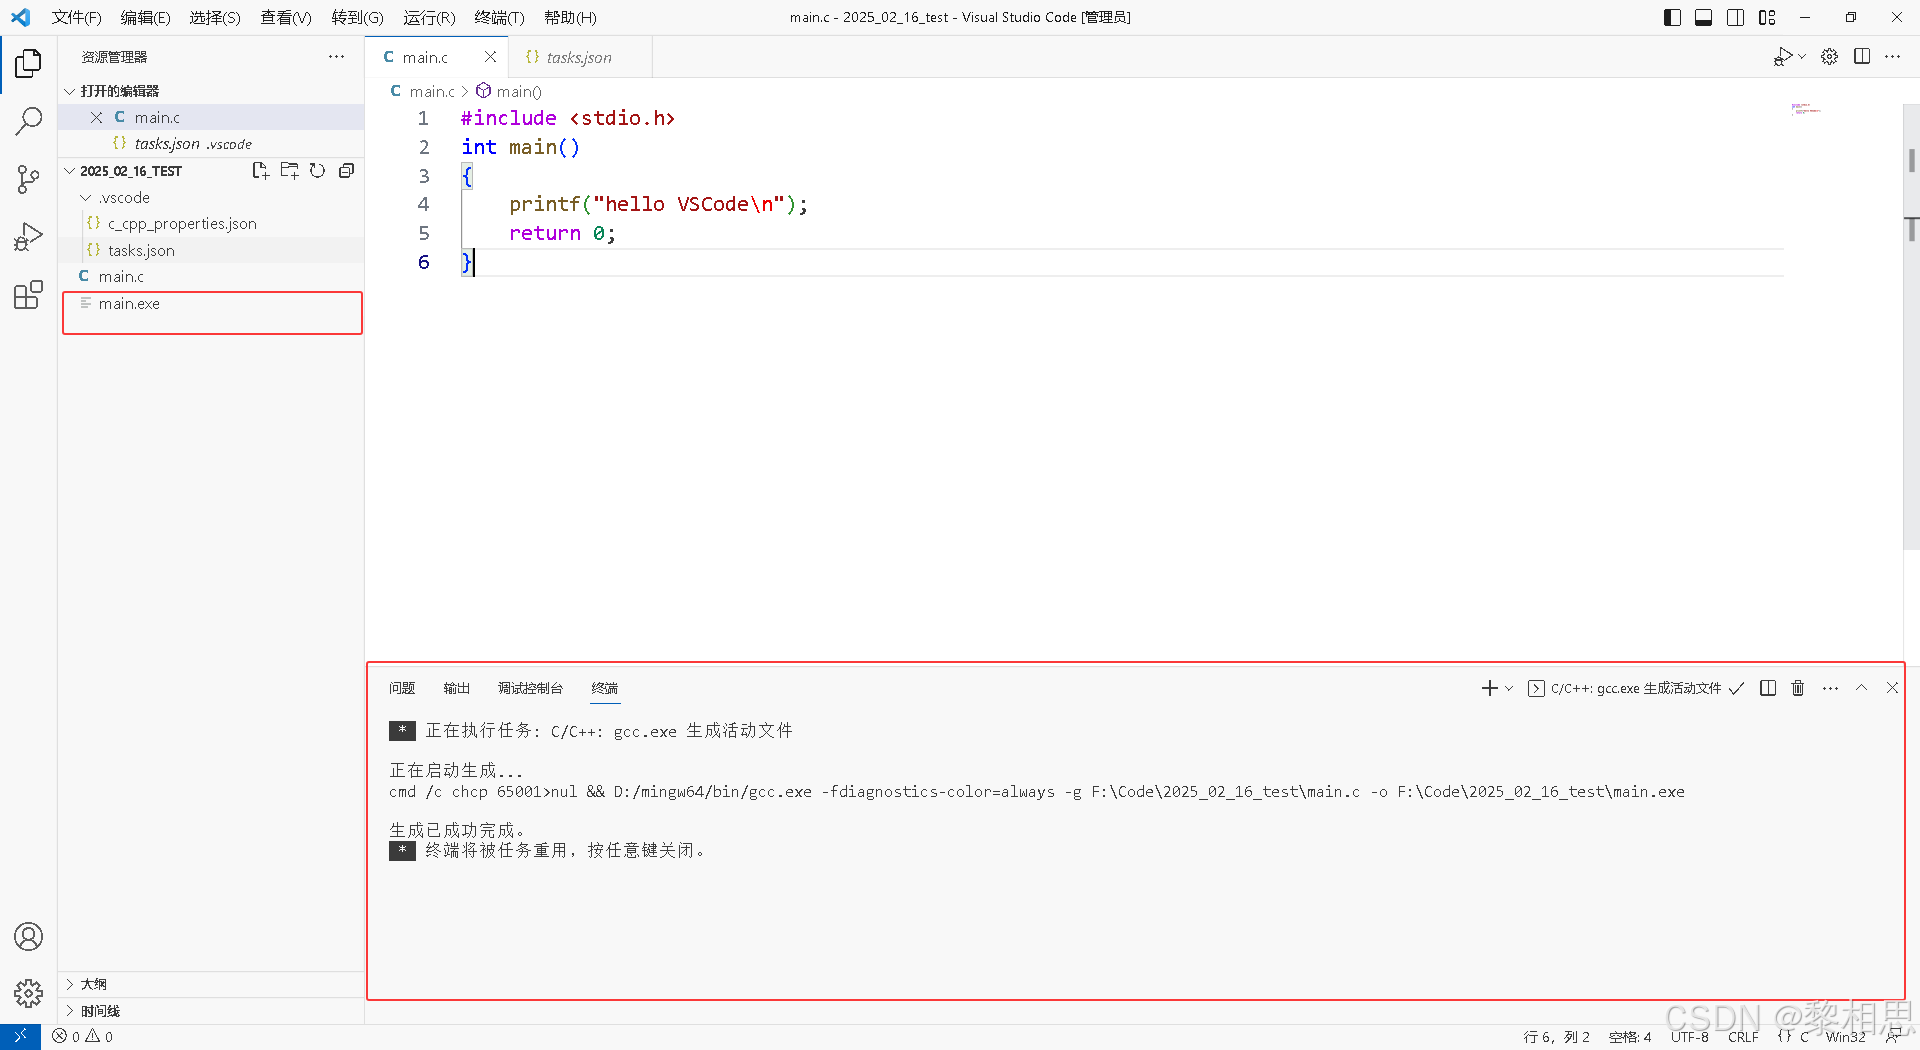
然后这个时候旁边也就生成了可执行程序.exe文件了。
4.5.2 执行
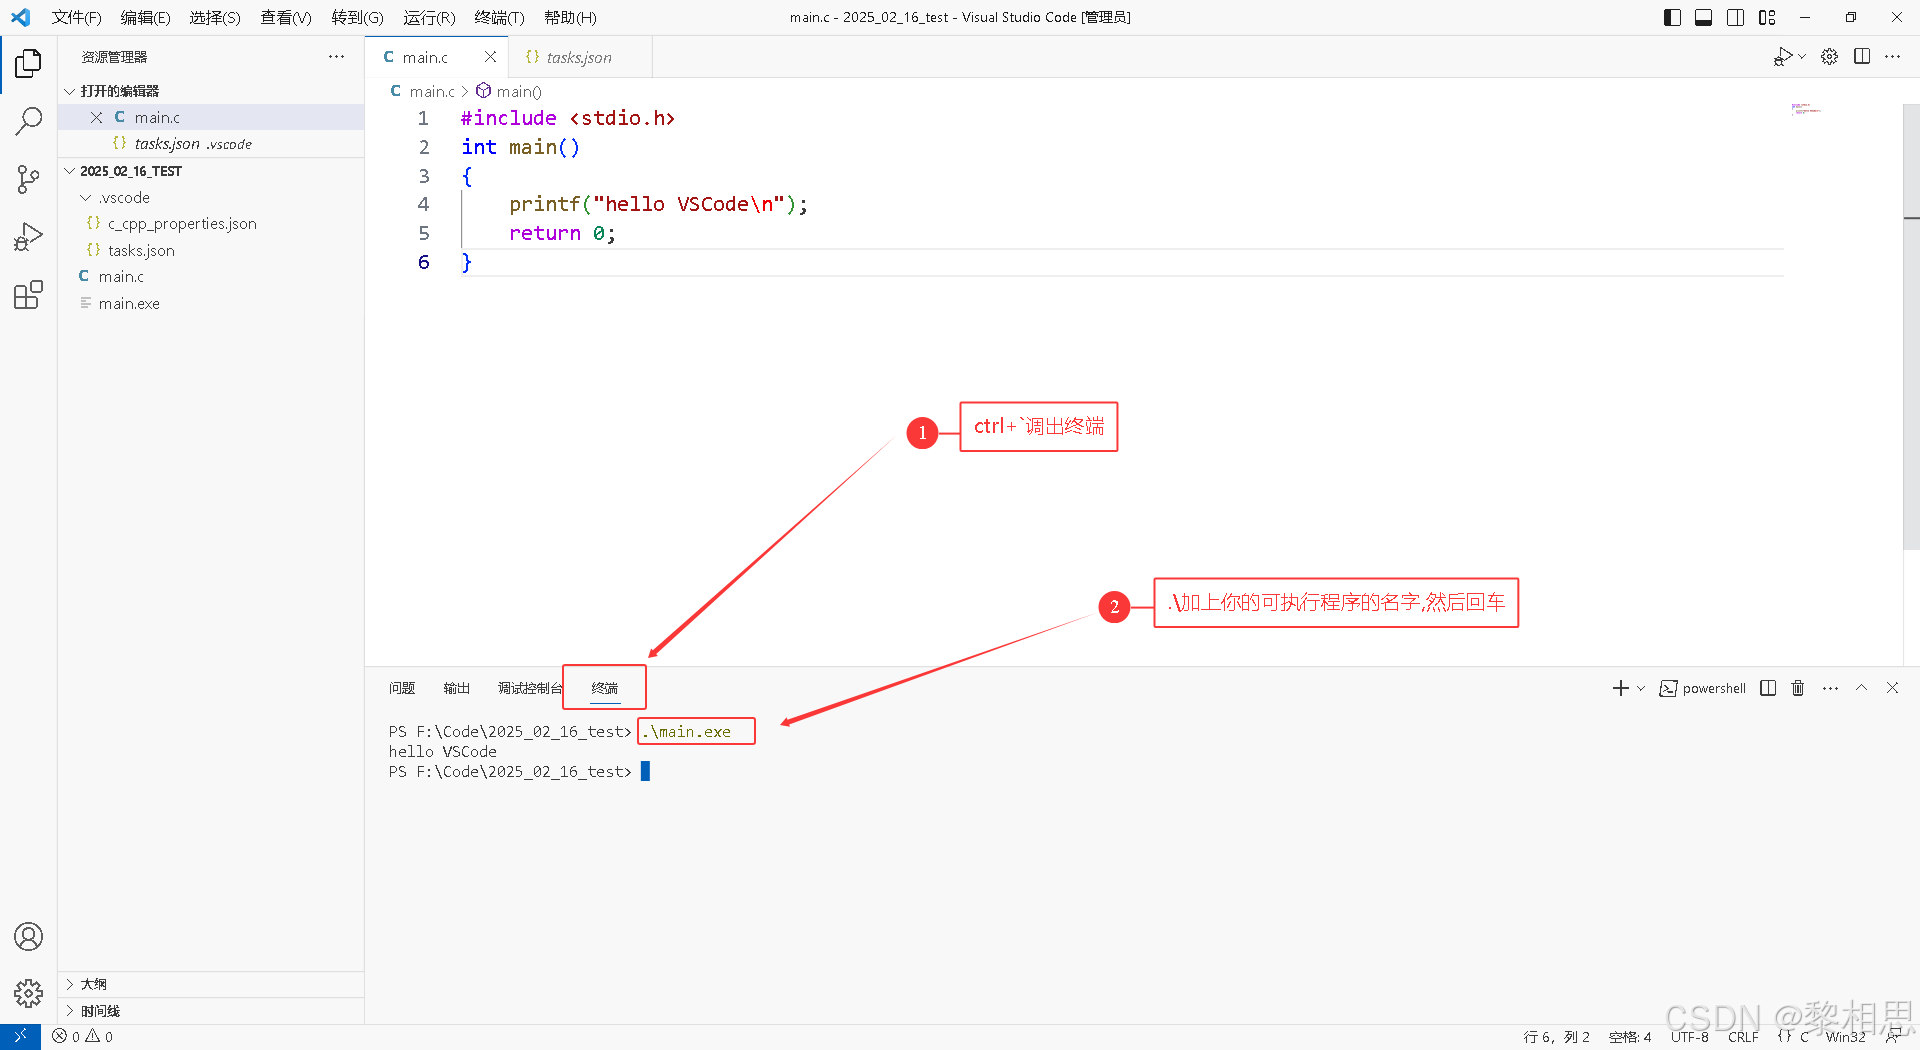
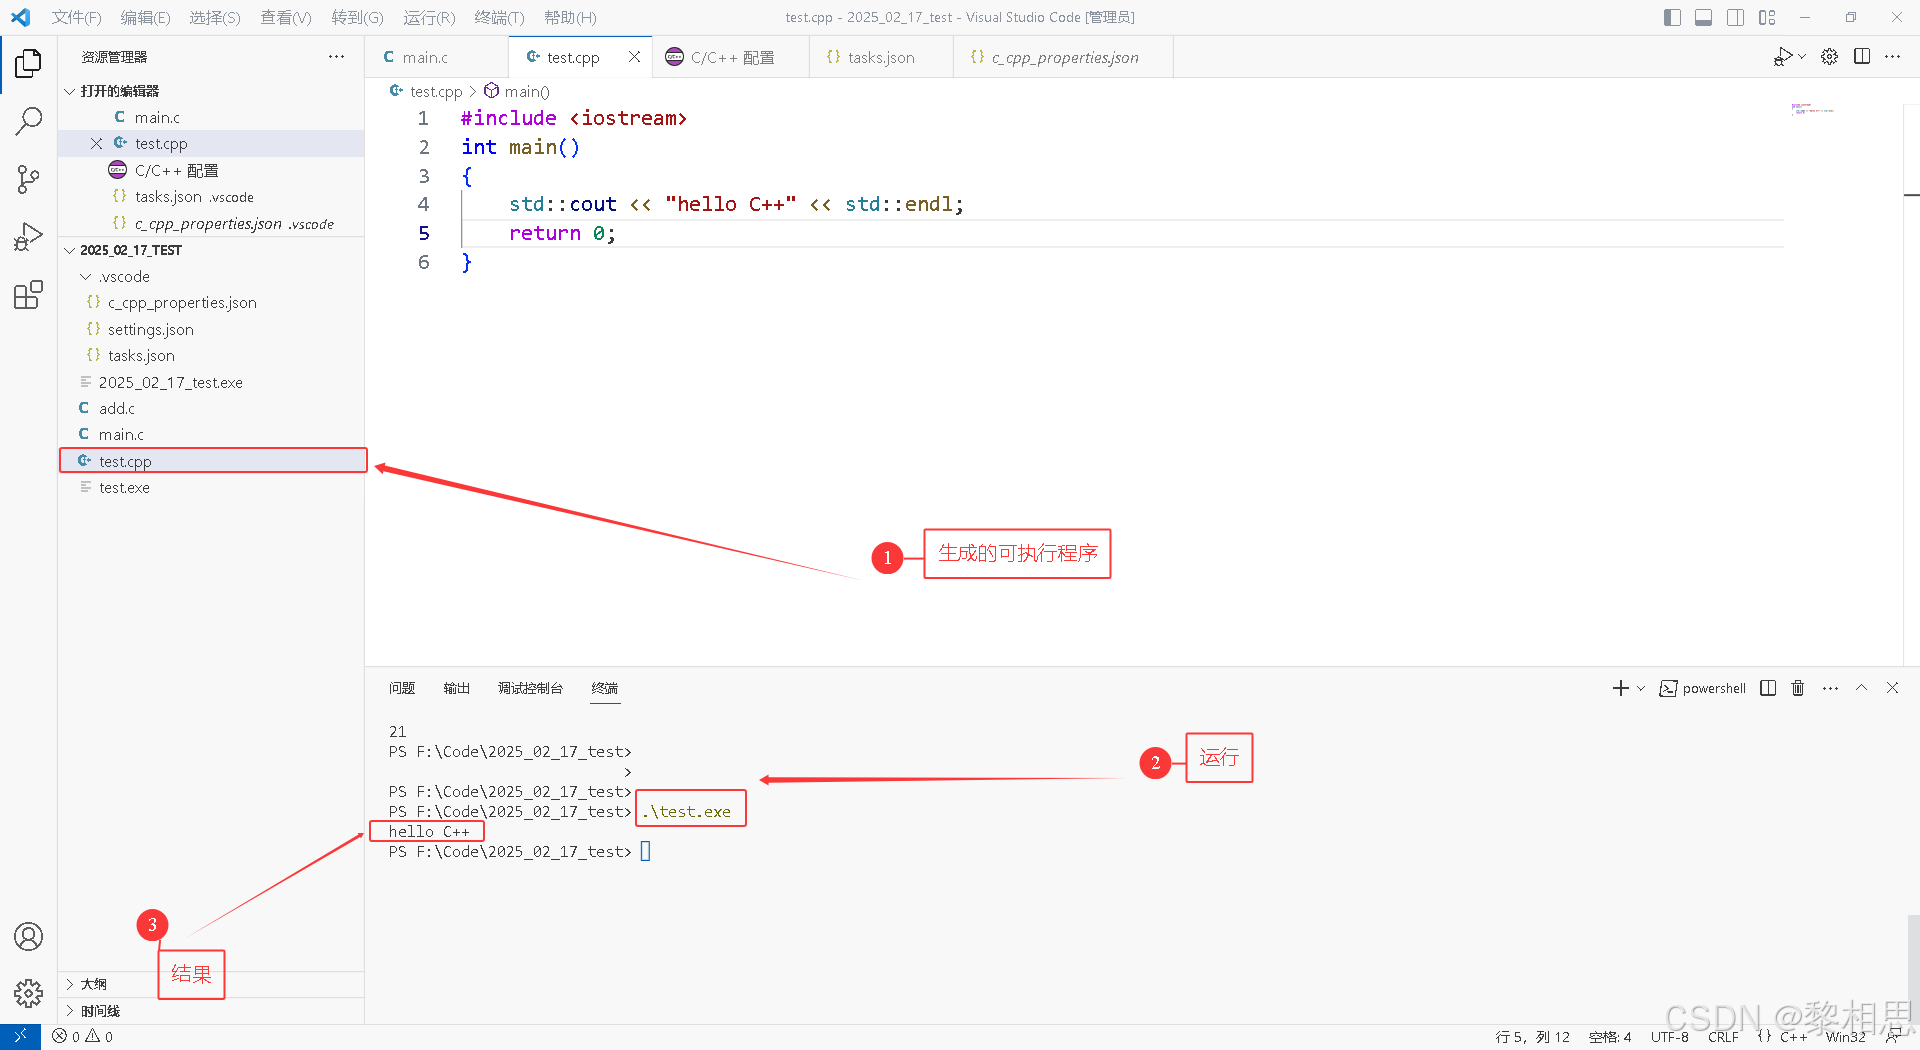
按键盘的ctrl+`快捷键,打开VSCode自带的终端,就可以运行代码了。
这是输入:.\可执行程序的名字,即可以执行代码。
4.6 再写一个代码怎么办?
4.6.1 方法一
4.6.1.1 新建文件
如果你的代码还是单独的一个c文件,在当前打开文件夹就可以编写,那直接在当前打开的文件夹中新建.c源文件,编写代码,对当前的代码执行和上面一样的操作。
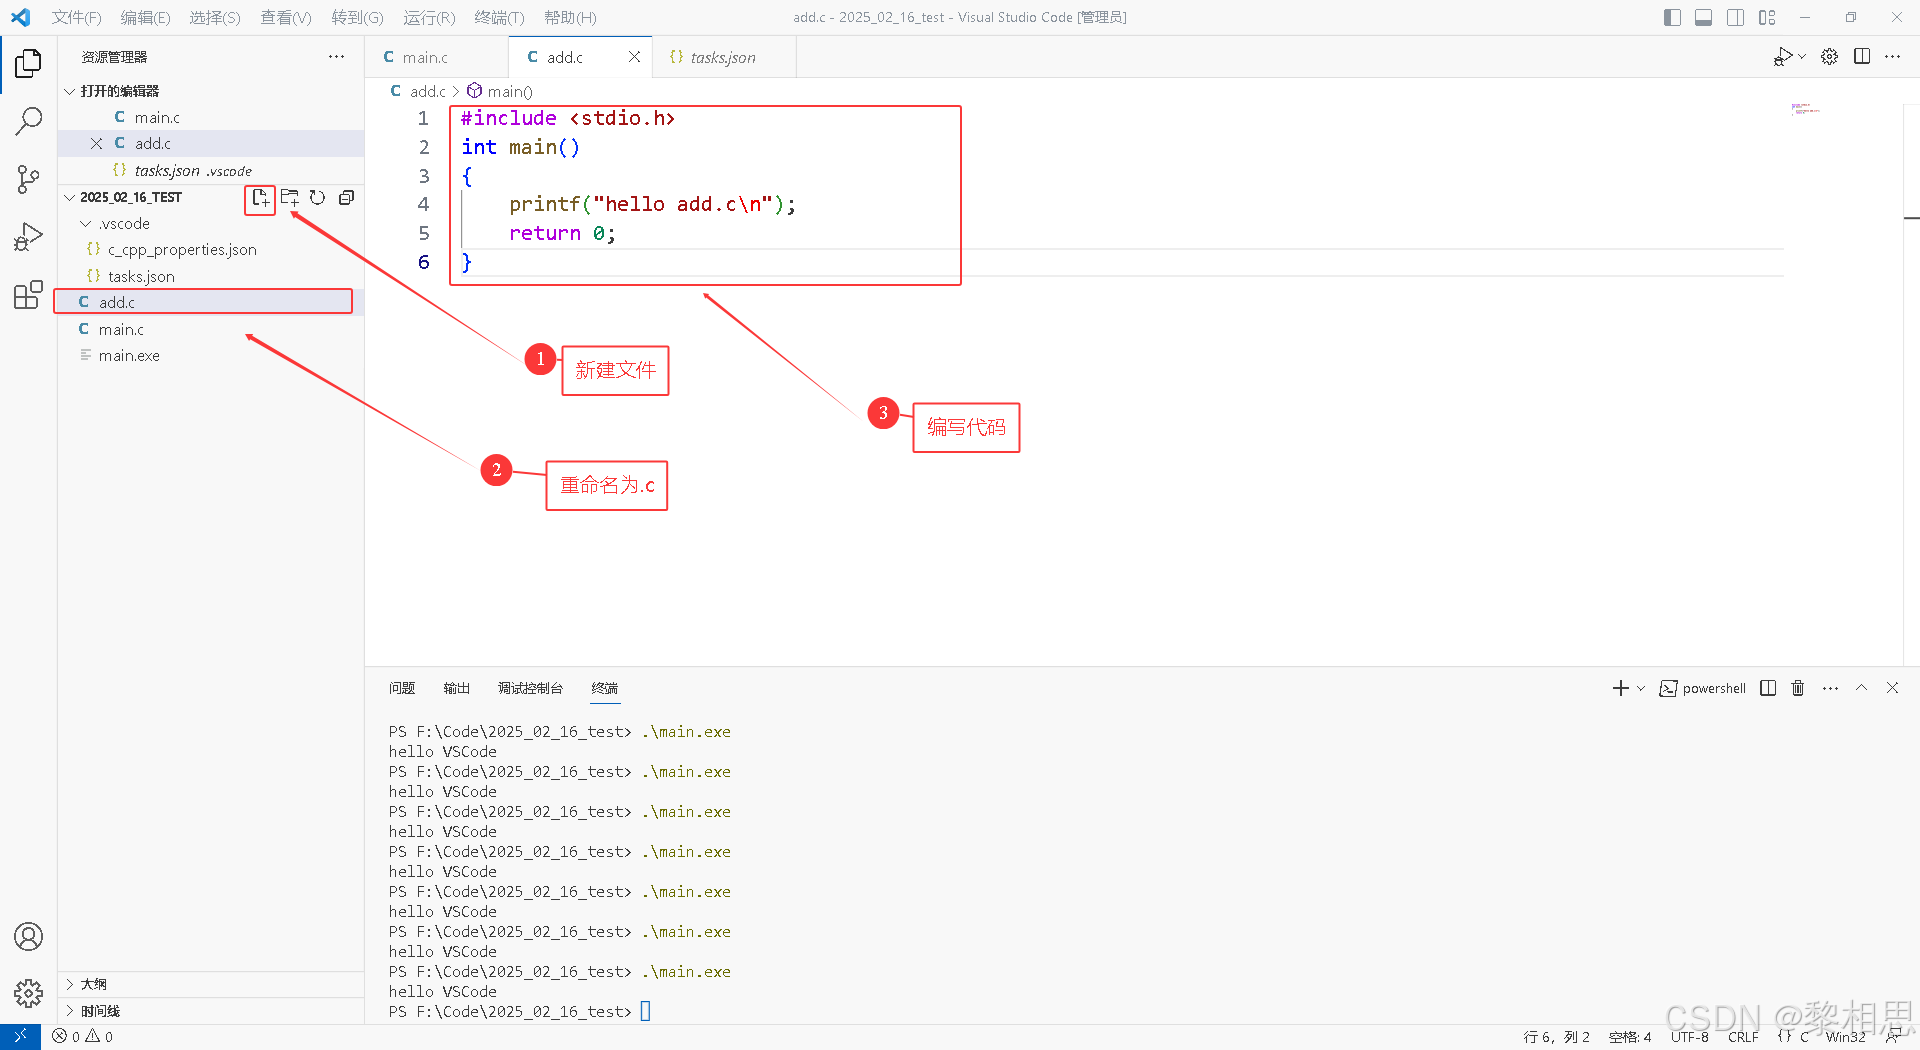
4.6.1.2 执行
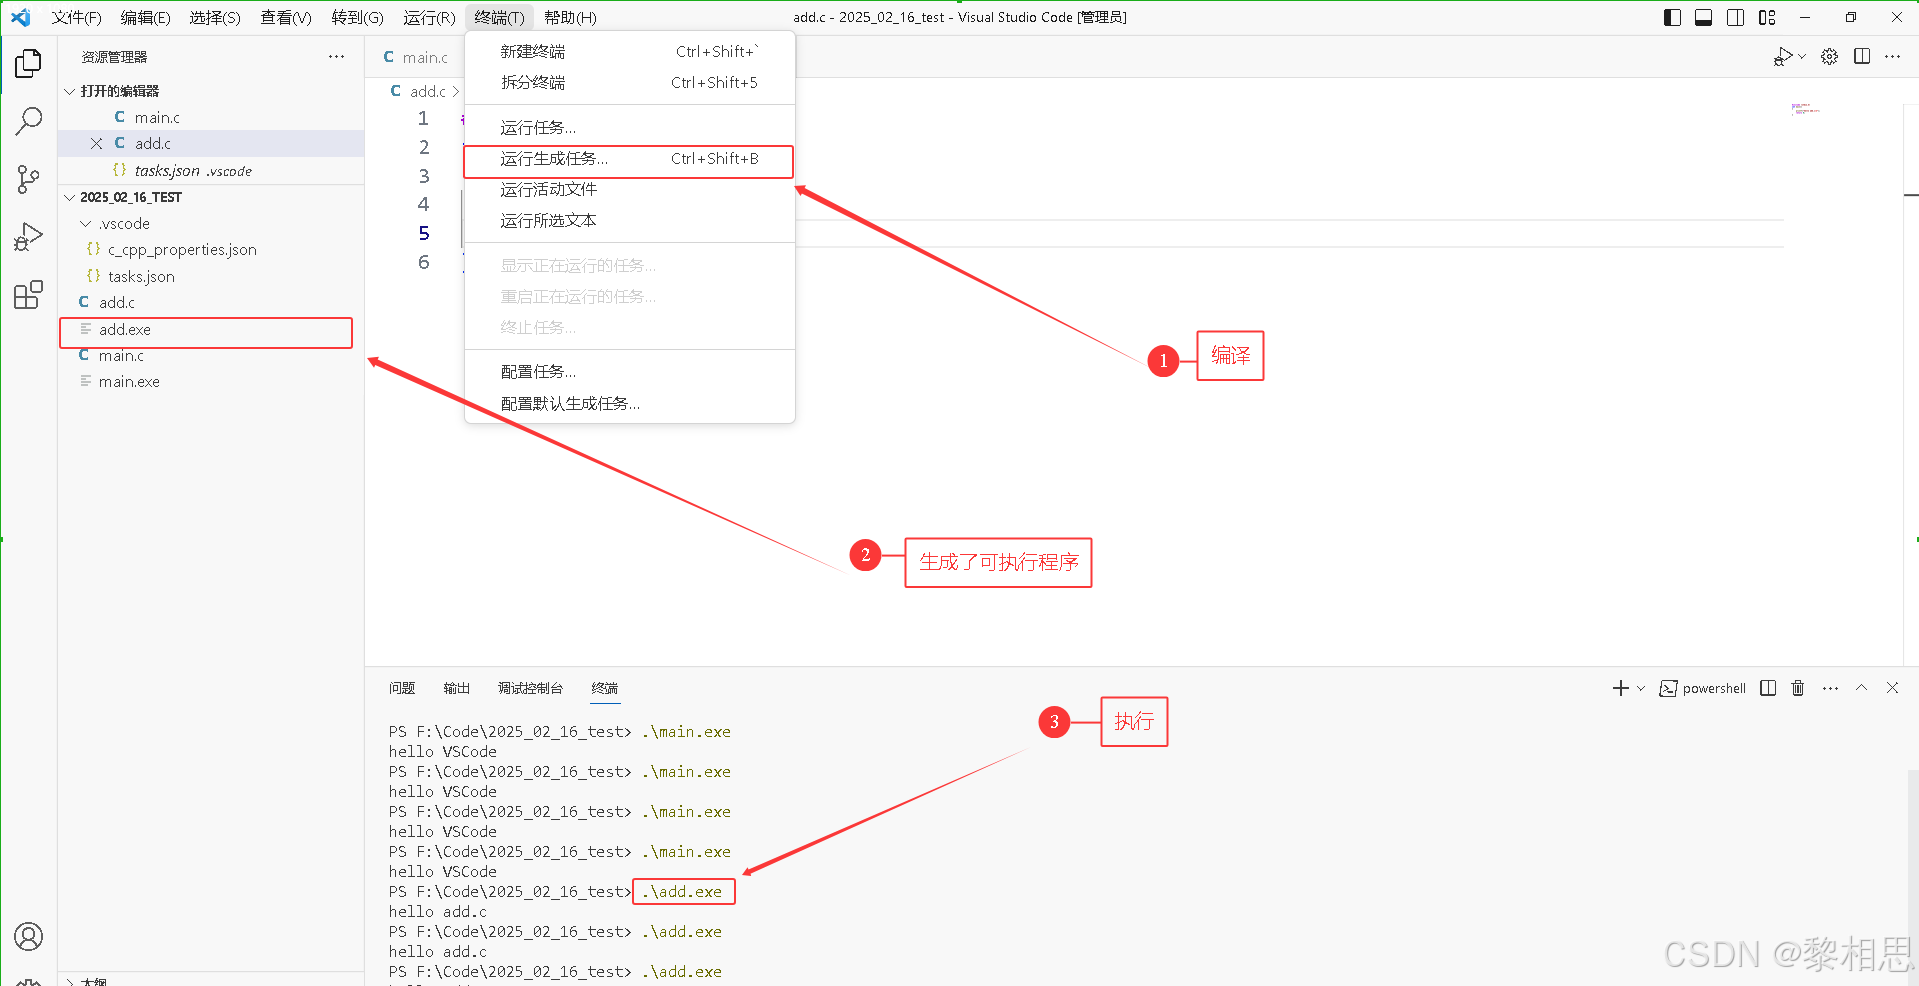
4.6.2 方法二
如果你要写的代码需要单独文件夹管理,那就再次打开新的文件夹来编写代码,编译和执行了。
比如新的代码放在2025_02_17_test下面。
4.6.2.1 新建文件夹2025_02_17_test
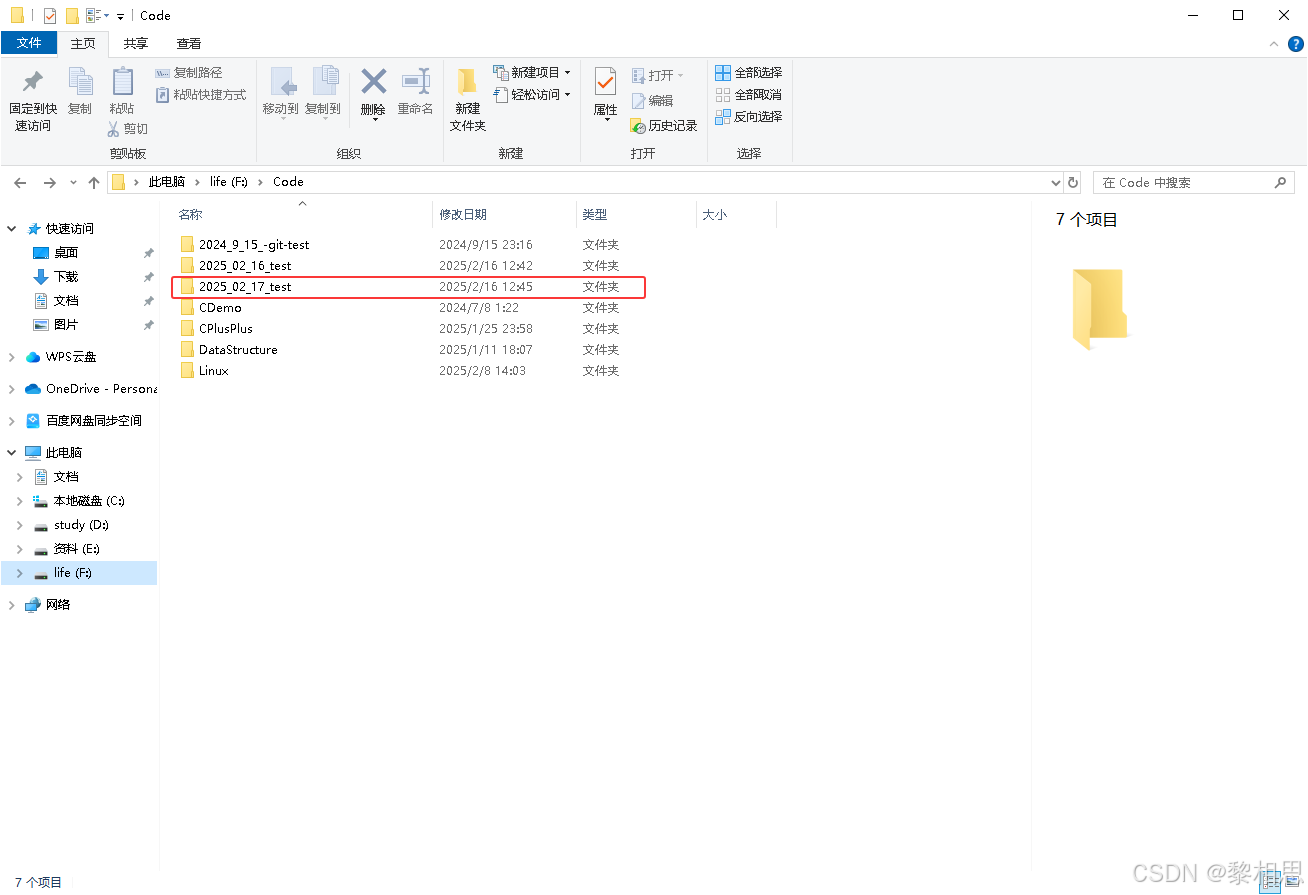
4.6.2.2. 打开文件夹选择2025_02_17_test
首先关闭掉之前打开的文件
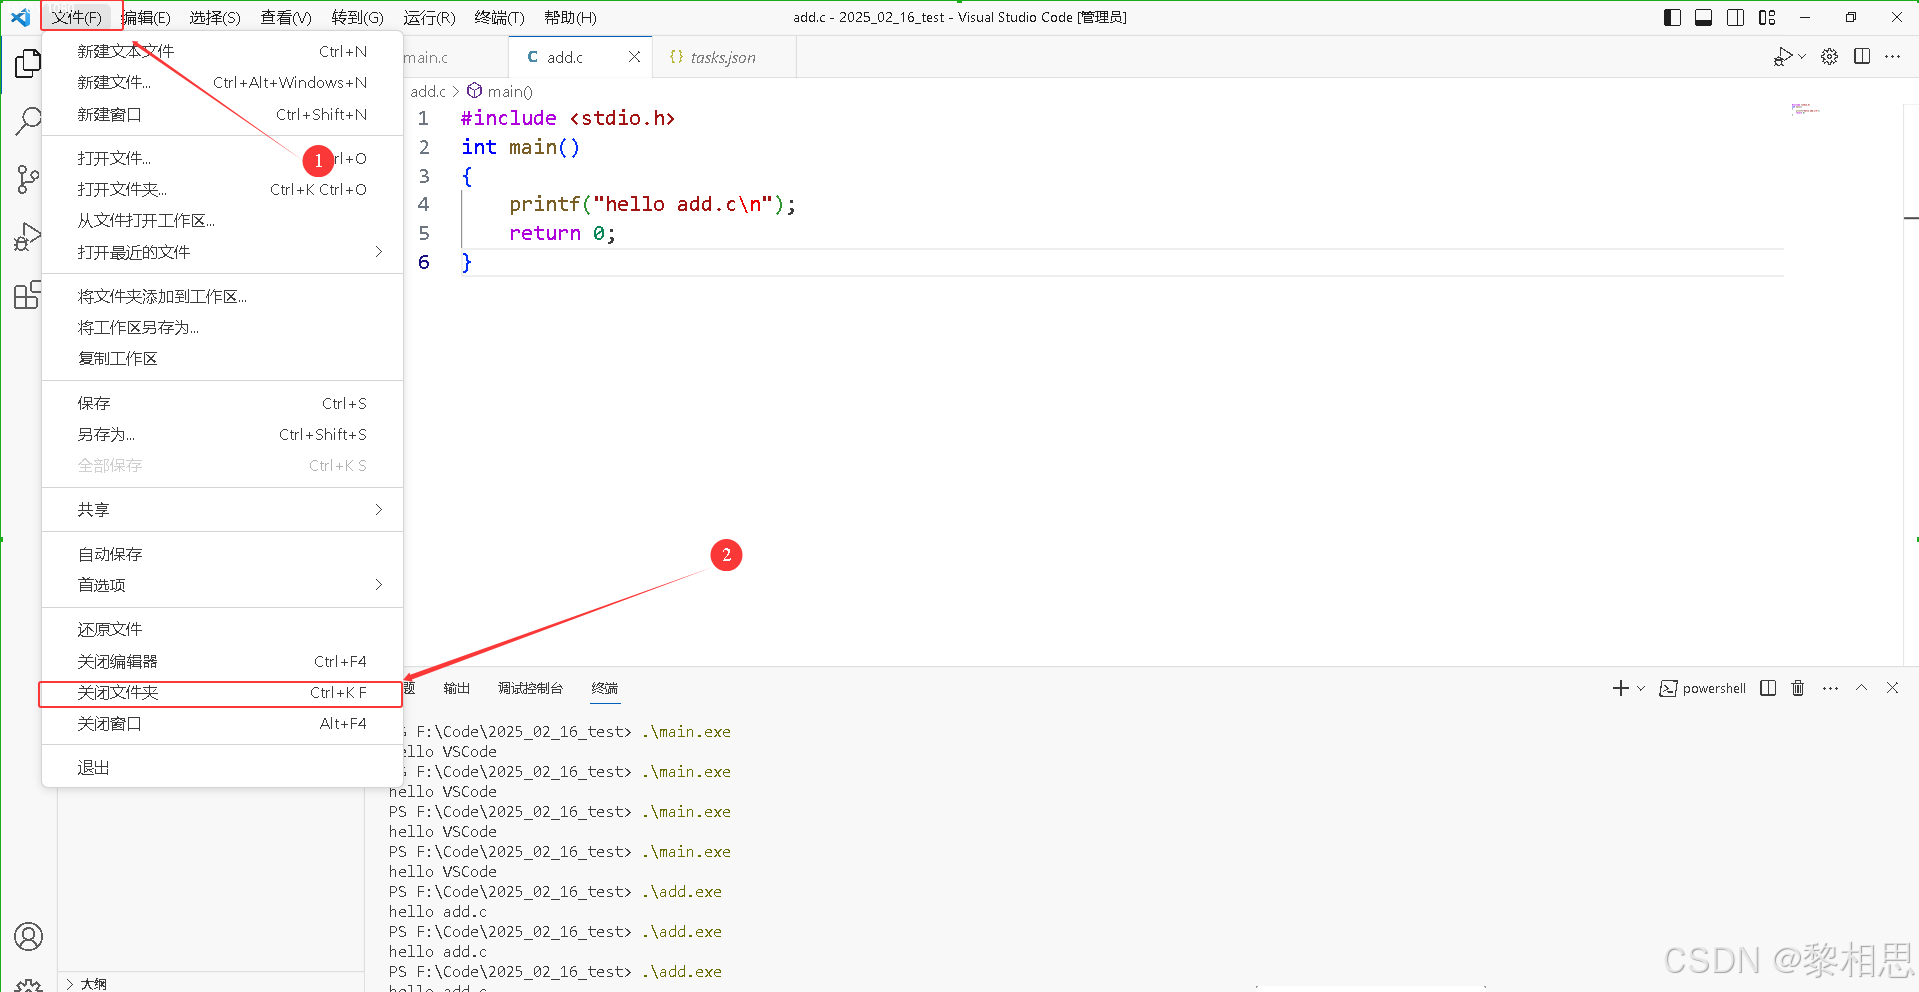
然后打开新的文件
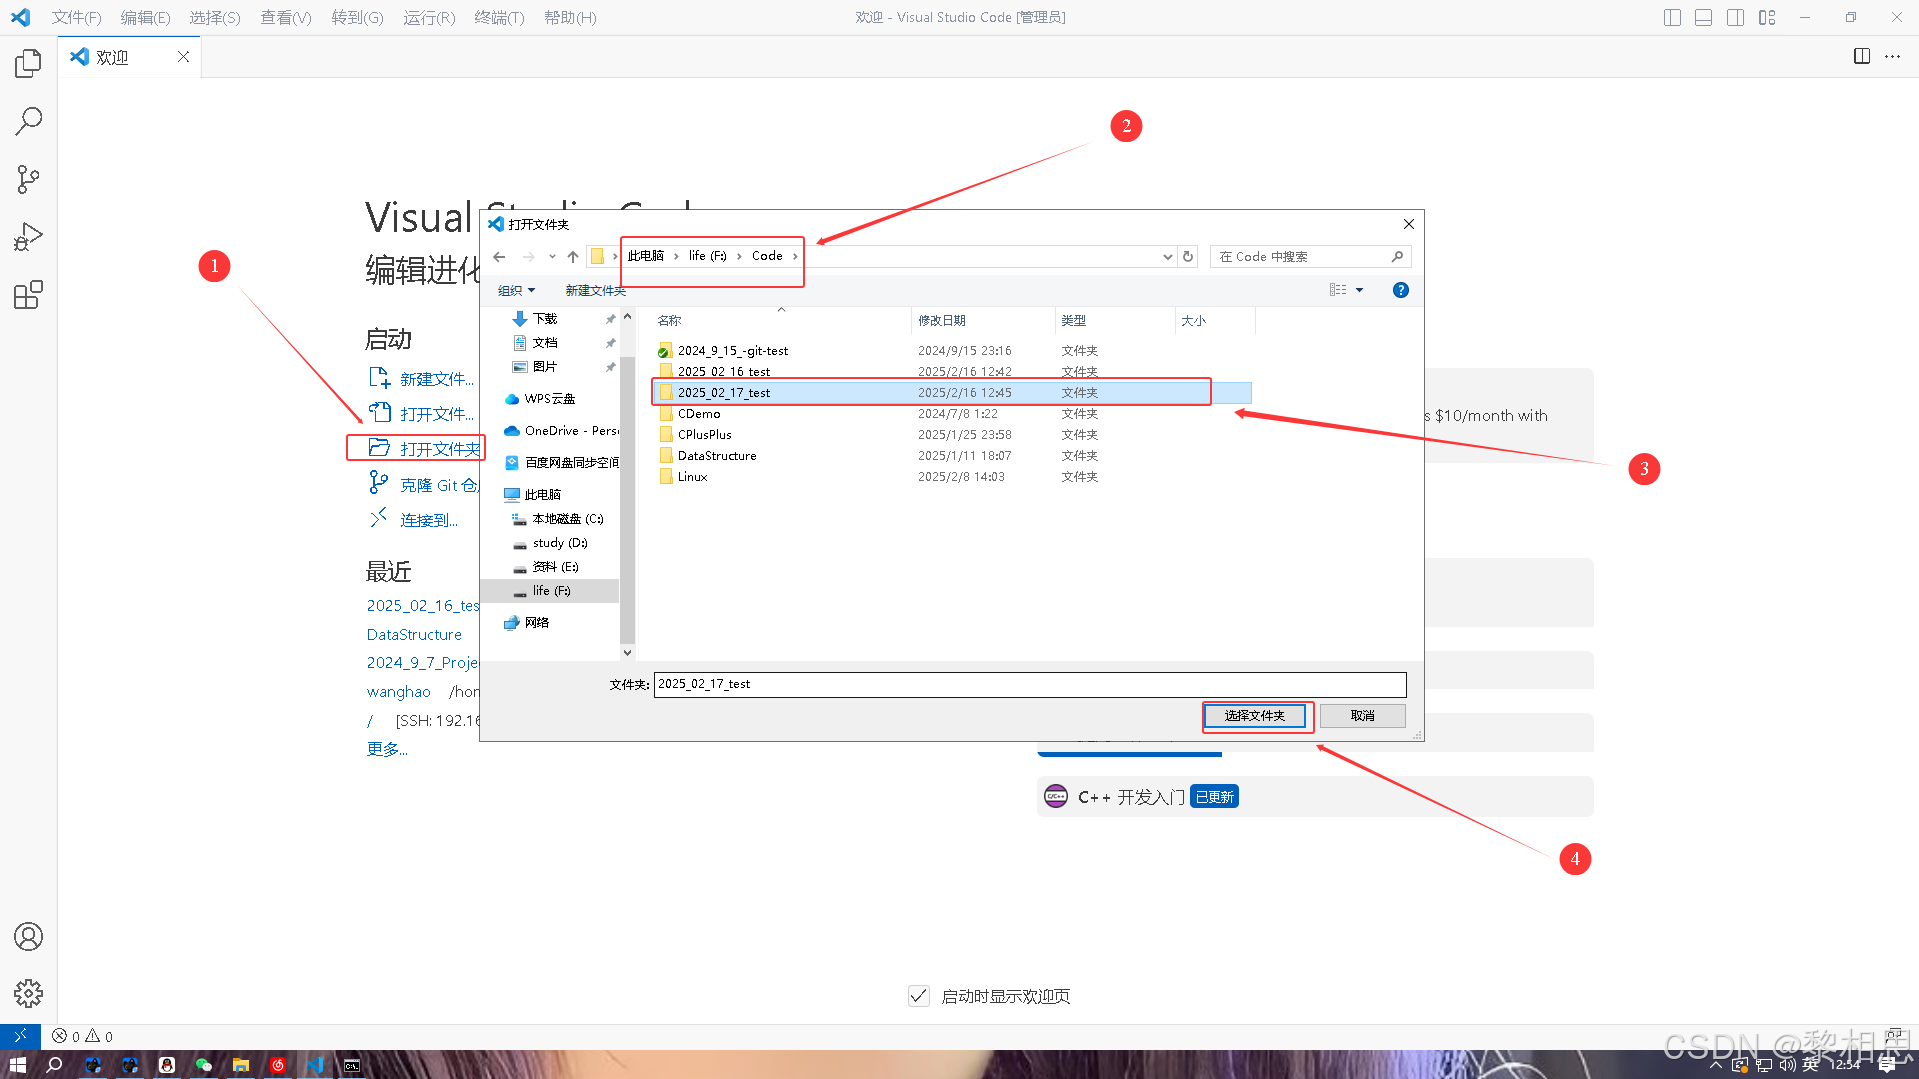
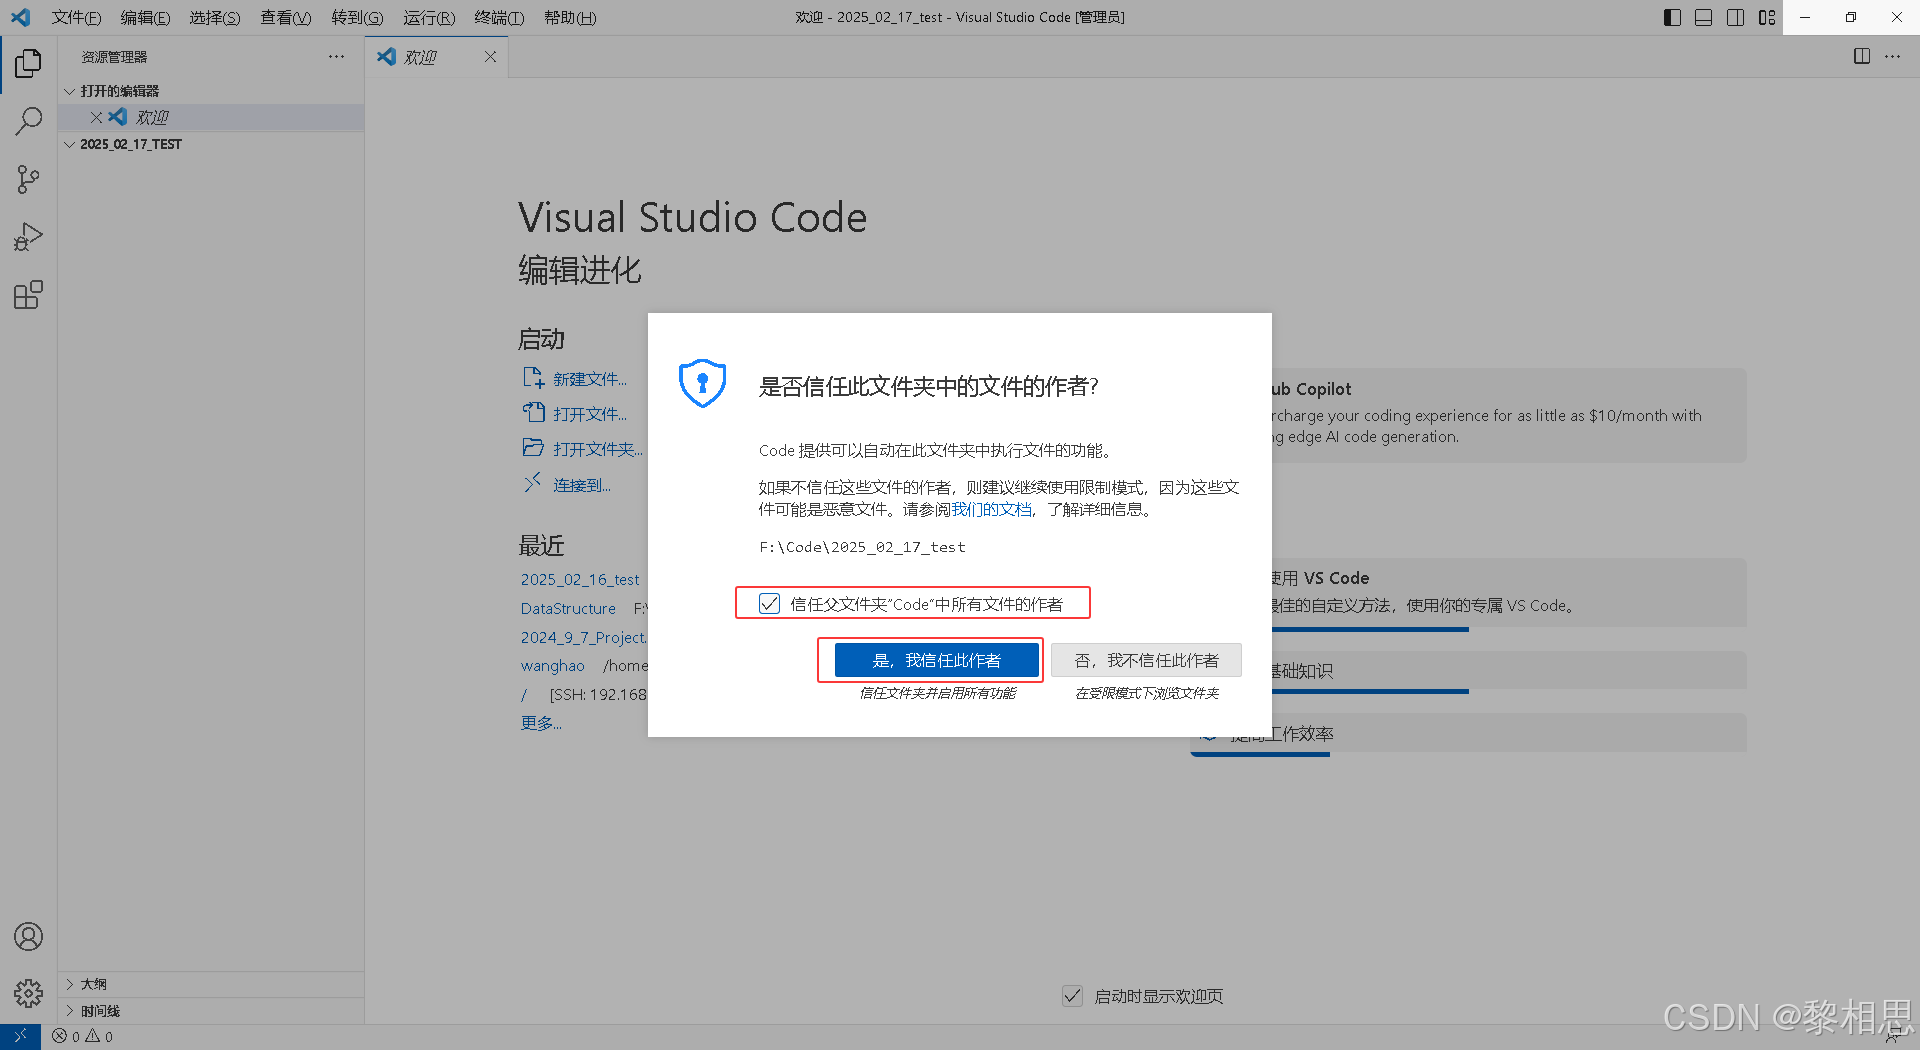
然后点击信任此作者
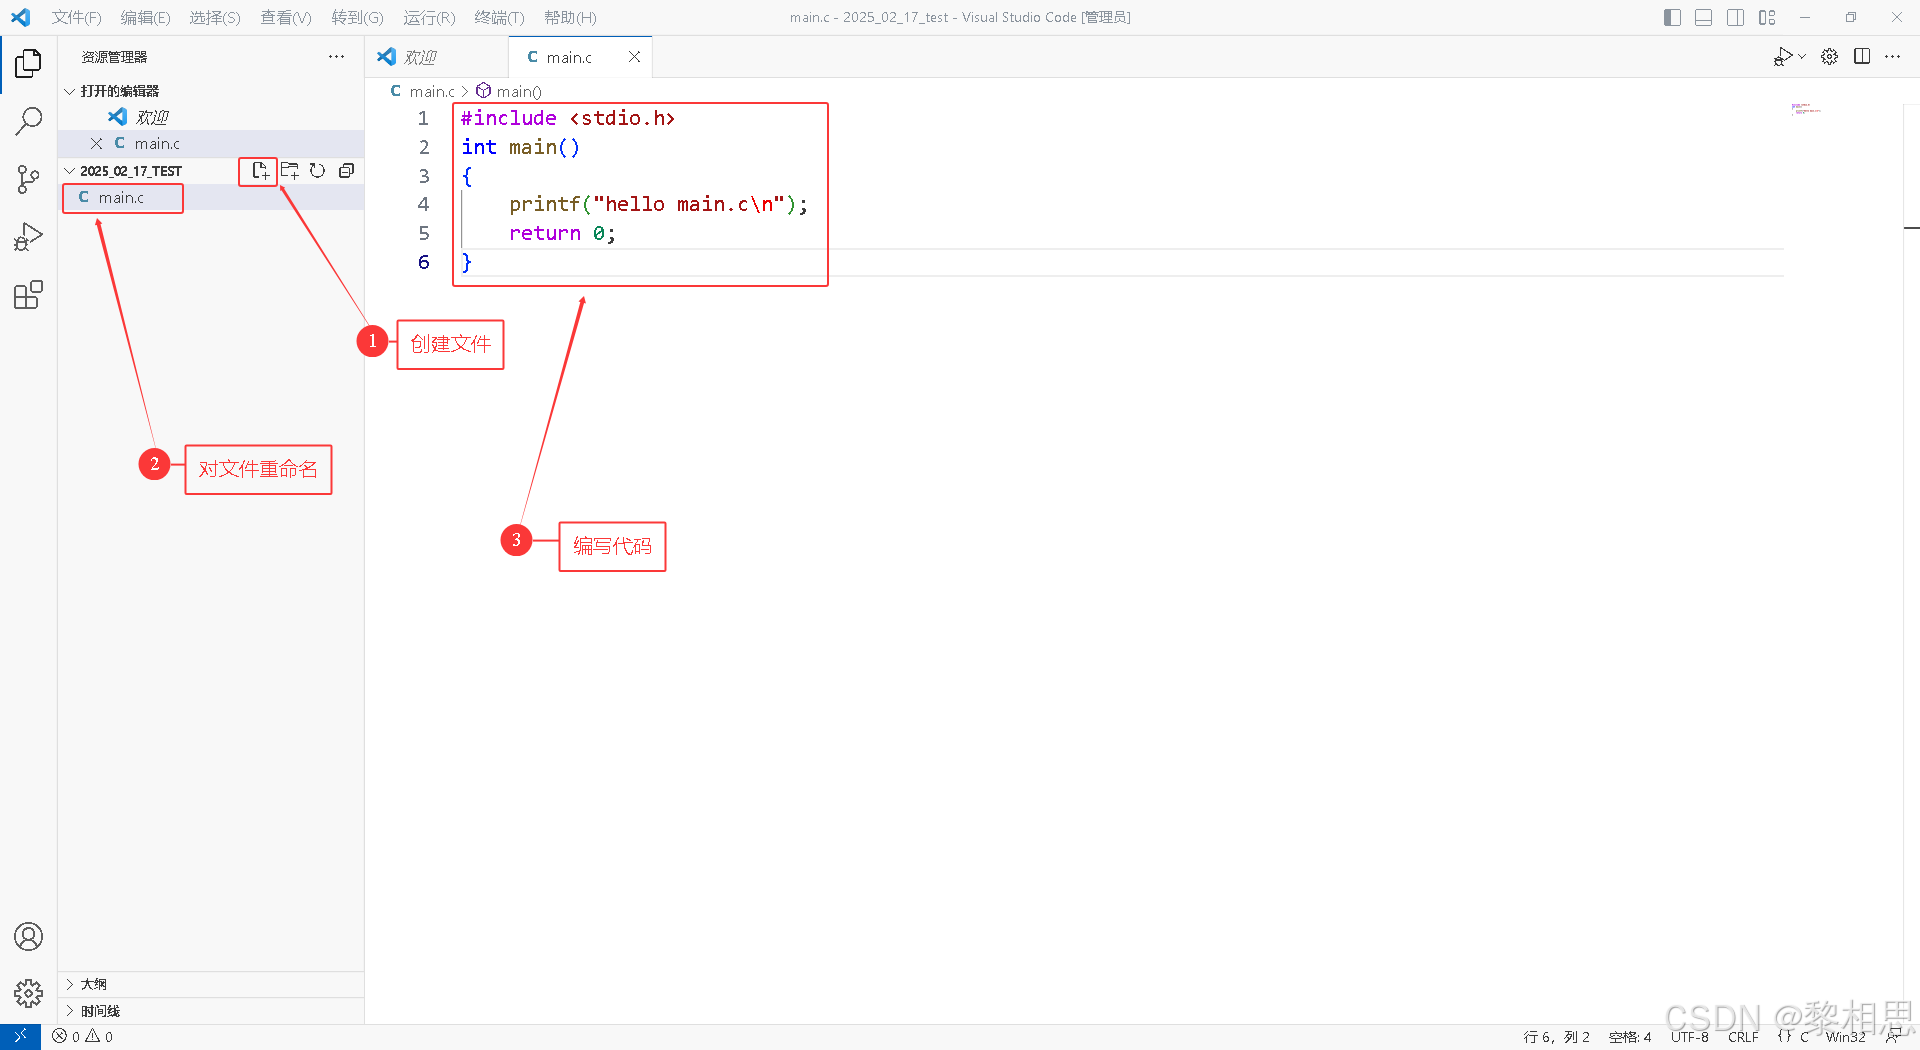
4.6.2.3 编写代码
4.6.2.4 拷贝配置文件
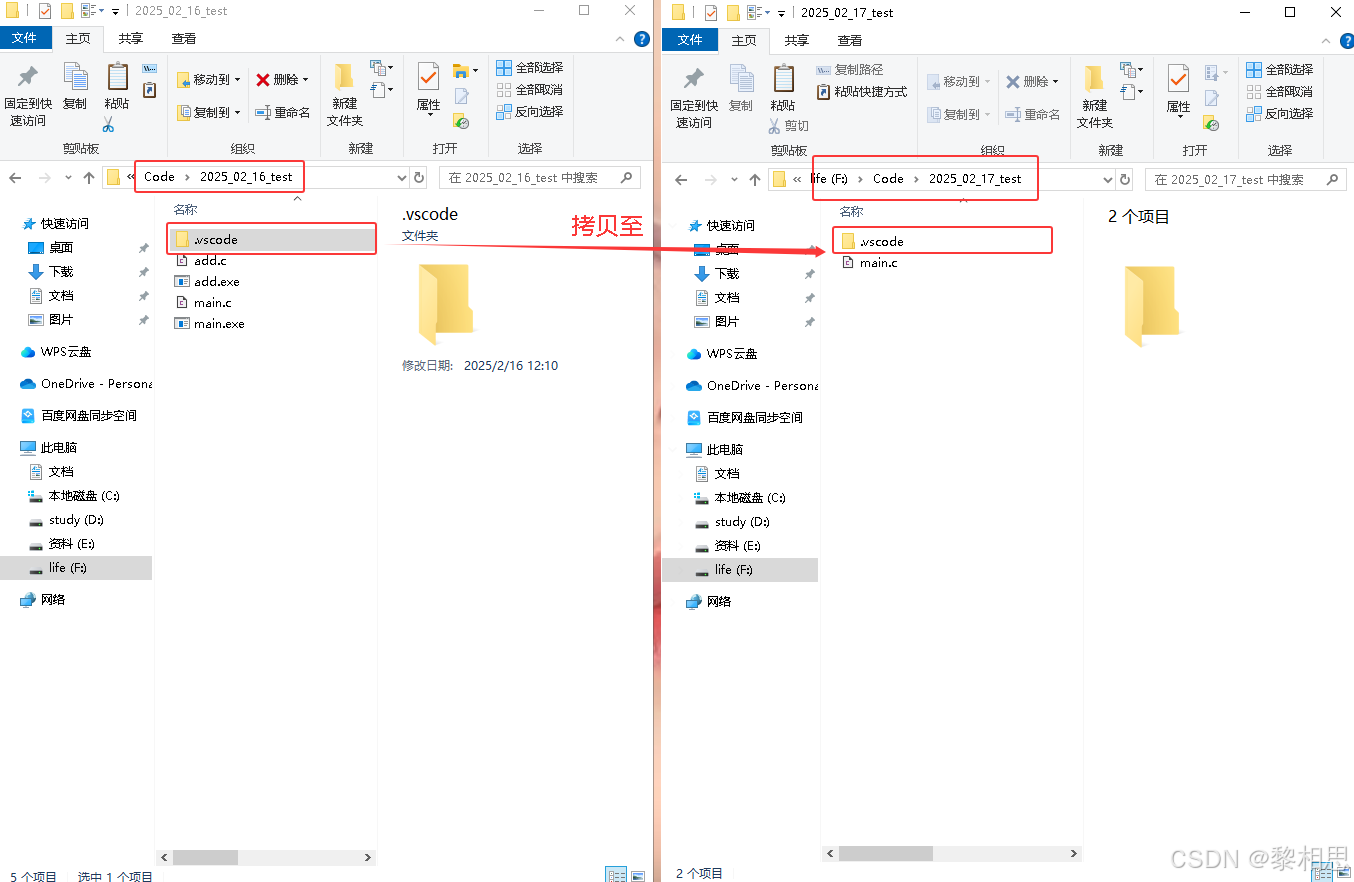
这样时候我们就可以看到配置文件了,我们只需拷贝之前配置的就可以,不需要自己再次配置,拷贝过来啥都不需要修改。
4.5.2.5 编译+执行
4.7 一个工程中有多个.c文件怎么办?
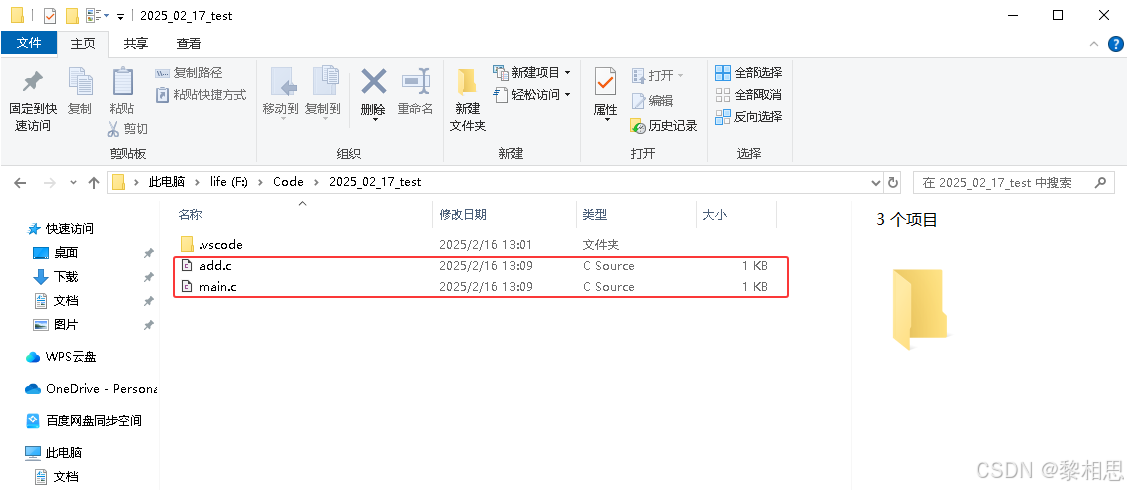
4.7.1 创建文件
假设我们在一个工程中,下面有多个文件需要编译,这个我就直接在上次的工程中创建了,效果是一样的。
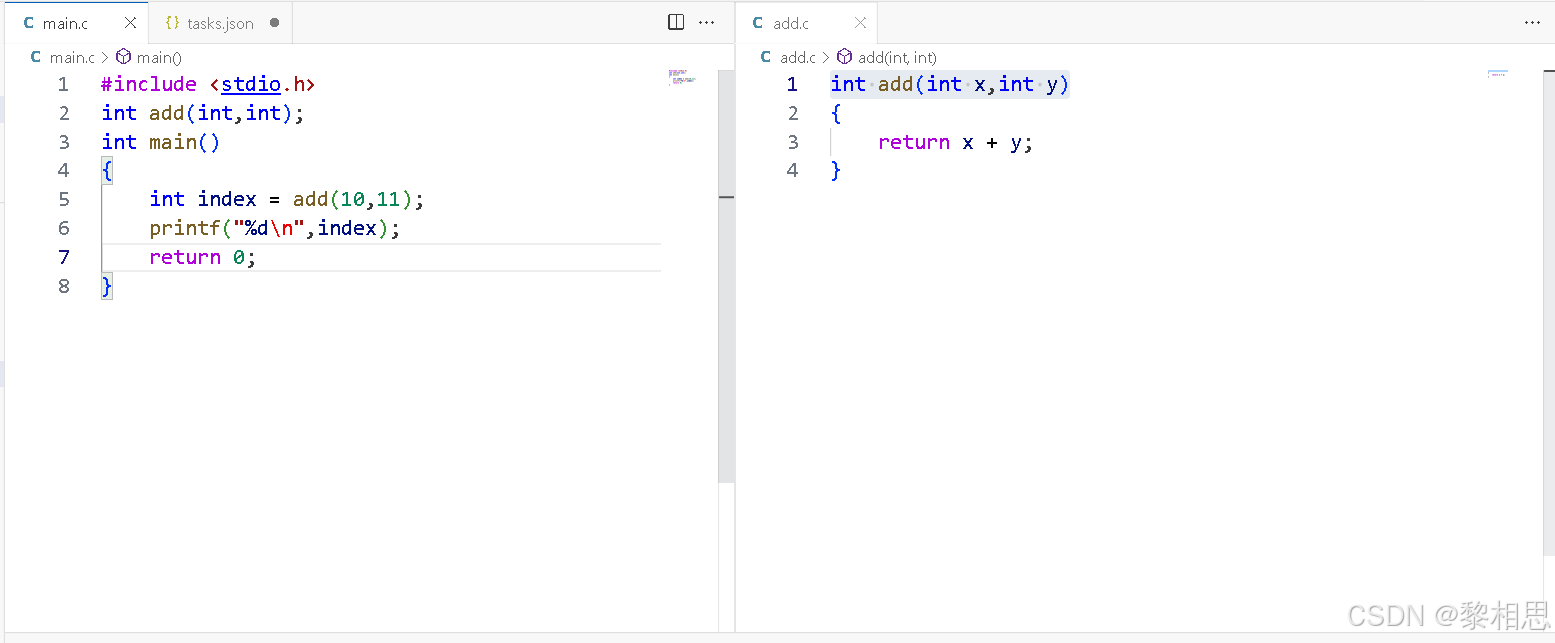
4.7.2 编写代码
现在只有一个main函数,然后main函数中调用别的文件中的函数。
4.7.3 修改配置文件tasks.json并验证结果
要能够编译一个文件中的多个文件,需要定制tasks.json文件的内容
编译多个源文件代码:
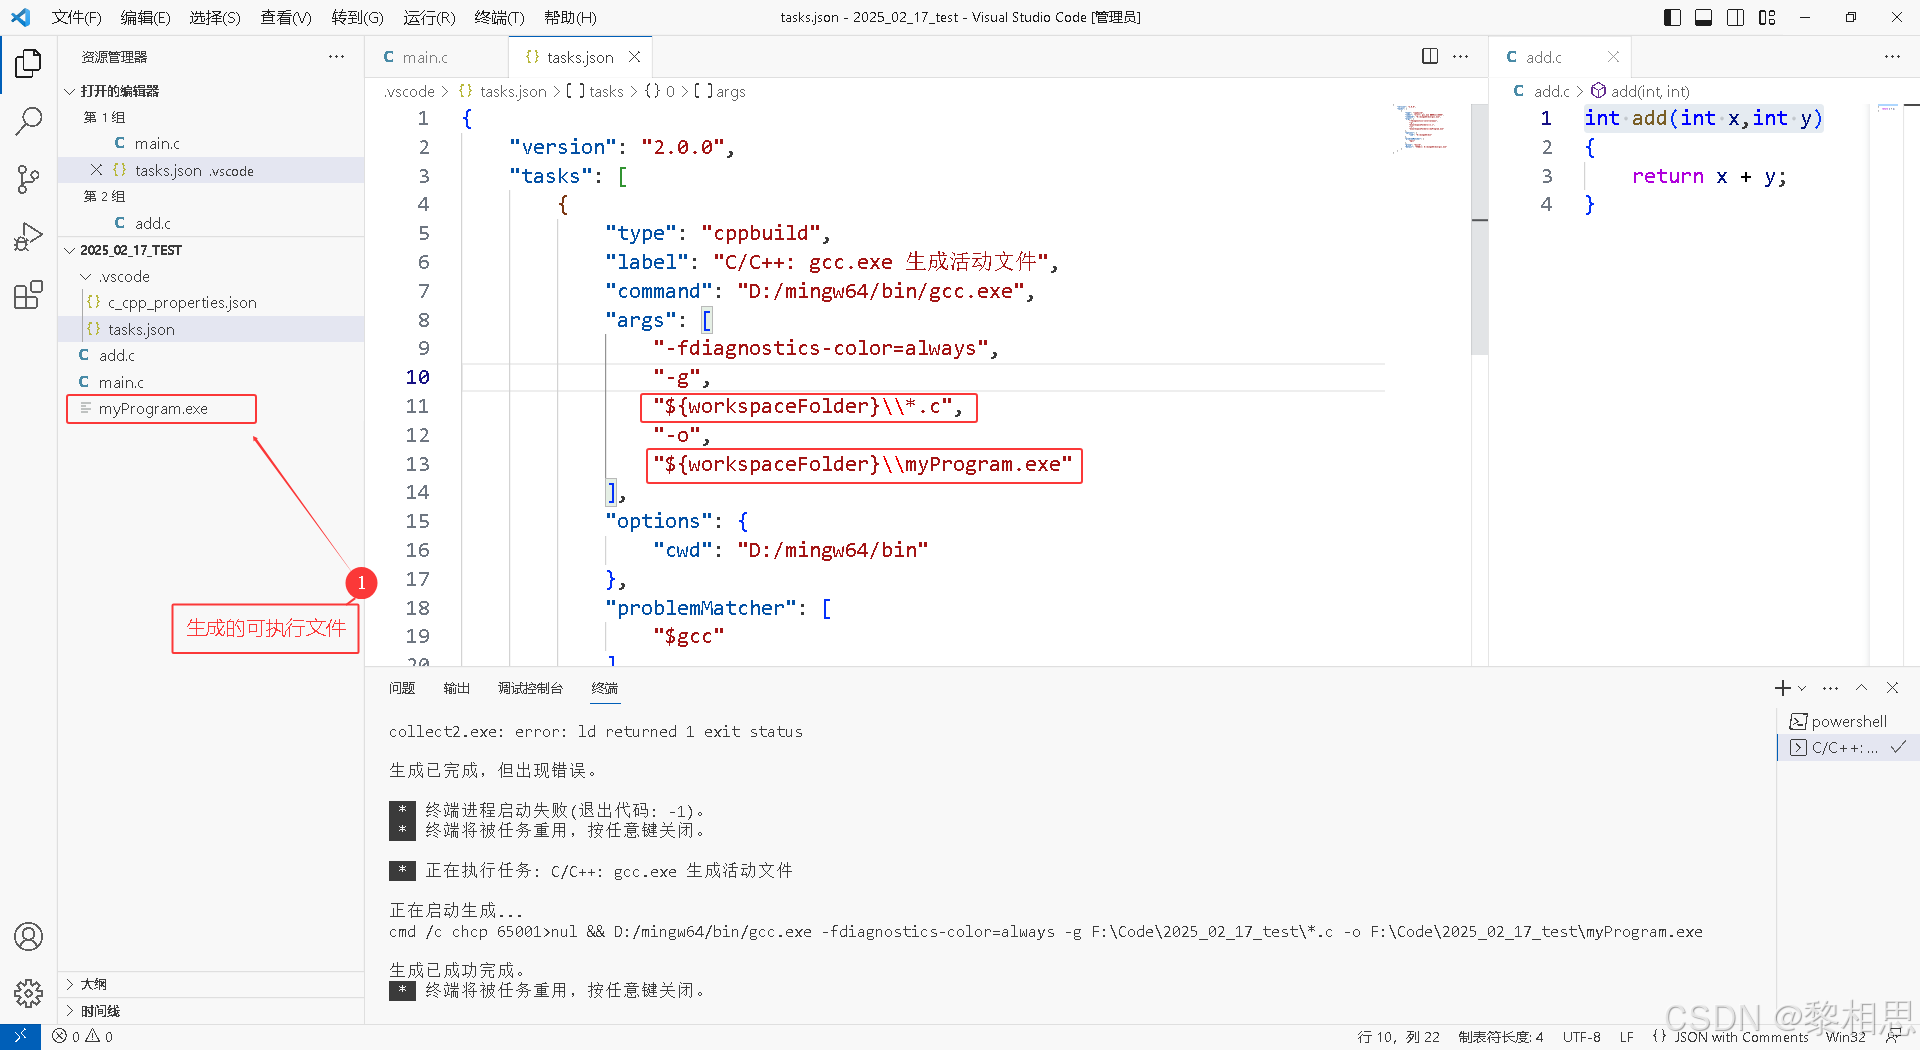
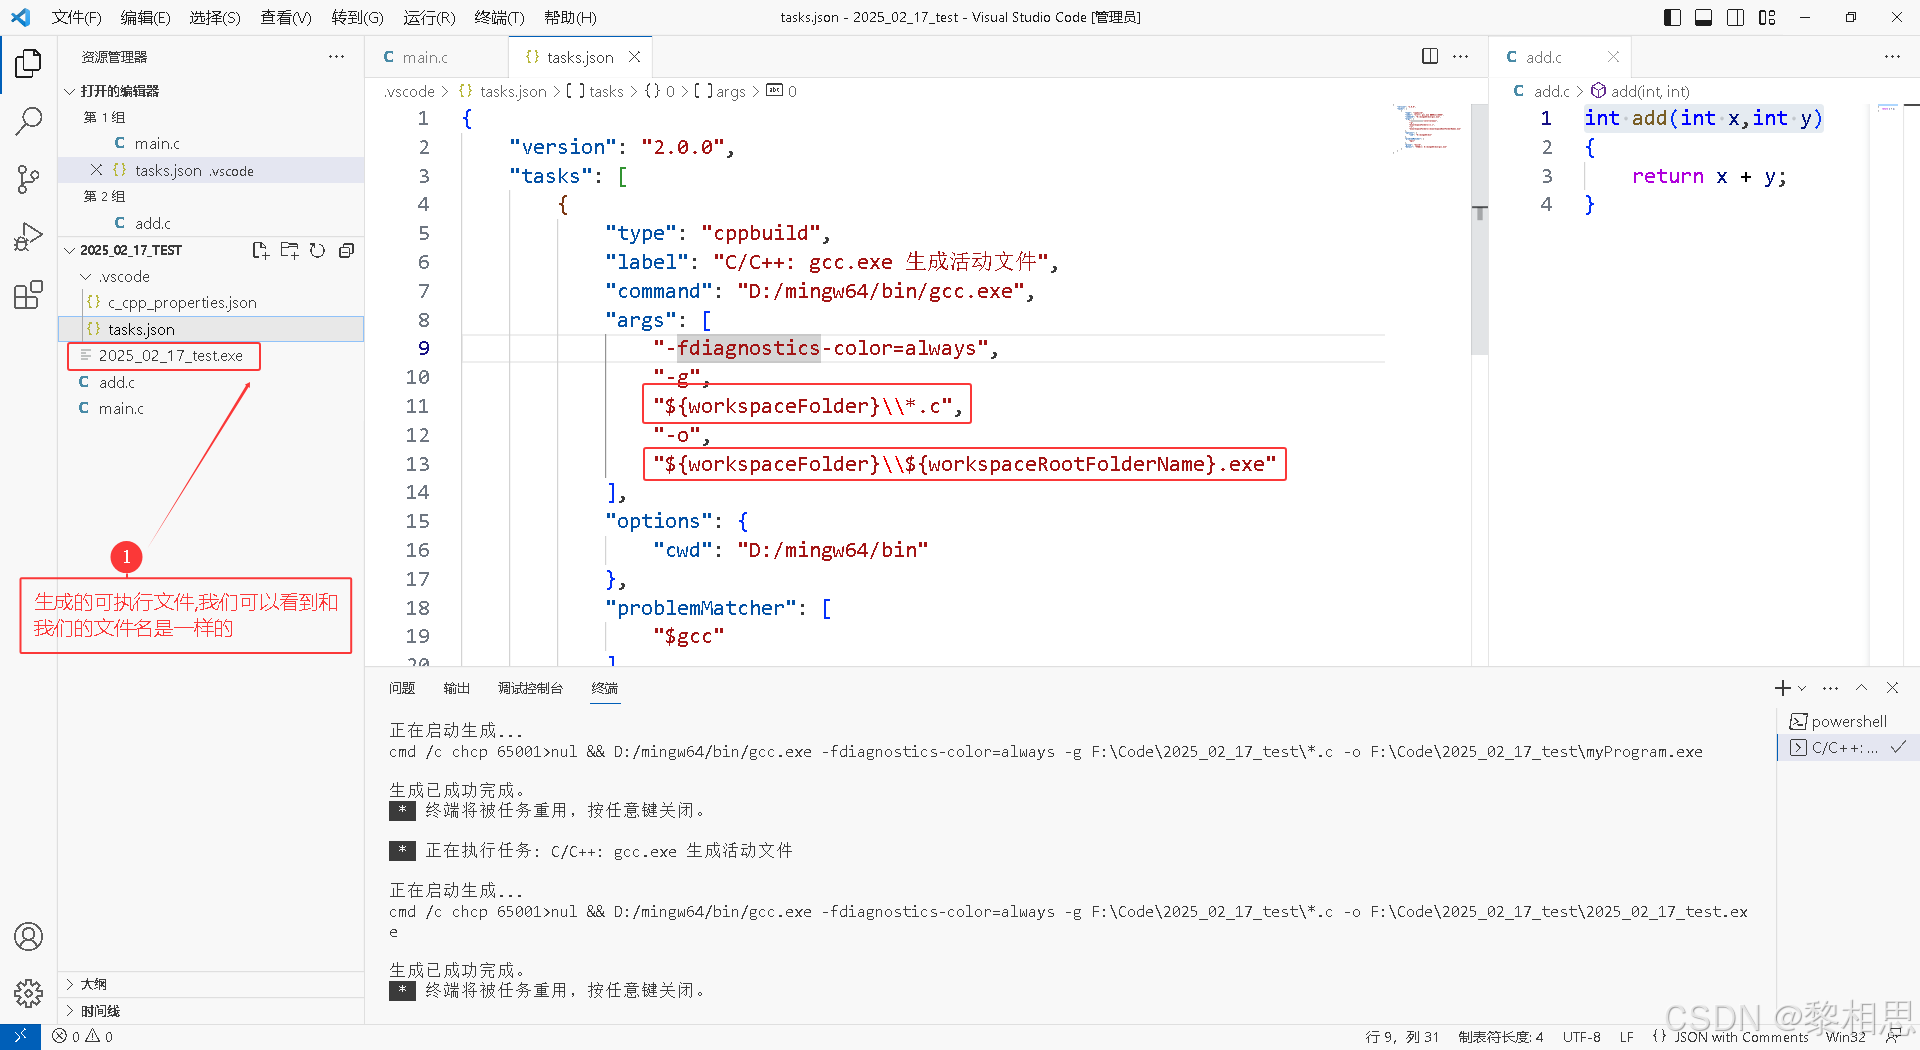
- 通过把"${file}"修改为"${workspaceFolder}\\*.c",可以构建当前工作区的所有C文件。
- 通过把"${file}"修改为"${workspaceFolder}\\*.cpp",可以构建当前工作区的所有C++文件。
修改编译输出的文件名:
- 通过把"${fileDirname}\\${fileBasenameNoExtension}.exe",修改为:"${workspaceFolder}\\myProgram.exe",可以把编译输出的文件名硬编码为myProgram.exe,而不是与C文件同名。效果看4.7.3.1
- 通过把"${fileDirname}\\${fileBasenameNoExtension}.exe",修改为:"${workspaceFolder}\\${workspaceRootFolderName}.exe",可以把编译输出的文件名为:打开的工作区文件夹名字。效果看4.7.3.2
4.7.3.1 效果一
4.7.3.2 效果二
4.7.4 编译 + 运行
5. VSCode 怎么写C++的代码呢?
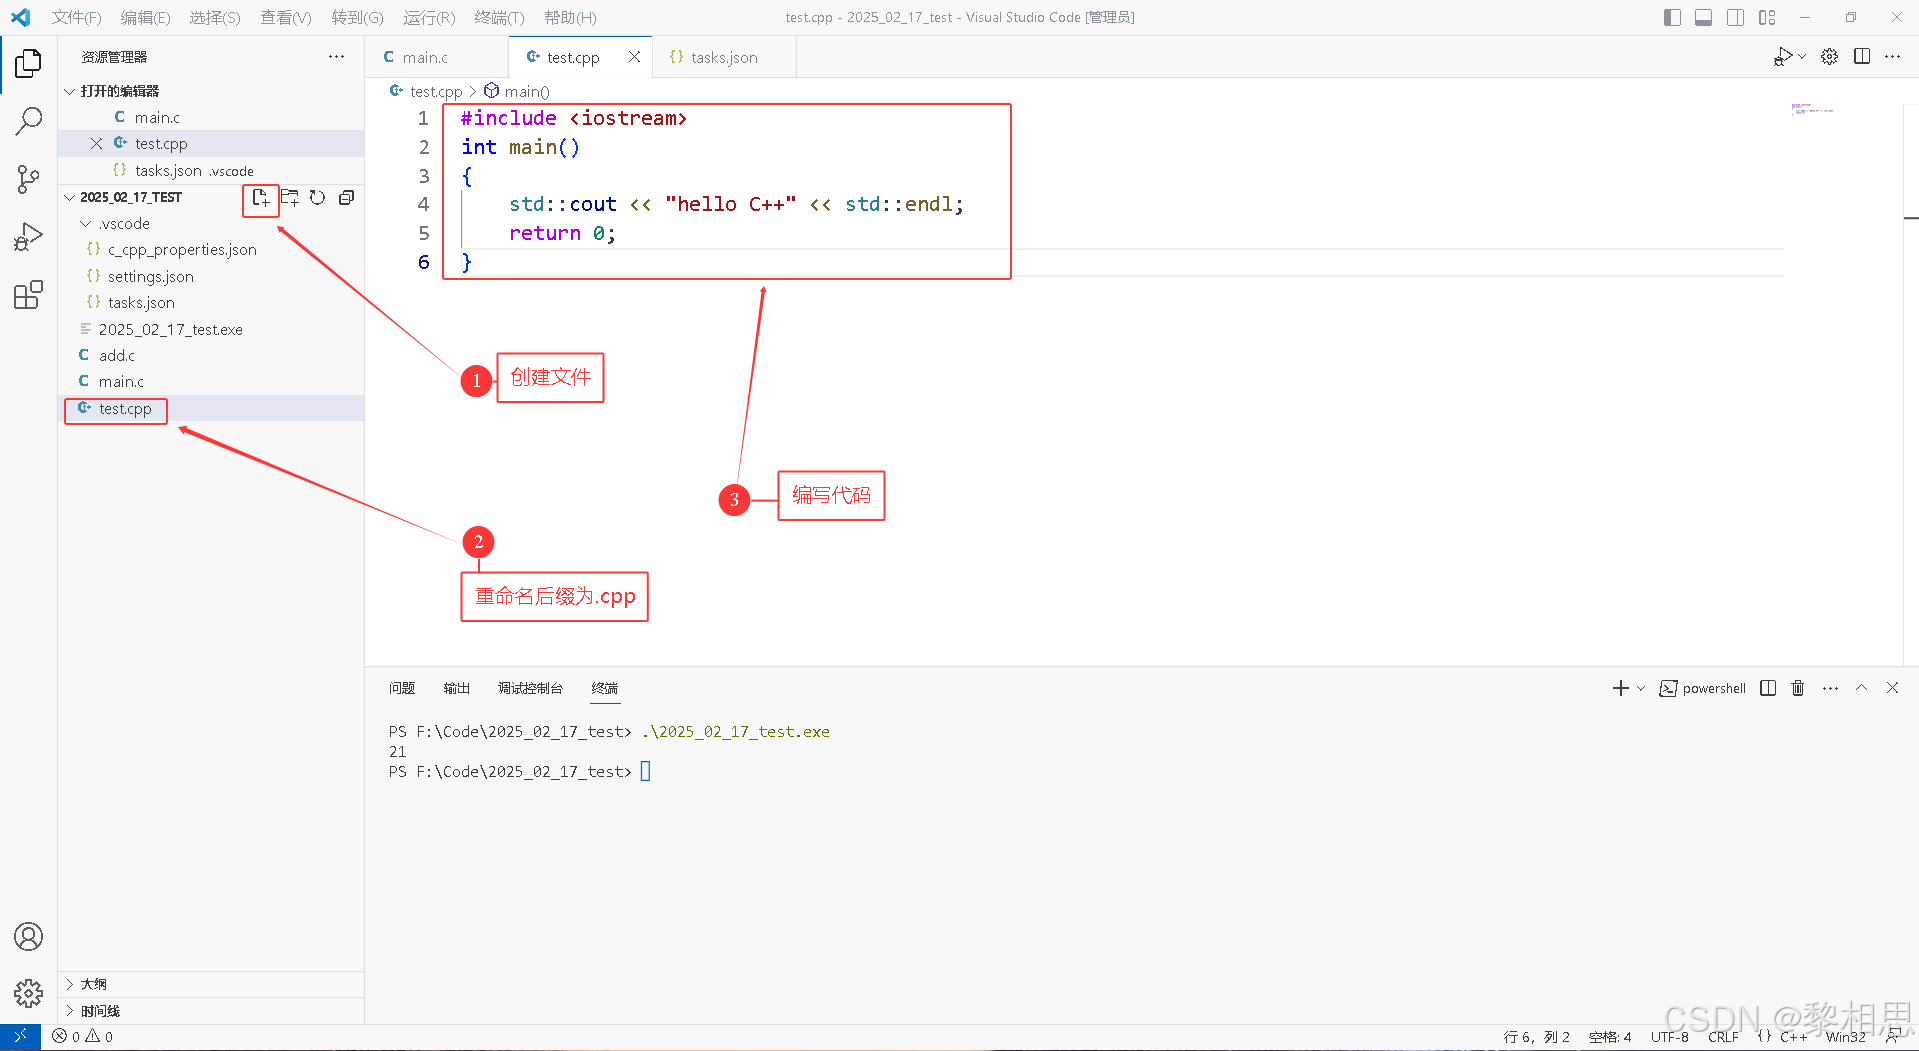
5.1 创建文件,编写代码
5.2配置g++.exe为编译器
鼠标点在.cpp的源文件内部,按ctrl+shift+p快捷键,在弹出的界面中选择:【C/C++:编辑配置(UI)】,然后进入设置页面。
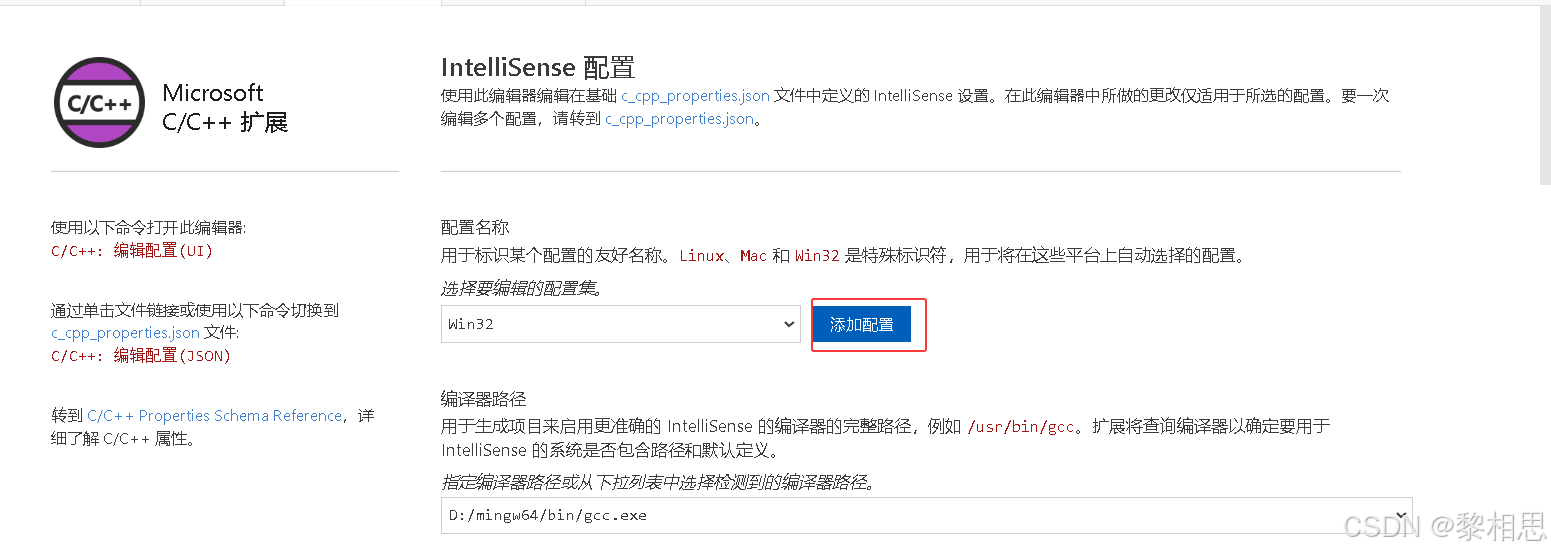
找到配置名称,这里我们再添加一个C++的配置,点击【添加配置】
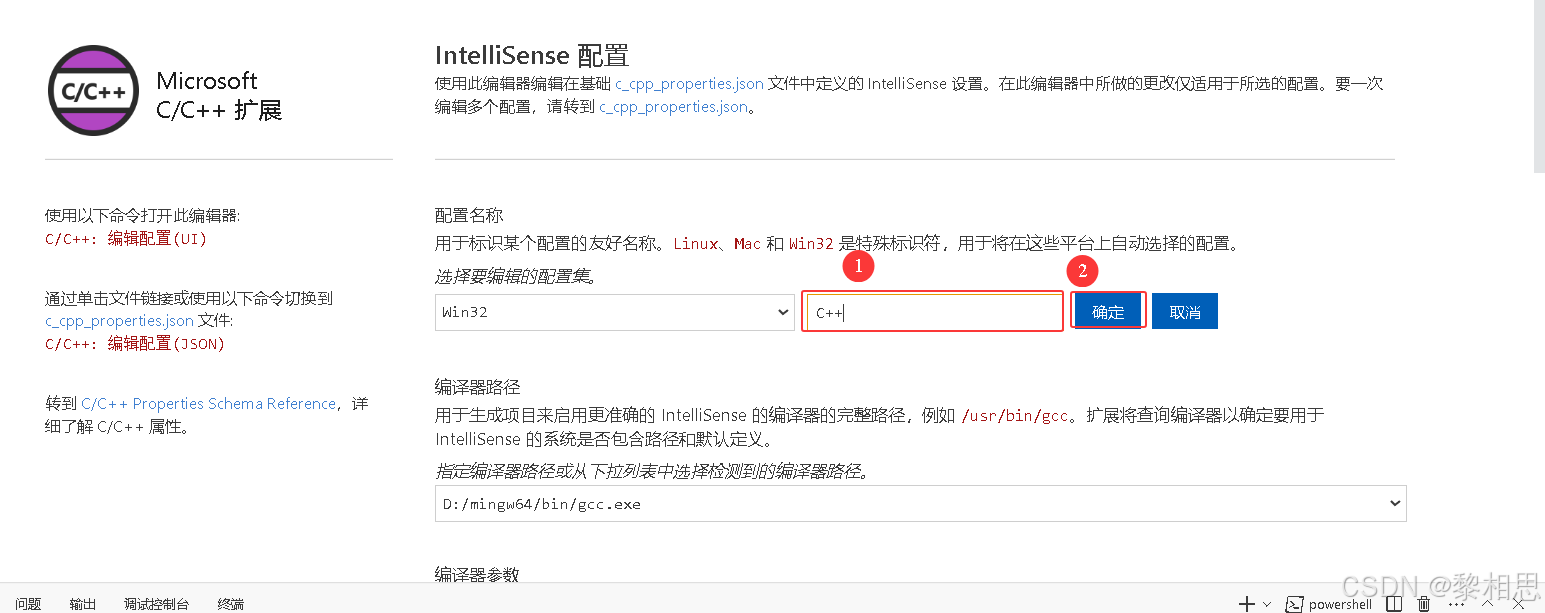
输入C++,当然你也可以根据自己的喜好命名,然后点击确定。
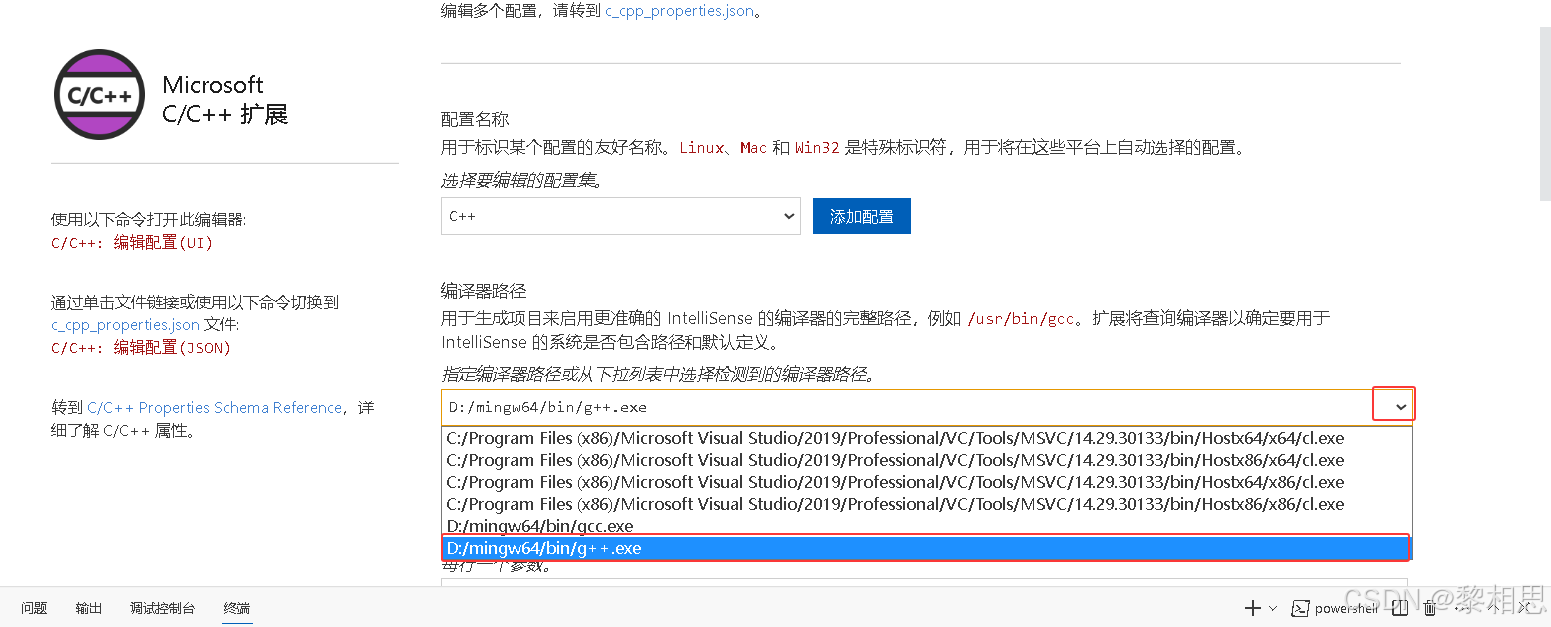
编译器路径,根据自己的mingw64的路径,g++.exe。
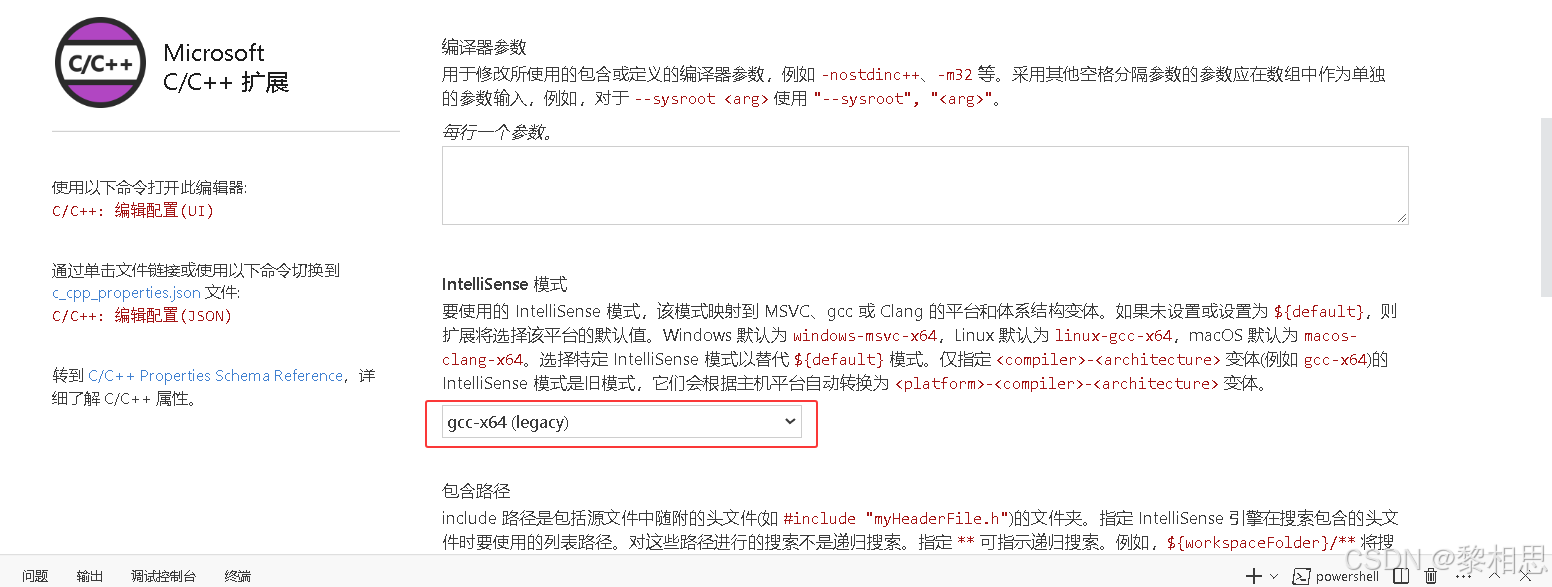
代码提示:
这时再c_cpp_propertise.json文件中就能看到一个名字叫:C++配置。
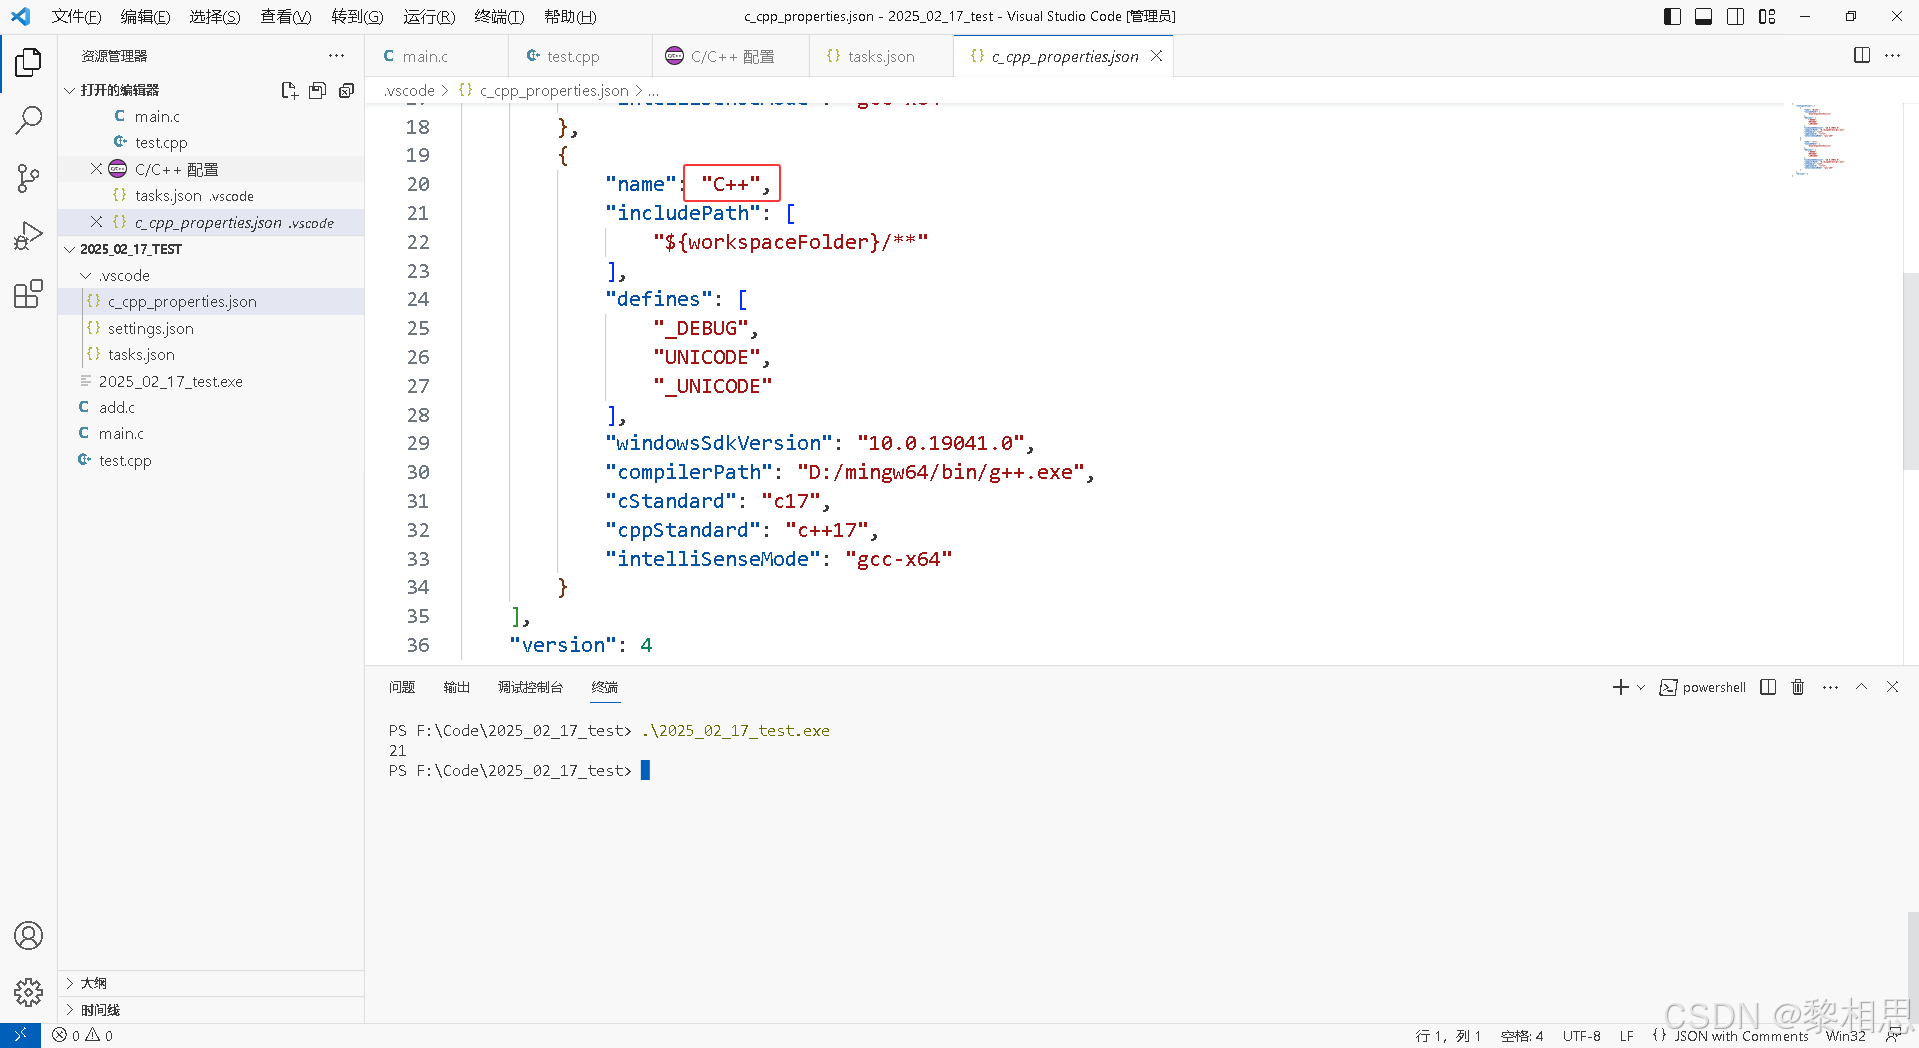
5.3 生成C++源文件编译的tasks信息
点中.cpp文件,菜单中在终端下配置任务。
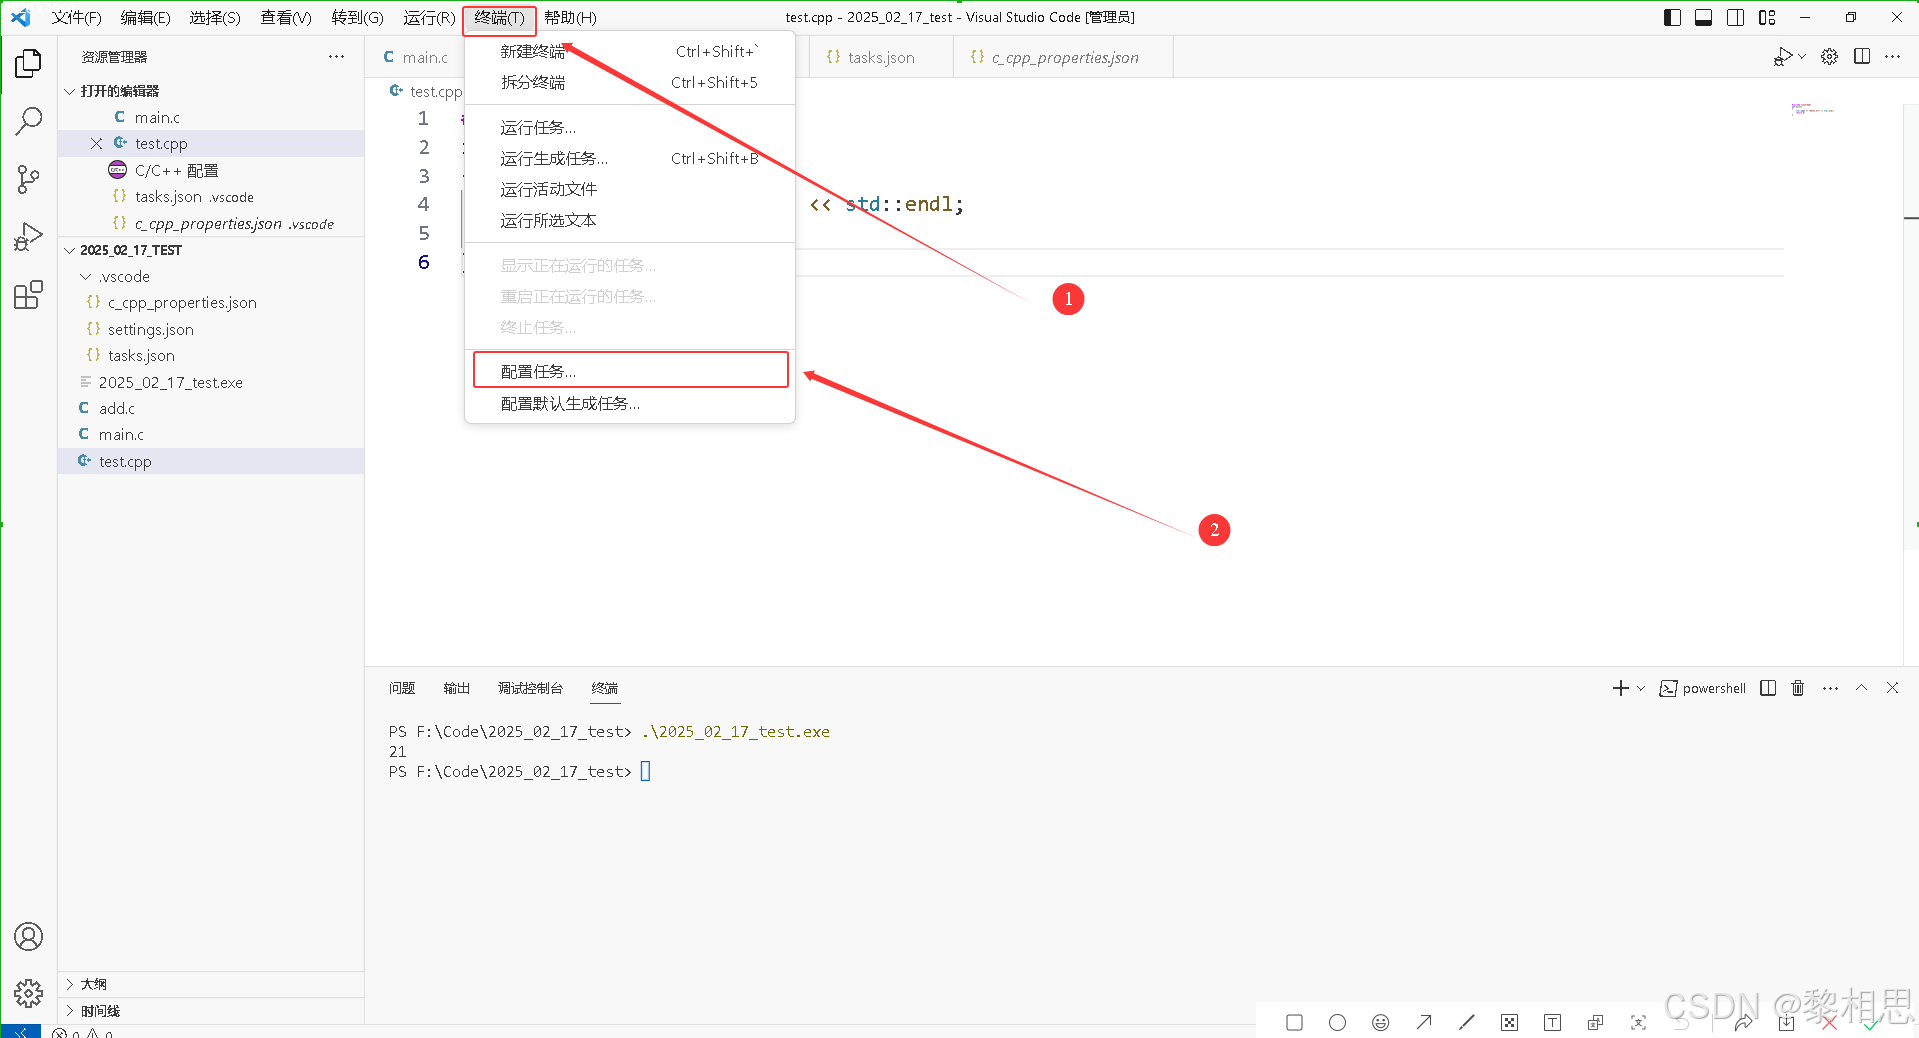
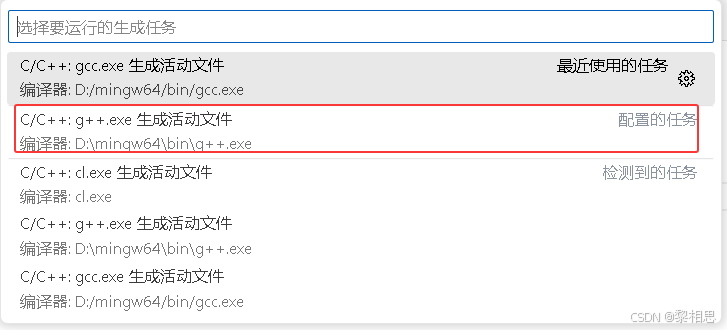
选择g++.exe 生成活动文件
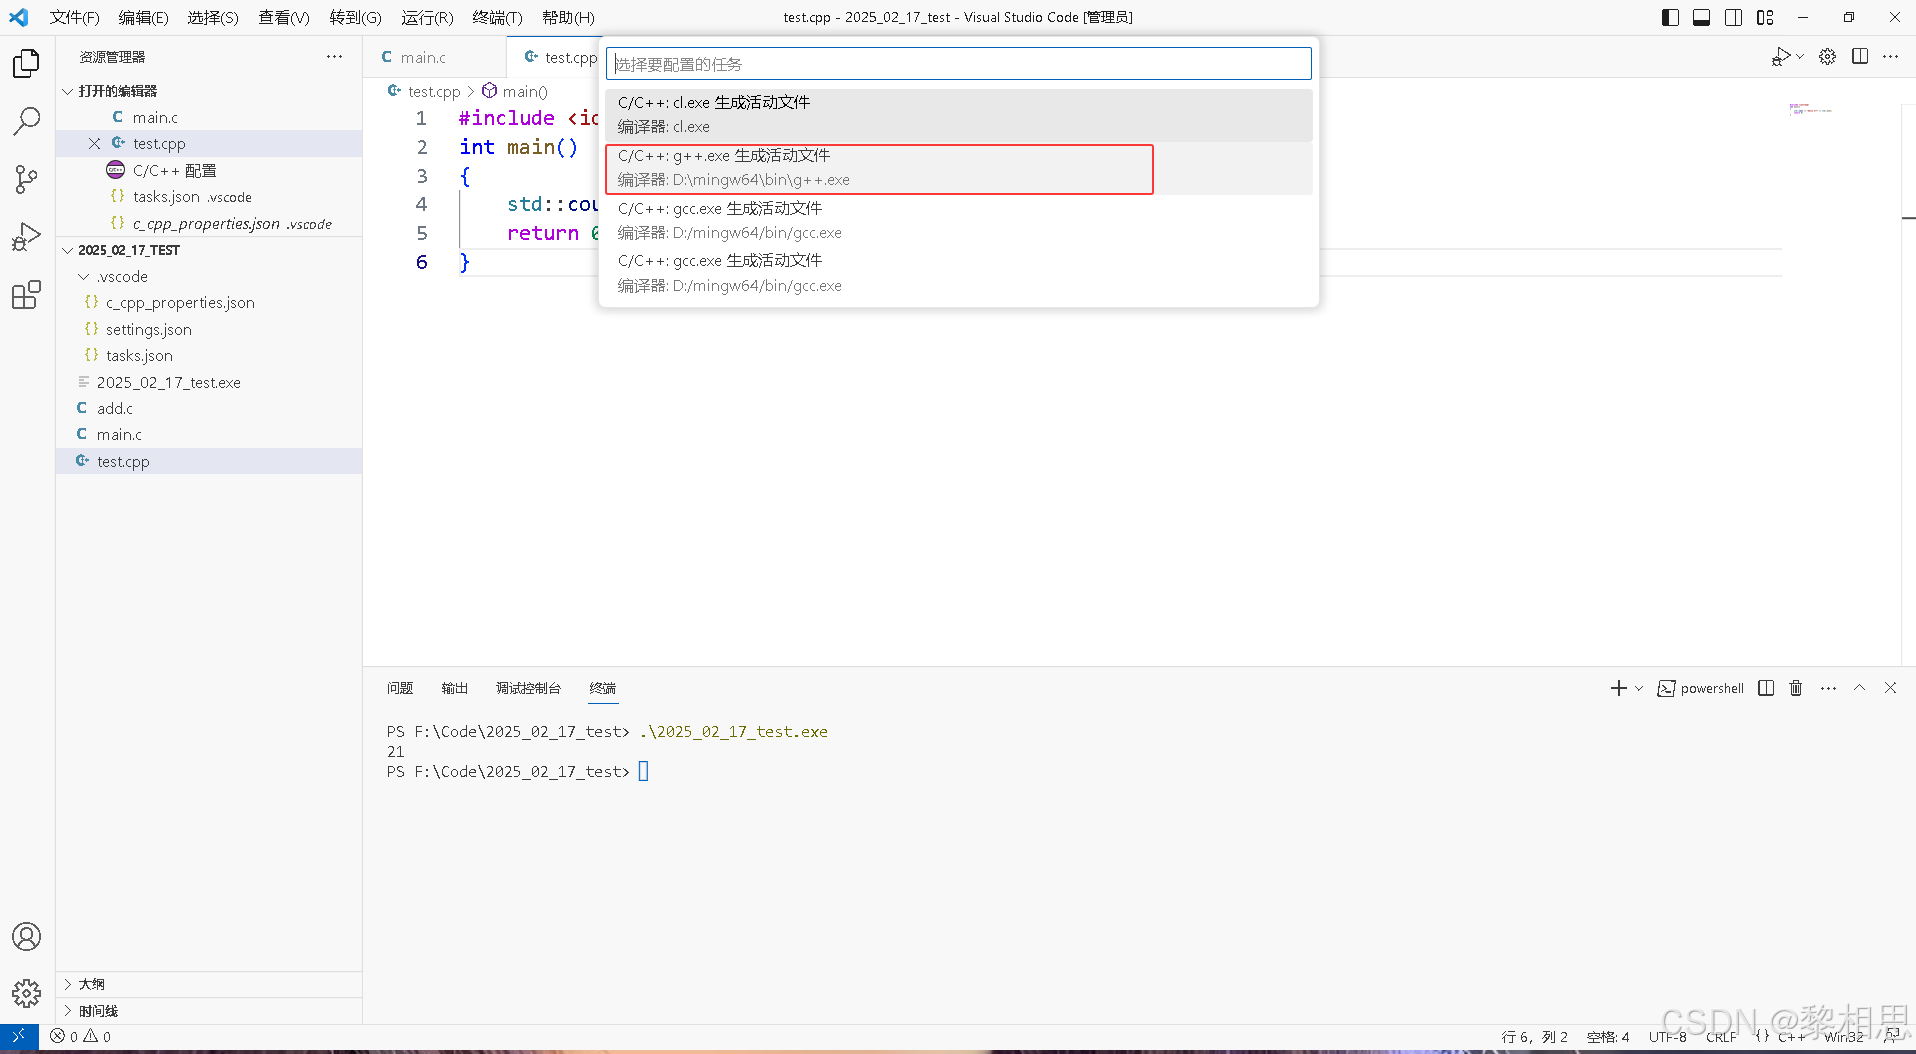
这个时候就在tasks.json中生成了C++的编译选项了
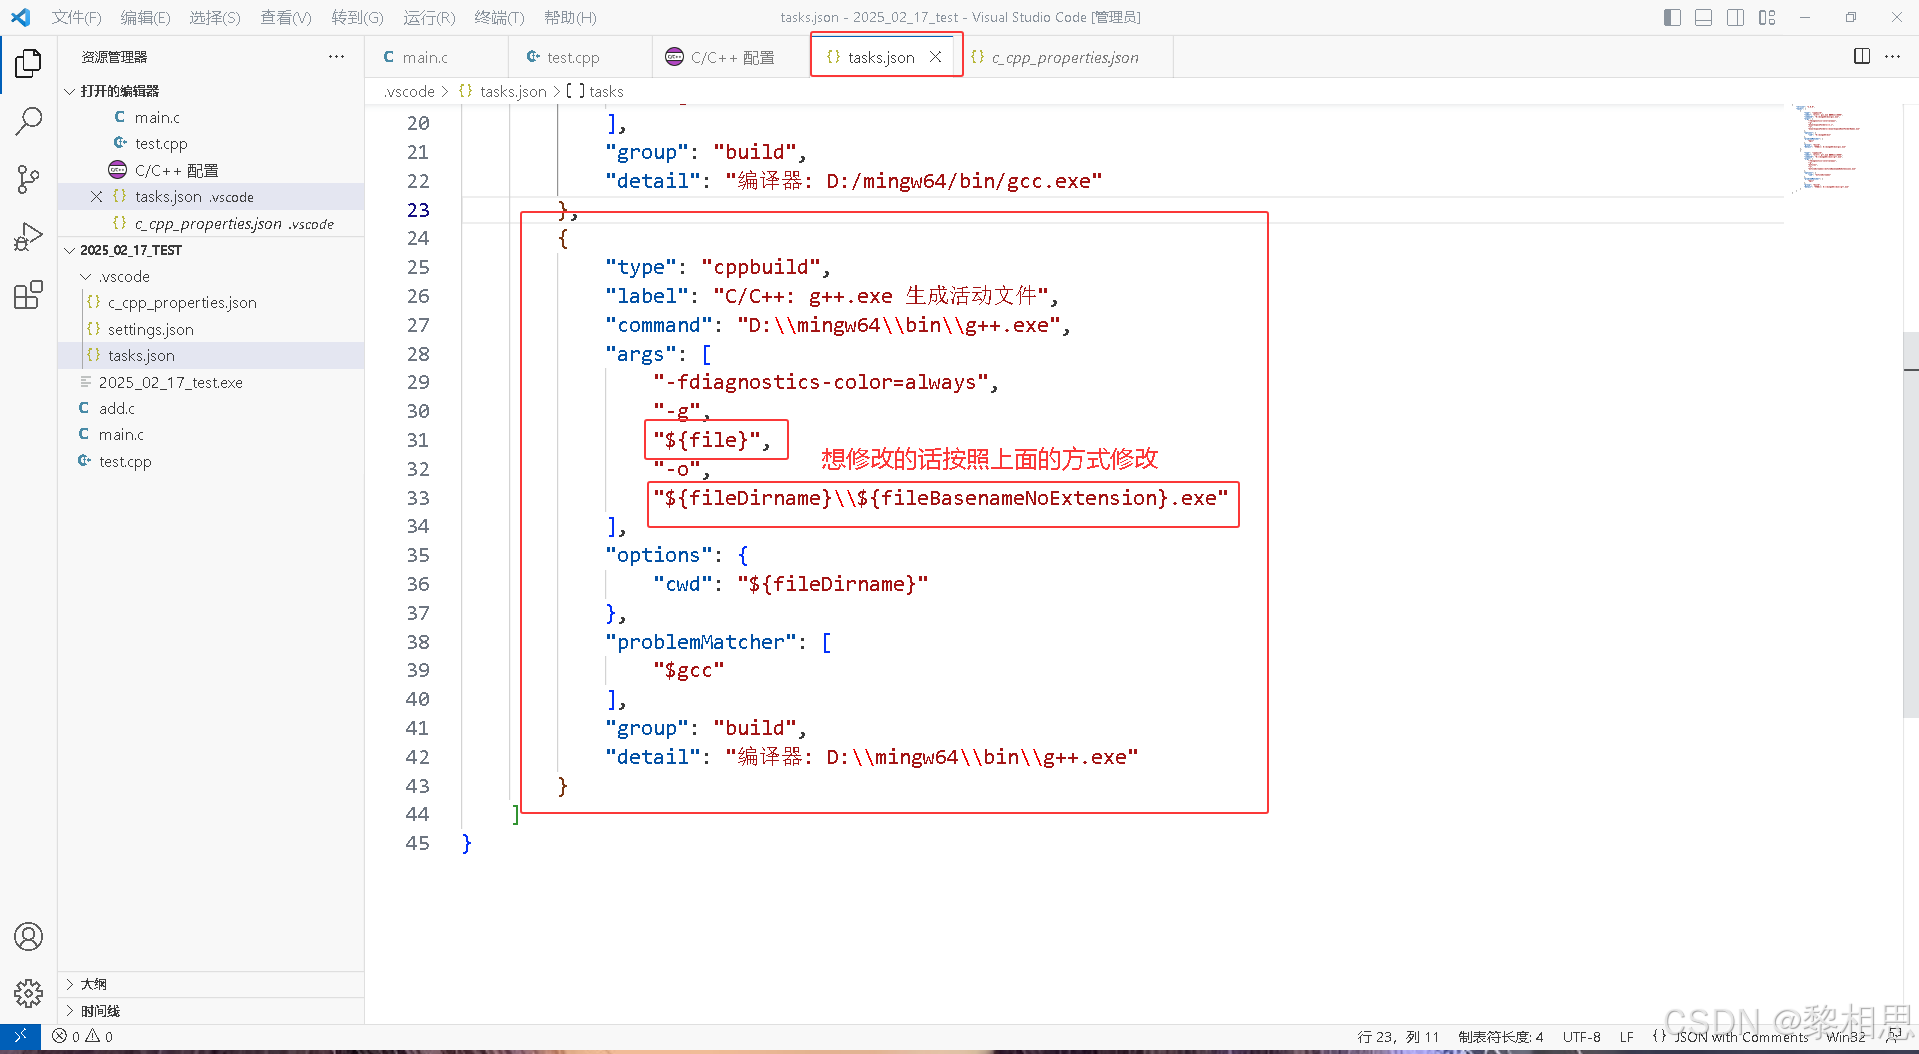
这个时候如果想修改的话前面也写了,按照前面的修改即可,默认也行。
5.4 编译 + 执行
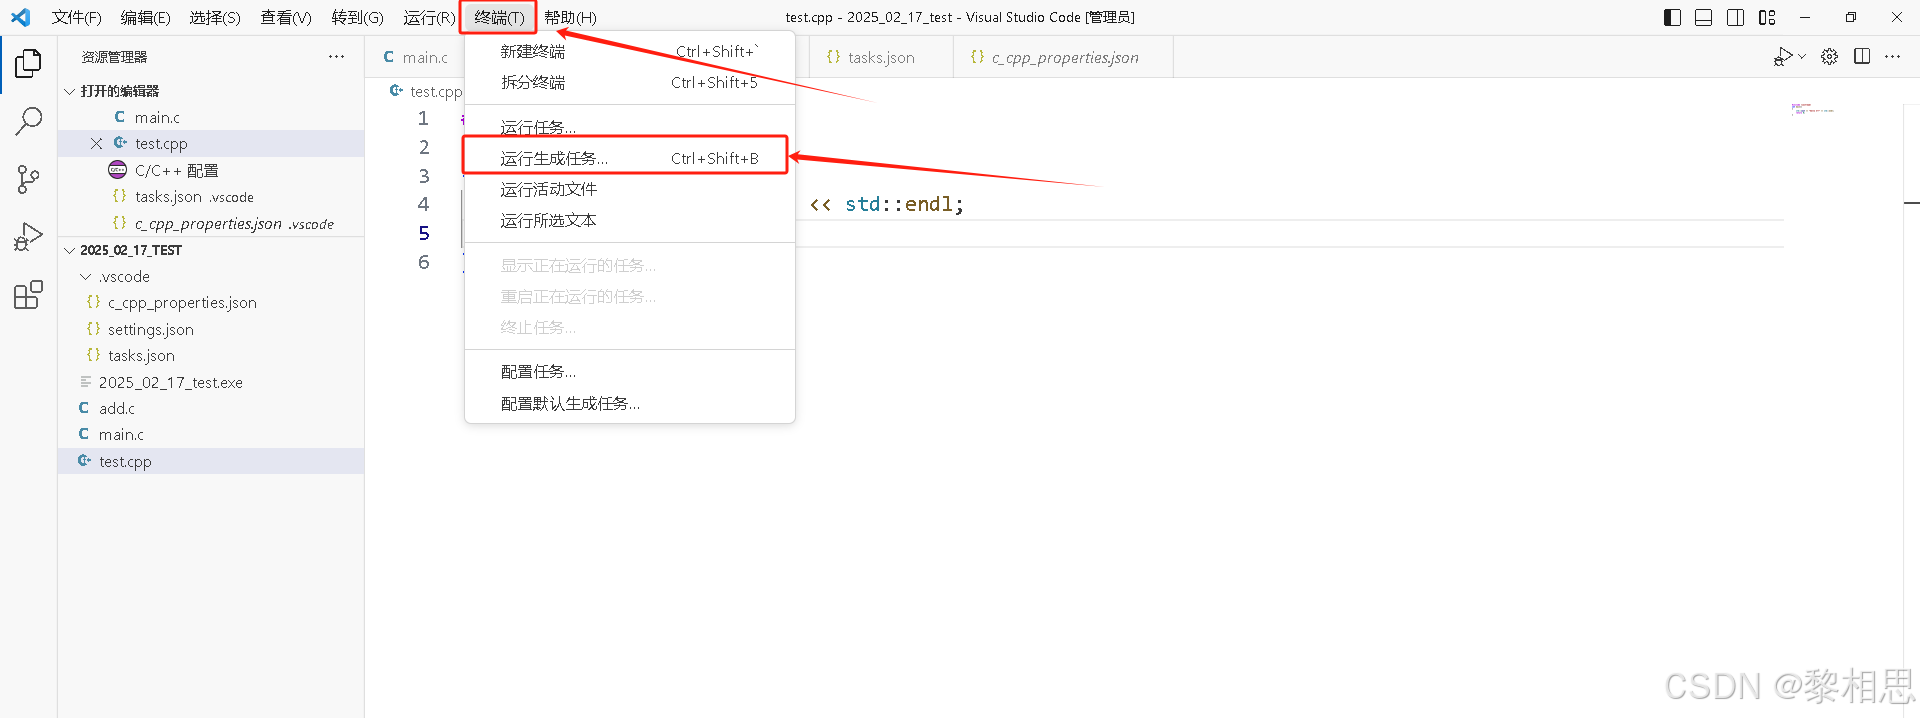
在弹出的框中选择g++
然后运行
6. VSCode的调试
前面的都是如何去编译代码,当我们生成一个可执行程序的时候,如果遇到运行时问题,我们就要想办法调试代码,那么VSCode如何调式代码呢?
其实在VSCode上调试关键也是依赖一个配置文件叫:launch.json。
6.1 创建launch.json文件
首先点击调试,创建launch.json文件,然后选择【C++(GDB/LLDB)】
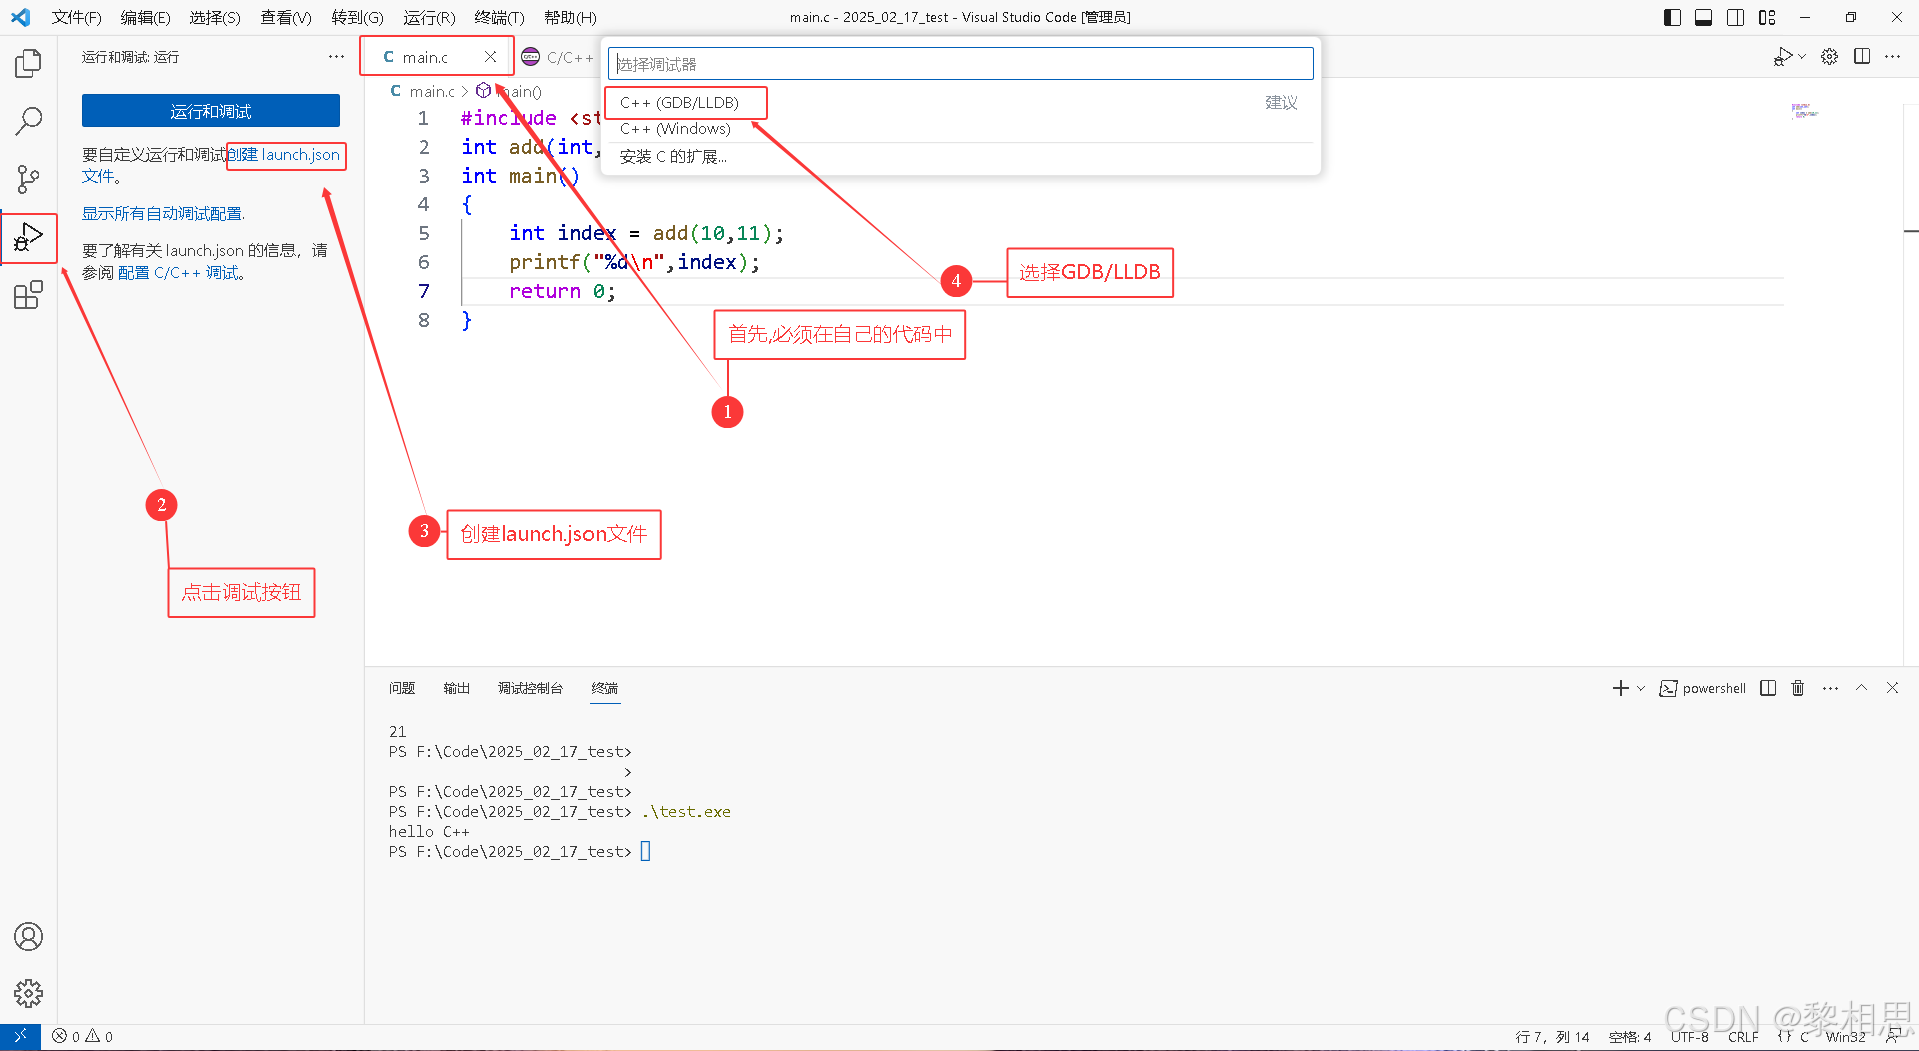
添加配置
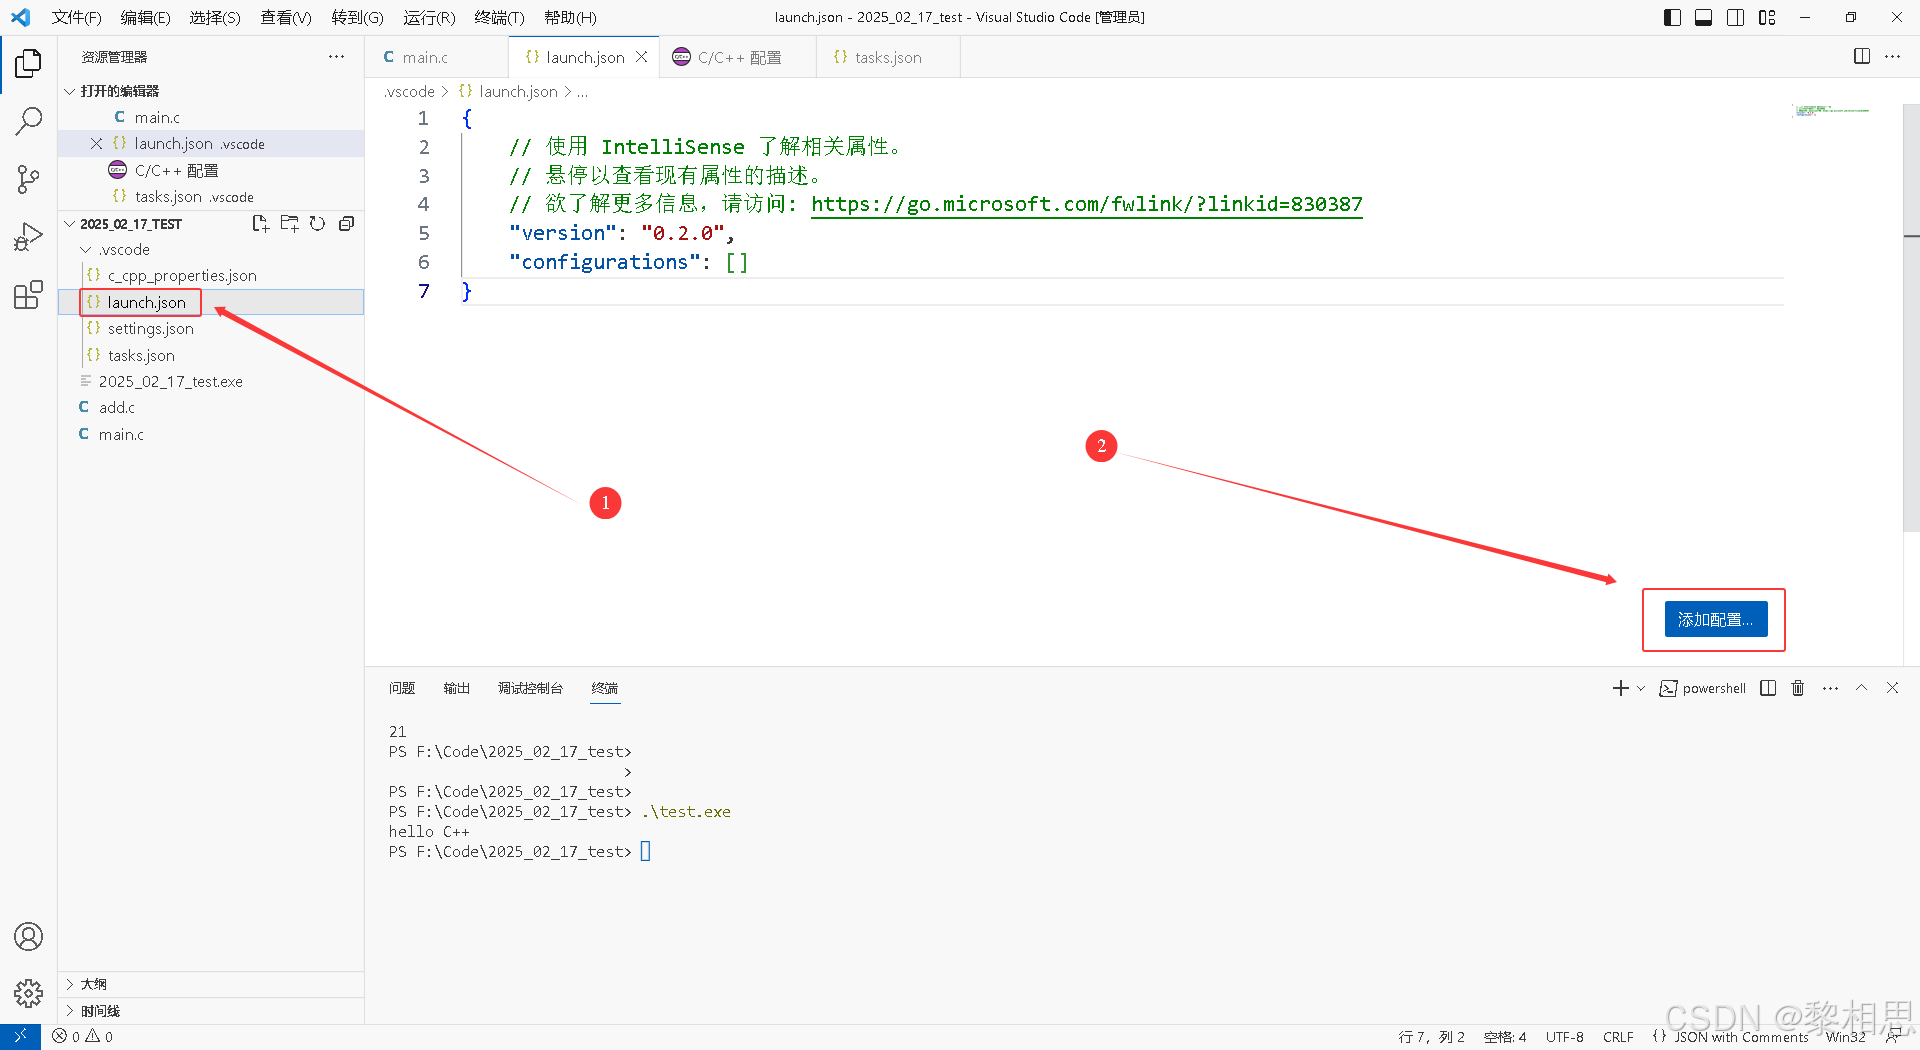
选择C/C++ gdb启动
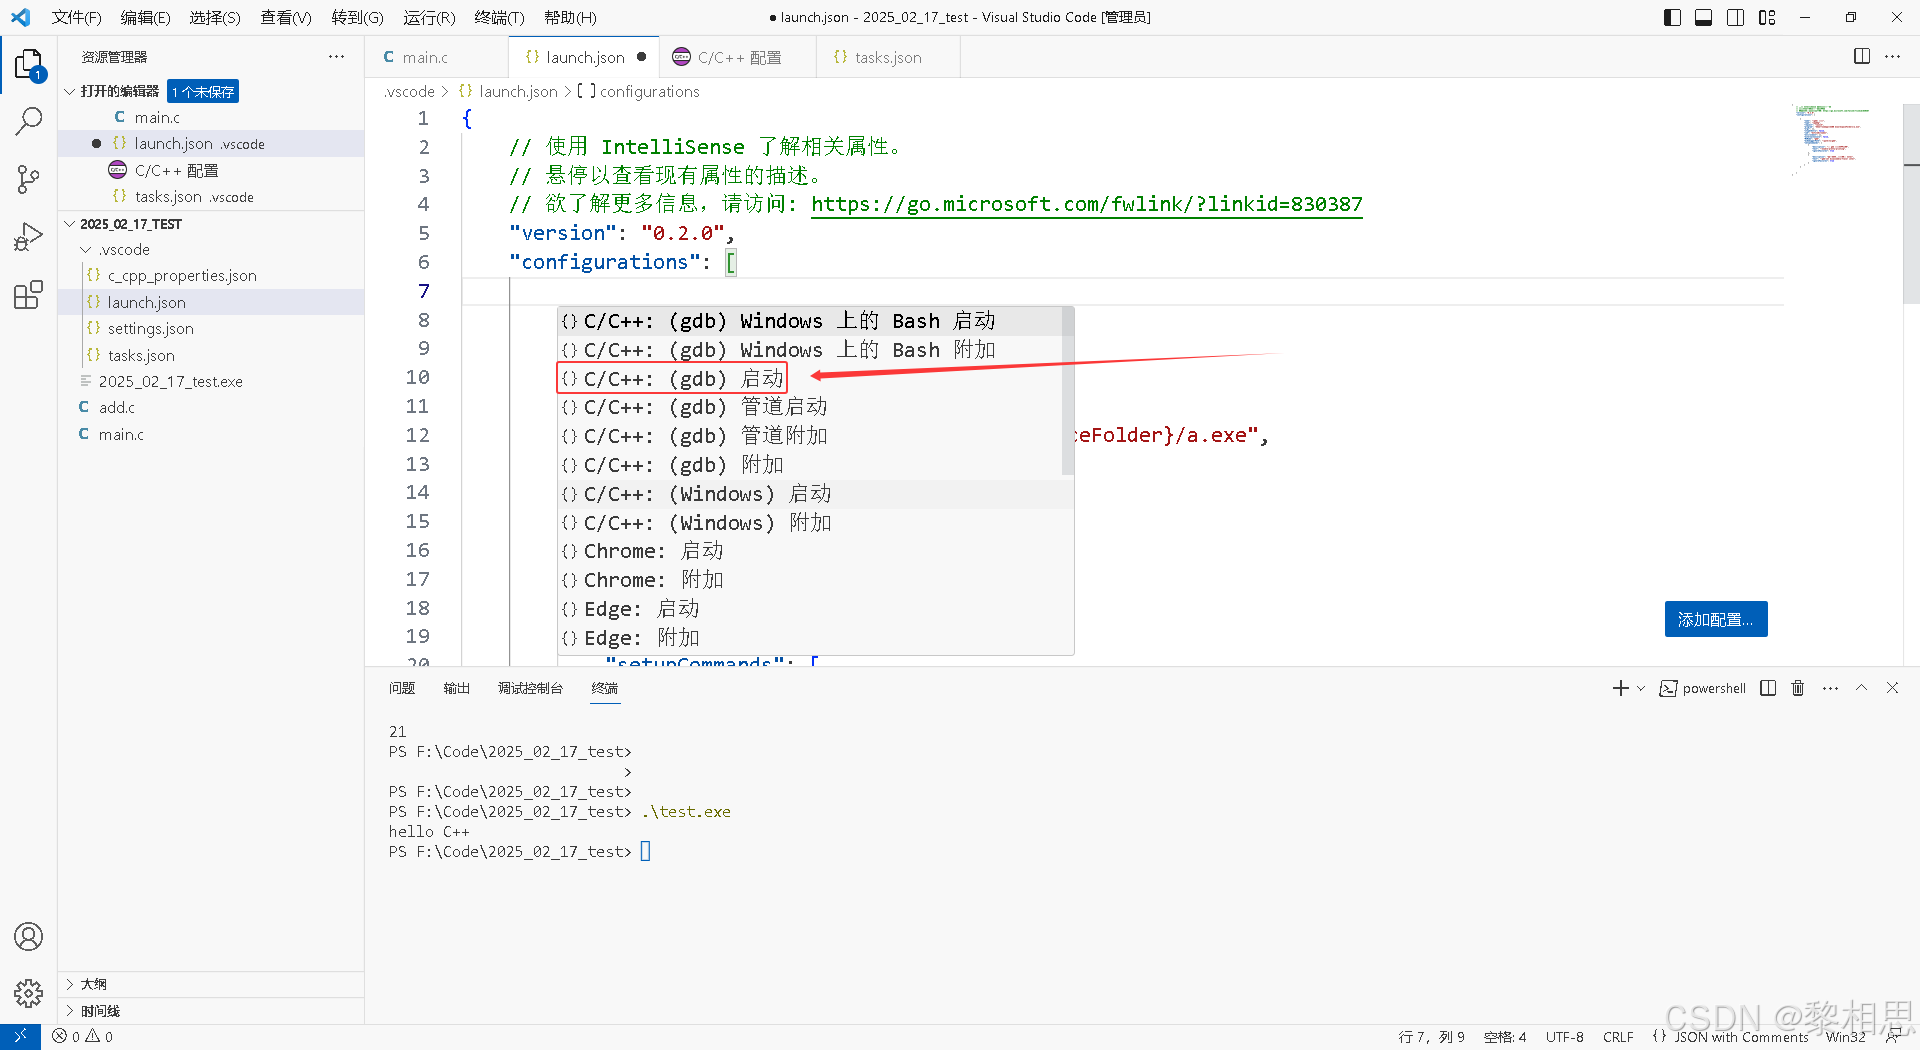
6.2 修改配置文件
- 修改"program"为:"${workspaceFolder}\\${workspaceRootFolderName}.exe" ,这个内容和tasks.json中的可执行文件的路径匹配。
- 修改"miDebuggerPath"为:"D:\\mingw64\\bin\\gdb.exe",这个路径根据自己实际方MinGW-w64的文件路径调整。(图片中的program有问题,参考这段文字中的配置)
6.3 开始调试
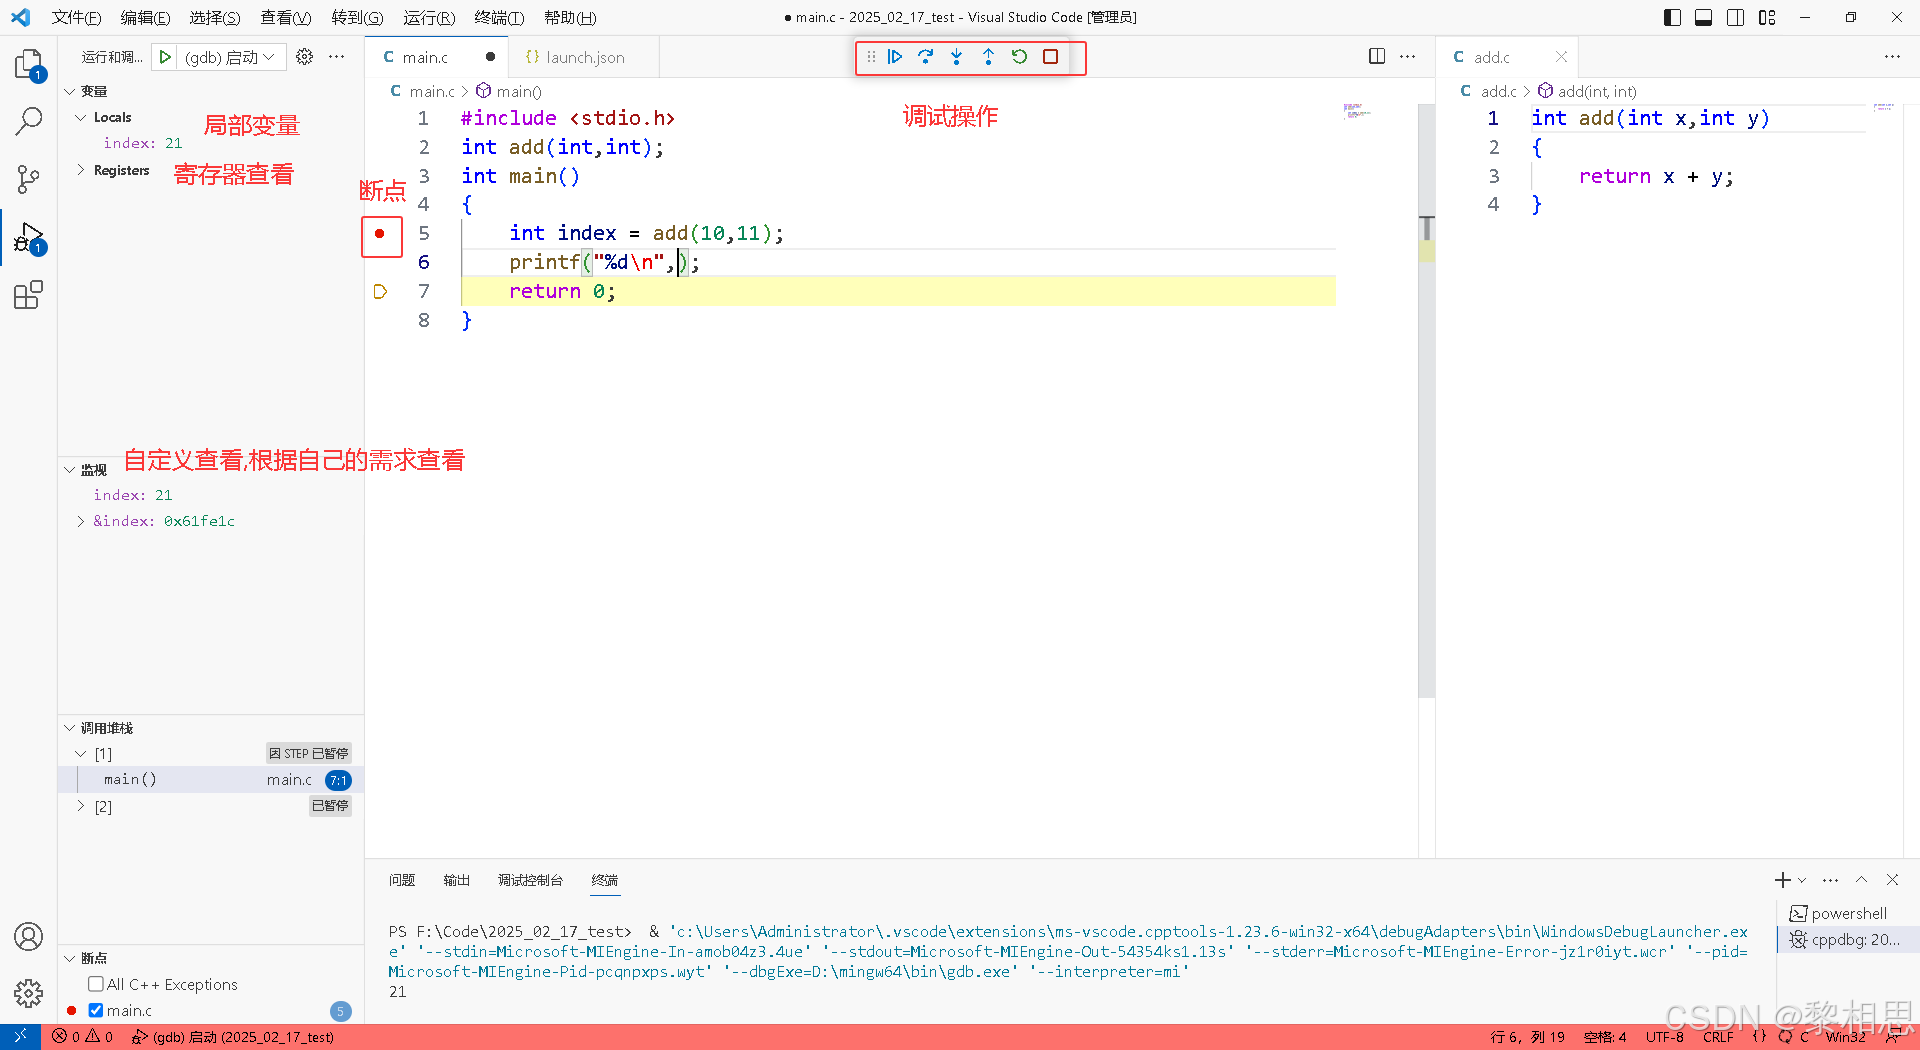
当launch.json文件生成后,我们只要打断点开始调试就行。
调试的快捷键和VS系列的IDE是一样的,如:
- F9 -- 打断点/取消断点
- F5 -- 启动调试
- F11 -- 逐语句调试
- F10 -- 逐过程调试
启动调试后,也是可以使用监视窗口查看变量等程序执行过程中的信息。


![低代码与开发框架的一些整合[2]](https://i-blog.csdnimg.cn/direct/dc71c5ede23743abbf5ffebdce6b5050.png)
![帆软报表FineReport入门:简单报表制作[扩展|左父格|上父格]](https://i-blog.csdnimg.cn/direct/3de47fd5dc5a49acb7ab2f5479369e57.png)


