返回:OpenCV系列文章目录(持续更新中......)
上一篇:OpenCV的周期性噪声去除滤波器(70)
下一篇 :OpenCV系列文章目录(持续更新中......)

目录
目标
代码:
解释:
如何使用 GDAL 读取栅格数据
注意
通常应避免使用经度/纬度(地理)坐标
查找拐角坐标
结果
地理空间栅格数据是地理信息系统和摄影测量中大量使用的产品。栅格数据通常可以表示影像和数字高程模型 (DEM)。用于加载 GIS 影像的标准库是地理数据抽象库 (GDAL)。在此示例中,我们将展示使用本机 OpenCV 函数加载 GIS 栅格格式的技术。此外,我们将展示一些示例,说明OpenCV如何将这些数据用于新颖有趣的目的。
目标
本教程的主要目标:
- 如何使用 OpenCV imread 加载卫星图像。
- 如何使用 OpenCV imread 加载 SRTM 数字高程模型
- 给定图像和 DEM 的角坐标,将高程数据与图像相关联,以查找每个像素的高程。
- 显示一个基本、易于实施的地形热图示例。
- 显示 DEM 数据与正射校正影像的基本用法。
为了实现这些目标,以下代码采用数字高程模型以及旧金山的 GeoTiff 图像作为输入。对影像和 DEM 数据进行处理并生成影像的地形热图,并标注在海湾水位上升 10、50 和 100 米时将受到影响的城市区域。
代码如下:
/** gdal_image.cpp -- Load GIS data into OpenCV Containers using the Geospatial Data Abstraction Library
*/// OpenCV Headers
#include "opencv2/core.hpp"
#include "opencv2/imgproc.hpp"
#include "opencv2/highgui.hpp"// C++ Standard Libraries
#include <cmath>
#include <iostream>
#include <stdexcept>
#include <vector>using namespace std;// define the corner points
// Note that GDAL library can natively determine this
cv::Point2d tl( -122.441017, 37.815664 );
cv::Point2d tr( -122.370919, 37.815311 );
cv::Point2d bl( -122.441533, 37.747167 );
cv::Point2d br( -122.3715, 37.746814 );// determine dem corners
cv::Point2d dem_bl( -122.0, 38);
cv::Point2d dem_tr( -123.0, 37);// range of the heat map colors
std::vector<std::pair<cv::Vec3b,double> > color_range;// List of all function prototypes
cv::Point2d lerp( const cv::Point2d&, const cv::Point2d&, const double& );cv::Vec3b get_dem_color( const double& );cv::Point2d world2dem( const cv::Point2d&, const cv::Size&);cv::Point2d pixel2world( const int&, const int&, const cv::Size& );void add_color( cv::Vec3b& pix, const uchar& b, const uchar& g, const uchar& r );/** Linear Interpolation* p1 - Point 1* p2 - Point 2* t - Ratio from Point 1 to Point 2
*/
cv::Point2d lerp( cv::Point2d const& p1, cv::Point2d const& p2, const double& t ){return cv::Point2d( ((1-t)*p1.x) + (t*p2.x),((1-t)*p1.y) + (t*p2.y));
}/** Interpolate Colors
*/
template <typename DATATYPE, int N>
cv::Vec<DATATYPE,N> lerp( cv::Vec<DATATYPE,N> const& minColor,cv::Vec<DATATYPE,N> const& maxColor,double const& t ){cv::Vec<DATATYPE,N> output;for( int i=0; i<N; i++ ){output[i] = (uchar)(((1-t)*minColor[i]) + (t * maxColor[i]));}return output;
}/** Compute the dem color
*/
cv::Vec3b get_dem_color( const double& elevation ){// if the elevation is below the minimum, return the minimumif( elevation < color_range[0].second ){return color_range[0].first;}// if the elevation is above the maximum, return the maximumif( elevation > color_range.back().second ){return color_range.back().first;}// otherwise, find the proper starting indexint idx=0;double t = 0;for( int x=0; x<(int)(color_range.size()-1); x++ ){// if the current elevation is below the next item, then use the current// two colors as our rangeif( elevation < color_range[x+1].second ){idx=x;t = (color_range[x+1].second - elevation)/(color_range[x+1].second - color_range[x].second);break;}}// interpolate the colorreturn lerp( color_range[idx].first, color_range[idx+1].first, t);
}/** Given a pixel coordinate and the size of the input image, compute the pixel location* on the DEM image.
*/
cv::Point2d world2dem( cv::Point2d const& coordinate, const cv::Size& dem_size ){// relate this to the dem points// ASSUMING THAT DEM DATA IS ORTHORECTIFIEDdouble demRatioX = ((dem_tr.x - coordinate.x)/(dem_tr.x - dem_bl.x));double demRatioY = 1-((dem_tr.y - coordinate.y)/(dem_tr.y - dem_bl.y));cv::Point2d output;output.x = demRatioX * dem_size.width;output.y = demRatioY * dem_size.height;return output;
}/** Convert a pixel coordinate to world coordinates
*/
cv::Point2d pixel2world( const int& x, const int& y, const cv::Size& size ){// compute the ratio of the pixel location to its dimensiondouble rx = (double)x / size.width;double ry = (double)y / size.height;// compute LERP of each coordinatecv::Point2d rightSide = lerp(tr, br, ry);cv::Point2d leftSide = lerp(tl, bl, ry);// compute the actual Lat/Lon coordinate of the interpolated coordinatereturn lerp( leftSide, rightSide, rx );
}/** Add color to a specific pixel color value
*/
void add_color( cv::Vec3b& pix, const uchar& b, const uchar& g, const uchar& r ){if( pix[0] + b < 255 && pix[0] + b >= 0 ){ pix[0] += b; }if( pix[1] + g < 255 && pix[1] + g >= 0 ){ pix[1] += g; }if( pix[2] + r < 255 && pix[2] + r >= 0 ){ pix[2] += r; }
}/** Main Function
*/
int main( int argc, char* argv[] ){/** Check input arguments*/if( argc < 3 ){cout << "usage: " << argv[0] << " <image_name> <dem_model_name>" << endl;return -1;}// load the image (note that we don't have the projection information. You will// need to load that yourself or use the full GDAL driver. The values are pre-defined// at the top of this filecv::Mat image = cv::imread(argv[1], cv::IMREAD_LOAD_GDAL | cv::IMREAD_COLOR );// load the dem modelcv::Mat dem = cv::imread(argv[2], cv::IMREAD_LOAD_GDAL | cv::IMREAD_ANYDEPTH );// create our output productscv::Mat output_dem( image.size(), CV_8UC3 );cv::Mat output_dem_flood( image.size(), CV_8UC3 );// for sanity sake, make sure GDAL Loads it as a signed shortif( dem.type() != CV_16SC1 ){ throw std::runtime_error("DEM image type must be CV_16SC1"); }// define the color range to create our output DEM heat map// Pair format ( Color, elevation ); Push from low to high// Note: This would be perfect for a configuration file, but is here for a working demo.color_range.push_back( std::pair<cv::Vec3b,double>(cv::Vec3b( 188, 154, 46), -1));color_range.push_back( std::pair<cv::Vec3b,double>(cv::Vec3b( 110, 220, 110), 0.25));color_range.push_back( std::pair<cv::Vec3b,double>(cv::Vec3b( 150, 250, 230), 20));color_range.push_back( std::pair<cv::Vec3b,double>(cv::Vec3b( 160, 220, 200), 75));color_range.push_back( std::pair<cv::Vec3b,double>(cv::Vec3b( 220, 190, 170), 100));color_range.push_back( std::pair<cv::Vec3b,double>(cv::Vec3b( 250, 180, 140), 200));// define a minimum elevationdouble minElevation = -10;// iterate over each pixel in the image, computing the dem pointfor( int y=0; y<image.rows; y++ ){for( int x=0; x<image.cols; x++ ){// convert the pixel coordinate to lat/lon coordinatescv::Point2d coordinate = pixel2world( x, y, image.size() );// compute the dem image pixel coordinate from lat/loncv::Point2d dem_coordinate = world2dem( coordinate, dem.size() );// extract the elevationdouble dz;if( dem_coordinate.x >= 0 && dem_coordinate.y >= 0 &&dem_coordinate.x < dem.cols && dem_coordinate.y < dem.rows ){dz = dem.at<short>(dem_coordinate);}else{dz = minElevation;}// write the pixel value to the fileoutput_dem_flood.at<cv::Vec3b>(y,x) = image.at<cv::Vec3b>(y,x);// compute the color for the heat map outputcv::Vec3b actualColor = get_dem_color(dz);output_dem.at<cv::Vec3b>(y,x) = actualColor;// show effect of a 10 meter increase in ocean levelsif( dz < 10 ){add_color( output_dem_flood.at<cv::Vec3b>(y,x), 90, 0, 0 );}// show effect of a 50 meter increase in ocean levelselse if( dz < 50 ){add_color( output_dem_flood.at<cv::Vec3b>(y,x), 0, 90, 0 );}// show effect of a 100 meter increase in ocean levelselse if( dz < 100 ){add_color( output_dem_flood.at<cv::Vec3b>(y,x), 0, 0, 90 );}}}// print our heat mapcv::imwrite( "heat-map.jpg" , output_dem );// print the flooding effect imagecv::imwrite( "flooded.jpg", output_dem_flood);return 0;
}
解释:
在提供的代码片段中,有几个关键函数,它们负责执行特定的任务,如插值、颜色映射和坐标转换。下面是每个关键函数的代码片段和详细解释:
1. **线性插值函数 `lerp`**
cv::Point2d lerp(cv::Point2d const& p1, cv::Point2d const& p2, const double& t){return cv::Point2d(((1 - t) * p1.x) + (t * p2.x), ((1 - t) * p1.y) + (t * p2.y));
}
这个函数执行二维空间中的线性插值。它接受两个点 `p1` 和 `p2`,以及一个插值比率 `t`。当 `t` 从 0 变到 1 时,这个函数会生成从 `p1` 到 `p2` 的一系列点。
2. **颜色插值模板函数 `lerp`**
template <typename DATATYPE, int N>
cv::Vec<DATATYPE,N> lerp(cv::Vec<DATATYPE,N> const& minColor,cv::Vec<DATATYPE,N> const& maxColor,double const& t){cv::Vec<DATATYPE,N> output;for(int i = 0; i < N; i++){output[i] = static_cast<uchar>(((1 - t) * minColor[i]) + (t * maxColor[i]));}return output;
}
这是一个模板函数,用于在两种颜色之间进行插值。它接受两种颜色 `minColor` 和 `maxColor`,以及插值比率 `t`。对于颜色中的每个通道(对于 `cv::Vec3b` 是三个通道),它计算插值后的颜色值。
3. **计算 DEM 颜色 `get_dem_color`**
cv::Vec3b get_dem_color(const double& elevation){// ... 省略了检查颜色范围和插值的代码 ...return lerp(color_range[idx].first, color_range[idx+1].first, t);
}
这个函数根据给定的海拔高度 `elevation` 从预定义的颜色范围内获取对应的颜色。它首先检查海拔高度是否在颜色范围的边界之外,然后找到合适的颜色对进行插值计算。
4. **坐标转换函数 `world2dem`**
cv::Point2d world2dem(const cv::Point2d& coordinate, const cv::Size& dem_size){// ... 省略了计算比例和输出点坐标的代码 ...return output;
}
此函数将世界坐标转换为 DEM 图像的像素坐标。它接受一个世界坐标 `coordinate` 和 DEM 图像的尺寸 `dem_size`,然后计算对应的像素坐标。
5. **坐标转换函数 `pixel2world`**
cv::Point2d pixel2world(const int& x, const int& y, const cv::Size& size){// ... 省略了计算比例和插值坐标的代码 ...return lerp(leftSide, rightSide, rx);
}
这个函数将像素坐标转换为世界坐标。它接受一个像素坐标 `(x, y)` 和图像的尺寸 `size`,然后计算出对应的世界坐标。
6. **添加颜色到像素 `add_color`**
void add_color(cv::Vec3b& pix, const uchar& b, const uchar& g, const uchar& r){// ... 省略了颜色添加的代码 ...
}
此函数将特定的颜色值(蓝、绿、红通道)添加到像素中。它确保添加的颜色值不会超过 255(因为颜色值是以 0 到 255 的整数表示的)。
7. **主函数 `main`**
int main(int argc, char* argv[]){// ... 省略了加载图像、DEM 数据和颜色范围设置的代码 ...for(int y = 0; y < image.rows; y++){for(int x = 0; x < image.cols; x++){// ... 省略了像素处理的代码 ...}}// ... 省略了保存图像的代码 ...return 0;
}
`main` 函数是程序的入口点。它首先检查命令行参数,然后加载所需的图像和 DEM 数据。接着,它通过两个嵌套循环遍历图像的每个像素,使用上述函数来计算世界坐标、DEM 坐标、海拔高度和颜色,并根据这些信息生成热图和洪水效果图像。
这些函数共同工作,实现了一个地理空间数据可视化的程序,它可以根据 DEM 数据生成热图,并且模拟不同海拔高度下的洪水效果。
如何使用 GDAL 读取栅格数据
此演示使用默认的 OpenCV imread 函数。主要区别在于,为了强制 GDAL 加载映像,您必须使用适当的标志。
cv::Mat image = cv::imread(argv[1], cv::IMREAD_LOAD_GDAL | cv::IMREAD_COLOR );加载数字高程模型时,每个像素的实际数值是必不可少的,不能缩放或截断。例如,对于图像数据,表示为值为 1 的双精度值的像素与表示为值为 255 的无符号字符的像素具有相同的外观。对于地形数据,像素值表示以米为单位的高程。为了确保 OpenCV 保留本机值,请在 imread 中使用 GDAL 标志和 ANYDEPTH 标志。
// load the dem modelcv::Mat dem = cv::imread(argv[2], cv::IMREAD_LOAD_GDAL | cv::IMREAD_ANYDEPTH );如果您事先知道要加载的 DEM 模型的类型,那么使用断言或其他机制测试 Mat::type() 或 Mat::d epth() 可能是一个安全的选择。NASA 或 DOD 规范文档可以提供各种高程模型的输入类型。主要类型,SRTM 和 DTED,都是签名短裤。
注意
通常应避免使用经度/纬度(地理)坐标
地理坐标系是一个球面坐标系,这意味着将它们与笛卡尔数学一起使用在技术上是不正确的。此演示使用它们来增加可读性,并且足够准确以说明重点。更好的坐标系是通用横轴墨卡托坐标系。
查找拐角坐标
查找图像角坐标的一种简单方法是使用命令行工具 gdalinfo。对于正射校正且包含投影信息的影像,可以使用 USGS EarthExplorer。
\f$> gdalinfo N37W123.hgtDriver: SRTMHGT/SRTMHGT File FormatFiles: N37W123.hgtSize is 3601, 3601Coordinate System is:GEOGCS["WGS 84",DATUM["WGS_1984",... more output ...Corner Coordinates:Upper Left (-123.0001389, 38.0001389) (123d 0' 0.50"W, 38d 0' 0.50"N)Lower Left (-123.0001389, 36.9998611) (123d 0' 0.50"W, 36d59'59.50"N)Upper Right (-121.9998611, 38.0001389) (121d59'59.50"W, 38d 0' 0.50"N)Lower Right (-121.9998611, 36.9998611) (121d59'59.50"W, 36d59'59.50"N)Center (-122.5000000, 37.5000000) (122d30' 0.00"W, 37d30' 0.00"N)... more output ...结果
以下是程序的输出。使用第一个图像作为输入。对于 DEM 模型,请在此处下载位于 USGS 的 SRTM 文件。
http://dds.cr.usgs.gov/srtm/version2_1/SRTM1/Region_04/N37W123.hgt.zip
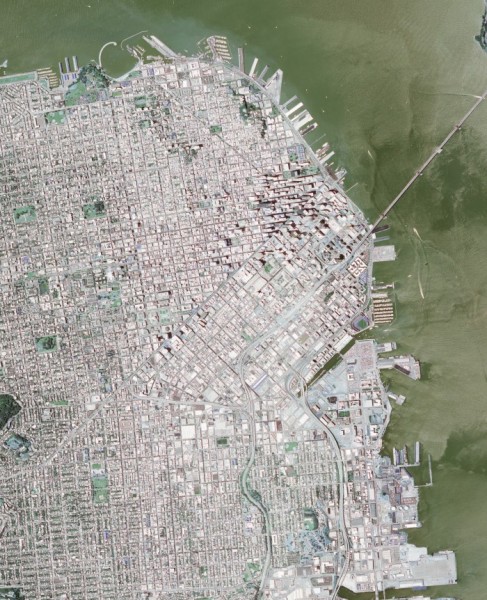
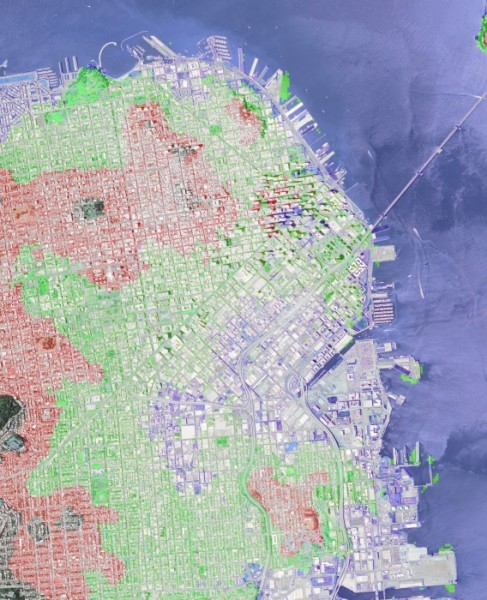
输入图像
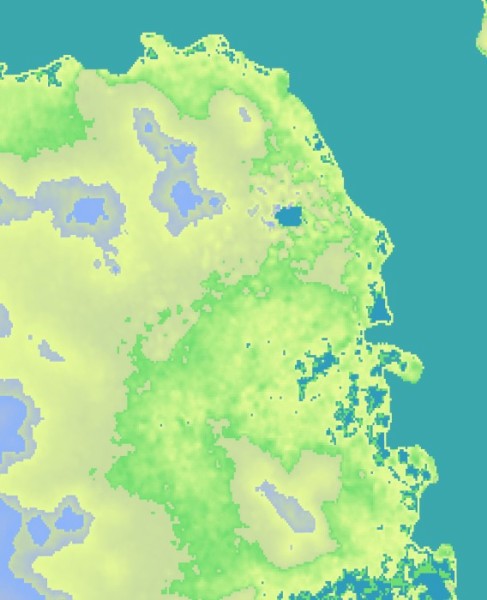
热图
热图叠加
参考文献:
1、《Reading Geospatial Raster files with GDAL》-----Marvin Smith