Title
题目
Patient Characteristics Impact Performance of AI Algorithm in Interpreting Negative Screening Digital Breast Tomosynthesis Studies
患者特征对AI算法在解释阴性筛查数字乳腺断层摄影研究中的表现的影响
Background
背景
Artificial intelligence (AI) is increasingly used to manage radiologists’ workloads. The impact of patient characteristics on AI performance has not been well studied.
人工智能 (AI) 正在越来越多地用于管理放射科医生的工作量。患者特征对 AI 性能的影响尚未得到充分研究。
Method
方法
This retrospective cohort study identified negative screening DBT examinations from an academic institution from January 1, 2016, to December 31, 2019. All examinations had 2 years of follow-up without a diagnosis of atypia or breast malignancy and were therefore considered true negatives. A subset of unique patients was randomly selected to provide a broad distribution of race and ethnicity. DBT studies in this final cohort were interpreted by a U.S. Food and Drug Administration–approved AI algorithm, which generated case scores (malignancy certainty) and risk scores (1-year subsequent malignancy risk) for each mammogram. Positive examinations were classified based on vendor-provided thresholds for both scores. Multivariable logistic regression was used to understand relationships between the scores and patient characteristics.
这项回顾性队列研究从一家学术机构中筛选了2016年1月1日至2019年12月31日期间的阴性筛查数字乳腺断层摄影(DBT)检查。所有检查在随后的两年内没有出现非典型增生或乳腺恶性肿瘤的诊断,因此被视为真实的阴性。随机选择了一部分独特患者,以提供广泛的种族和民族分布。在这一最终队列中的DBT研究由美国食品和药物管理局(FDA)批准的AI算法解释,该算法为每张乳腺X光片生成病例评分(恶性确定性)和风险评分(1年后恶性风险)。基于供应商提供的阈值对阳性检查进行分类。使用多变量逻辑回归来了解评分与患者特征之间的关系。
Conclusion
结论
Patient characteristics influenced the case and risk scores of a Food and Drug Administration–approved AI algorithm analyzing negative screening DBT examinations.
患者特征影响了美国食品和药物管理局(FDA)批准的AI算法在分析阴性筛查数字乳腺断层摄影(DBT)检查时的病例评分和风险评分。
Results
结果
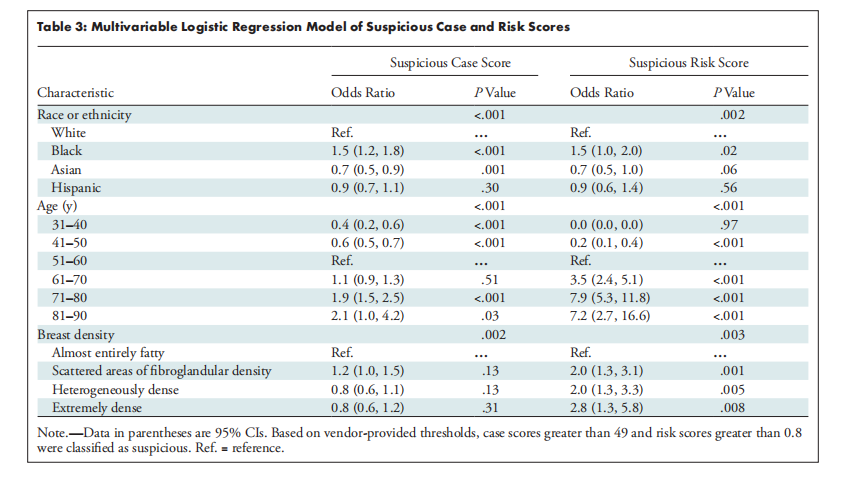
A total of 4855 patients (median age, 54 years [IQR, 46–63 years]) were included: 27% (1316 of 4855) White, 26% (1261 of 4855) Black, 28% (1351 of 4855) Asian, and 19% (927 of 4855) Hispanic patients. False-positive case scores were significantly more likely in Black patients (odds ratio [OR] = 1.5 [95% CI: 1.2, 1.8]) and less likely in Asian patients (OR = 0.7 [95% CI: 0.5, 0.9]) compared with White patients, and more likely in older patients (71–80 years; OR = 1.9 [95% CI: 1.5, 2.5]) and less likely in younger patients (41–50 years; OR = 0.6 [95% CI: 0.5, 0.7]) compared with patients aged 51–60 years. False-positive risk scores were more likely in Black patients (OR = 1.5 [95% CI: 1.0, 2.0]), patients aged 61–70 years (OR = 3.5 [95% CI: 2.4, 5.1]), and patients with extremely dense breasts (OR = 2.8 [95% CI: 1.3, 5.8]) compared with White patients, patients aged 51–60 years, and patients with fatty density breasts, respectively.
共纳入4855名患者(中位年龄54岁[IQR:46-63岁]):其中白人占27%(4855人中的1316人),黑人占26%(4855人中的1261人),亚洲人占28%(4855人中的1351人),西班牙裔占19%(4855人中的927人)。与白人患者相比,黑人患者出现假阳性病例评分的可能性显著更高(比值比[OR] = 1.5 [95% CI:1.2,1.8]),而亚洲患者的可能性显著更低(OR = 0.7 [95% CI:0.5,0.9])。与51-60岁的患者相比,年长患者(71-80岁)的假阳性病例评分可能性更高(OR = 1.9 [95% CI:1.5,2.5]),而年轻患者(41-50岁)的可能性更低(OR = 0.6 [95% CI:0.5,0.7])。假阳性风险评分在黑人患者(OR = 1.5 [95% CI:1.0,2.0])、61-70岁患者(OR = 3.5 [95% CI:2.4,5.1])以及乳腺极度致密的患者中(OR = 2.8 [95% CI:1.3,5.8])更可能发生,分别与白人患者、51-60岁患者和脂肪密度乳腺患者相比。
Figure
图

Figure 1: Patient flowchart. DBT = digital breast tomosynthesis.
图1:患者流程图。DBT = 数字乳腺断层摄影。

Figure 2: Example mammogram assigned a false-positive case score of 96 in a 59-year-old Black patient with scattered fibroglandular breast density. (A) Left craniocaudal and (B) mediolateral oblique views demonstrate vascular calcifications in the upper outer quadrant at middle depth (box) that were singularly identified by the artificial intelligence algorithm as a suspicious finding and assigned an individual lesion score of 90. This resulted in an overall case score assigned to the mammogram of 96.
图2:在59岁黑人患者的乳腺X光片中,被分配了假阳性病例评分96,患者乳腺呈散在纤维腺体密度。(A)左侧头尾位和(B)斜侧位显示上外象限中深处的血管钙化(方框内),被人工智能算法单独识别为可疑发现,并分配了个体病灶评分90。这导致该乳腺X光片的总体病例评分为96。

Figure 3: Graphs show final patient cohort distribution of (A) case and (B) risk scores assigned by the commercially available artificial intelligence algorithm. For each race and ethnicity group, the histogram on the left represents the number of examinations, and on the right is a visual distribution of the number of examinations. The dashed line indicates the vendorprovided threshold above which an examination was defined as positive.
图3:图表显示了由商业人工智能算法分配的最终患者队列的(A)病例评分和(B)风险评分分布。对于每个种族和民族群体,左侧的直方图表示检查数量,右侧是检查数量的可视化分布。虚线表示供应商提供的阈值,超过该阈值的检查被定义为阳性。

Figure 4: Example mammogram assigned a false-positive risk score of 1.0 in a 59-year-old Hispanic patient with heterogeneously dense breasts. Bilateral reconstructed two-dimensional(A, B) craniocaudal and (C, D) mediolateral oblique views are shown. The algorithm predicted cancer within 1 year, but this individual did not develop cancer or atypia within 2 years of the mammogram.
图4:59岁西班牙裔患者的乳腺X光片,被分配了假阳性风险评分1.0,患者乳腺呈异质性致密。显示了双侧重建的二维(A,B)头尾位和(C,D)斜侧位。算法预测该患者将在一年内患癌,但该患者在乳腺X光片检查后的两年内并未出现癌症或非典型增生。
Table
表

Table 1: Patient Characteristics and Artificial Intelligence Algorithm Scores
表1:患者特征和人工智能算法评分

Table 2: Case and Risk Scores by Race and Ethnicity, Age, and Breast Density
表2:按种族和民族、年龄及乳腺密度划分的病例评分和风险评分

Table 3: Multivariable Logistic Regression Model of Suspicious Case and Risk Scores
表3:可疑病例评分和风险评分的多变量逻辑回归模型


![面试中的算法 [ 持续更新中 ] 基于Python语言 如何判断链表有环](https://i-blog.csdnimg.cn/direct/361fd81b0d9f402e9945c6c66e796888.png)


