这是我的第363篇原创文章。
一、引言
单站点多变量单步预测问题----基于GRU实现多变量时间序列预测股票价格。
二、实现过程
2.1 读取数据集
df=pd.read_csv("data.csv", parse_dates=["Date"], index_col=[0])
print(df.shape)
print(df.head())
fea_num = len(df.columns)
df:

2.2 划分数据集
# 拆分数据集为训练集和测试集
test_split=round(len(df)*0.20)
df_for_training=df[:-test_split]
df_for_testing=df[-test_split:]# 绘制训练集和测试集的折线图
plt.figure(figsize=(10, 6))
plt.plot(train_data, label='Training Data')
plt.plot(test_data, label='Testing Data')
plt.xlabel('Year')
plt.ylabel('Passenger Count')
plt.title('International Airline Passengers - Training and Testing Data')
plt.legend()
plt.show()
共5203条数据,8:2划分:训练集4162,测试集1041。
训练集和测试集:

2.3 归一化
# 将数据归一化到 0~1 范围
scaler = MinMaxScaler(feature_range=(0,1))
df_for_training_scaled = scaler.fit_transform(df_for_training)
df_for_testing_scaled=scaler.transform(df_for_testing)
2.4 构造LSTM数据集(时序-->监督学习)
def createXY(dataset,n_past):passwindow_size = 3
trainX,trainY=createXY(df_for_training_scaled,window_size)
testX,testY=createXY(df_for_testing_scaled,window_size)# 将数据集转换为 LSTM 模型所需的形状(样本数,时间步长,特征数)
trainX = np.reshape(trainX, (trainX.shape[0], window_size, 5))
testX = np.reshape(testX, (testX.shape[0], window_size, 5))print("trainX Shape-- ",trainX.shape)
print("trainY Shape-- ",trainY.shape)
print("testX Shape-- ",testX.shape)
print("testY Shape-- ",testY.shape)
滑动窗口设置为3:

2.5 建立模拟合模型
my_model = tf.keras.Sequential([GRU(80, return_sequences=True),Dropout(0.2),GRU(100),Dropout(0.2),Dense(1)
])my_model.compile(loss='mse', optimizer='adam', metrics=['accuracy'])
my_model.fit(trainX, trainY)
2.6 进行预测
prediction_test=my_model.predict(testX)
prediction_train=my_model.predict(trainX)
2.7 预测效果展示
plt.plot(df_for_training.index[window_size:,], original_train, color = 'red', label = '真实值')
plt.plot(df_for_training.index[window_size:,], pred_train, color = 'blue', label = '预测值')
plt.title('Stock Price Prediction')
plt.xlabel('Time')
plt.xticks(rotation=45)
plt.ylabel('Stock Price')
plt.legend()
plt.show()
训练集真实值与预测值:

plt.plot(df_for_testing.index[window_size:,], original_test, color = 'red', label = '真实值')
plt.plot(df_for_testing.index[window_size:,], pred_test, color = 'blue', label = '预测值')
plt.title('Stock Price Prediction')
plt.xlabel('Time')
plt.xticks(rotation=45)
plt.ylabel('Stock Price')
plt.legend()
plt.show()
测试集真实值与预测值:

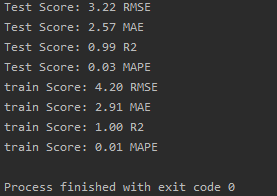
2.8 评估指标

作者简介:
读研期间发表6篇SCI数据挖掘相关论文,现在某研究院从事数据算法相关科研工作,结合自身科研实践经历不定期分享关于Python、机器学习、深度学习、人工智能系列基础知识与应用案例。致力于只做原创,以最简单的方式理解和学习,关注我一起交流成长。需要数据集和源码的小伙伴可以关注底部公众号添加作者微信。


