实验目的
(1)学会运用Matlab 求解离散时间系统的零状态响应;
(2)学会运用Matlab 求解离散时间系统的单位取样响应;
(3)学会运用Matlab 求解离散时间系统的卷积和。
实验原理及实例分析
1. 离散时间系统的响应
【例2-1】已知某LTI系统的差分方程为:
3 y ( n ) − 4 y ( n − 1 ) + 2 y ( n − 2 ) = x ( n ) + 2 x ( n − 1 ) 3y(n)-4y(n-1)+2y(n-2)=x(n)+2x(n-1) 3y(n)−4y(n−1)+2y(n−2)=x(n)+2x(n−1)
试用Matlab命令绘出当激励信号为 x ( n ) = ( 1 2 ) n u ( n ) x(n)=(\frac{1}{2})^n u(n) x(n)=(21)nu(n) 时该系统的零状态响应。
a=[3 -4 2];
b=[1 2];
n=0:30;
x=(1/2).^n;
%%%
% 函数名:filter(b,a,x)
% 功能:计算离散系统的零状态响应
% 格式:filter(b,a,x), 其中a 为响应的系数行向量,b 为激励的系数行向量,x 为激励序列。
y=filter(b,a,x);
%%%
stem(n,y,'filled'),grid on
xlabel('n'),title('系统响应y(n)')

2. 离散时间系统的单位取样响应
系统的单位取样响应定义为系统在 δ ( n ) \delta (n) δ(n) 激励下系统的零状态响应,用 h ( n ) h(n) h(n) 表示。
Matlab 求解单位取样响应可利用函数filter,并将激励设为单位抽样序列。
例如,求解实例2-1 中系统的单位取样响应时,MATLAB 源程序为:
a=[3 -4 2];
b=[1 2];
n=0:30;
x=(n==0);% 产生单位抽样序列
h=filter(b,a,x);
stem(n,h,"fill"),grid on
xlabel('n'),title('系统单位取样响应h(n)')

Matlab另一种求单位取样响应的方法是利用控制系统工具箱提供的函数impz来实现。
a=[3 -4 2];
b=[1 2];
%%%
% 函数名:impz(b,a,N)
% 功能:求离散系统的单位响应并绘出图形
% 格式:其中,a 为响应的系数行向量,b 为激励的系数行向量,参数N通常为正整数,代表计算单位取样响应的样值个数。
impz(b,a,30);
%%%
grid on;
title('系统单位取样响应h(n)');

程序运行结果如图2-3 所示,比较图2-1 和图2-2,不难发现结果相同。
3. 离散时间信号的卷积和运算
【例2-2】利用Matlab 的conv 命令求两个长为4 的矩形序列的卷积和。
即: g ( n ) = [ u ( n ) − u ( n − 4 ) ] ∗ [ u ( n ) − u ( n − 4 ) ] \textrm{g}\left(n\right)=\left\lbrack u\left(n\right)-u\left(n-4\right)\right\rbrack *\left\lbrack u\left(n\right)-u\left(n-4\right)\right\rbrack g(n)=[u(n)−u(n−4)]∗[u(n)−u(n−4)]
x1=ones(1,4);
x2=ones(1,4);
%%%
% 函数名f=conv(f1,f2)
% 功能:求卷积
% 格式:f1,f2 为参与卷积运算的两个序列,f 为卷积的结果,f 的长度为length(f1)+length(f2)-2
g=conv(x1,x2);
%%%
n=0:length(x1)+length(x2)-2;
stem(n,g,'filled'),grid on,xlabel('n')

【例2-3】已知某系统的单位取样响应为 h ( n ) = 0. 8 n [ u ( n ) − u ( n − 8 ) ] h\left(n\right)=0.8^n \left\lbrack u\left(n\right)-u\left(n-8\right)\right\rbrack h(n)=0.8n[u(n)−u(n−8)] ,试求Matlab 求当激励信号为 x ( n ) = u ( n ) − u ( n − 4 ) x\left(n\right)=u\left(n\right)-u\left(n-4\right) x(n)=u(n)−u(n−4) 时,系统的零状态响应。
解:Matlab 中可通过卷积求解零状态响应,即 x ( n ) ∗ h ( n ) x\left(n\right)*h\left(n\right) x(n)∗h(n) 。由题意可知,
描述 h ( n ) h\left(n\right) h(n) 向量的长度至少为 8,描述 x ( n ) x\left(n\right) x(n) 向量的长度至少为 4,因此为了图形
完整美观,我们将 h ( n ) h\left(n\right) h(n) 向量和 x ( n ) x\left(n\right) x(n) 向量加上一些附加的零值。
addpath('.\2024-2025(1)《信号处理实验》资料(请拷贝到u盘中,每次试验带到实验室)\实验中用到的一些函数和音频图像文件');% 定义x(n)向量显示范围(添加了附加的零值)
nx = -1:5;
% 定义h(n)向量显示范围(添加了附加的零值)
nh = -2:10;% 生成单位阶跃序列
x = uDT(nx) - uDT(nx-4);
% 生成h(n)序列
h = 0.8.^nh .* (uDT(nh) - uDT(nh-8));% 计算卷积
y = conv(x, h);% 计算卷积结果的起始点和终点
ny1 = nx(1) + nh(1);
ny2 = nx(end) + nh(end);
ny = ny1:ny2;% 绘制x(n)的图像
subplot(311);
stem(nx, x, 'fill');
grid on;
xlabel('n');
title('x(n)');
axis([-4 16 0 3]);% 绘制h(n)的图像
subplot(312);
stem(nh, h, 'fill');
grid on;
xlabel('n');
title('h(n)');
axis([-4 16 0 3]);% 绘制y(n)的图像
subplot(313);
stem(ny, y, 'fill');
grid on;
xlabel('n');
title('y(n) = x(n) * h(n)');
axis([-4 16 0 3]);

实验内容
(1)试用Matlab 命令求解以下离散时间系统的单位取样响应,并判断系统的稳定性。
$ 1)~~3y\left(n\right)+4y\left(n-1\right)+y\left(n-2\right)=x\left(n\right)+x\left(n-1\right) $
clear;
clc;
close;a1=[3 4 1];
b1=[1 1];
n=0:30;
x=(n==0);% 产生单位抽样序列
h=filter(b1,a1,x);
subplot(211);
stem(n,h,"fill")
grid on
xlabel('n')
title('filter法-系统单位取样响应h(n)')subplot(212);
impz(b1,a1,30);
grid on;
title('impz法-系统单位取样响应h(n)');

%%%
% 函数名:zplane(b,a)
% 功能:得到系统函数H(z)的零极点分布图
% 格式:其中b和a分别表示H(z)的分子和分母多项式的系数向量,函数的作用是在z平面上画出单位圆,零点和极点。
%%%
zplane(b1,a1);

$ 2)~~\frac{5}{2}y\left(n\right)+6y\left(n-1\right)+10y\left(n-2\right)=x\left(n\right) $
close;
a2=[5/2 6 10];
b2=[1];
n=0:30;
x=(n==0);% 产生单位抽样序列
h=filter(b2,a2,x);
subplot(211)
stem(n,h,"fill")
grid on
xlabel('n')
title('filter法-系统单位取样响应h(n)')
subplot(212)
impz(b2,a2,31)
axis([0 30 -3*10^8 2*10^8]);
grid on
title('impz法-系统单位取样响应h(n)')

zplane(b2,a2);

(2)已知某系统的单位取样响应为 h ( n ) = ( 7 8 ) n [ u ( n ) − u ( n − 10 ) ] h\left(n\right)={\left(\frac{7}{8}\right)}^n \left\lbrack u\left(n\right)-u\left(n-10\right)\right\rbrack h(n)=(87)n[u(n)−u(n−10)] , 试用MATLAB 求当激励信号为 x ( n ) = u ( n ) − u ( n − 5 ) x\left(n\right)=u\left(n\right)-u\left(n-5\right) x(n)=u(n)−u(n−5) 时,系统的零状态响应。
clear;
addpath('.\2024-2025(1)《信号处理实验》资料(请拷贝到u盘中,每次试验带到实验室)\实验中用到的一些函数和音频图像文件');
% 定义x(n)向量显示范围(添加了附加的零值)
nx = -1:6;
% 定义h(n)向量显示范围(添加了附加的零值)
nh = -1:11;% 生成单位阶跃序列
x = uDT(nx) - uDT(nx-5);
% 生成h(n)序列
h = (7/8).^nh .* (uDT(nh) - uDT(nh-10));% 计算卷积
y = conv(x, h);% 计算卷积结果的起始点和终点
ny1 = nx(1) + nh(1);
ny2 = nx(end) + nh(end);
ny = ny1:ny2;% 绘制x(n)的图像
subplot(311);
stem(nx, x, 'fill');
grid on;
xlabel('n');
title('x(n)');
axis([-4 18 0 2]);% 绘制h(n)的图像
subplot(312);
stem(nh, h, 'fill');
grid on;
xlabel('n');
title('h(n)');
axis([-4 18 0 2]);% 绘制y(n)的图像
subplot(313);
stem(ny, y, 'fill');
grid on;
xlabel('n');
title('y(n) = x(n) * h(n)');
axis([-4 18 0 4]);

(3)用数字图像处理中的Sobel 算子,调用conv2 函数对lena 图像进行滤波。
设两个3×3 的Sobel 矩阵算子Gx=[-1 0 1;-2 0 2;-1 0 1],Gy=[1 2 1;0 0 0;-1-2 -1]。
-
读取lena 图像数据,保存到B 矩阵中;
-
分如下三种情况对B 进行卷积滤波
① 采用Gx 与B 进行卷积;
② 采用Gy 与的B 进行卷积;
③ 先采用Gx 与B 进行卷积,然后再采用Gy 与B 进行卷积;
④ 在一个figure 中,分四个子图显示出:原始图像,经过Gx 卷积滤波后
图像、经过Gy 卷积滤波后图像,先后采用Gx 和Gy 与的B 进行卷积滤波后
的图像,观察滤波后的图像的效果。
clear;
% 定义Sobel算子
Gx = [-1 0 1; -2 0 2; -1 0 1];
Gy = [1 2 1; 0 0 0; -1 -2 -1];% 读取Lena图像
B = imread('.\2024-2025(1)《信号处理实验》资料(请拷贝到u盘中,每次试验带到实验室)\实验中用到的一些函数和音频图像文件\lena.bmp')
B = 512x512 uint8 矩阵 131 136 133 132 137 137 135 138 133 134 132 128 128 129 126 122 122 120 118 116 113 108 103 99 84 86 77 74 71 67 68 60 59 57 52 56 67 67 62 65 70 73 67 64 70 71 72 79 73 74134 135 132 134 139 133 130 138 140 138 133 126 124 124 122 118 122 120 118 117 114 109 103 98 91 94 81 76 70 65 66 57 60 69 70 68 66 59 60 73 75 75 73 72 71 71 70 71 80 69136 129 137 134 130 135 132 133 135 130 127 128 131 131 126 121 121 114 116 115 108 107 102 90 89 84 78 84 70 69 60 57 55 54 56 60 56 67 59 65 68 72 77 76 69 65 71 80 74 76137 130 137 135 131 135 132 132 135 131 128 129 132 132 127 122 124 122 117 112 114 109 102 99 100 89 76 76 62 66 65 67 62 62 65 67 64 73 67 73 58 62 69 73 70 65 65 68 76 77137 132 137 135 131 134 133 132 135 132 129 129 132 132 128 124 127 125 116 110 115 108 105 103 97 89 79 81 67 69 64 64 56 57 62 62 59 66 62 69 66 66 69 74 75 73 73 75 75 71137 133 136 136 132 133 133 131 134 130 128 128 130 130 127 124 127 120 115 112 114 104 108 101 95 87 79 83 69 69 63 61 53 53 60 58 56 61 59 65 67 67 70 74 75 73 75 79 76 79136 134 134 136 132 131 134 130 131 128 126 126 128 128 126 124 124 120 115 114 120 103 108 99 90 85 79 83 70 69 61 58 62 60 68 65 66 68 67 72 63 68 77 82 80 74 74 78 65 66134 133 132 135 132 130 135 130 129 127 125 125 126 126 125 124 121 125 116 113 131 105 105 103 89 83 77 83 69 69 61 59 64 60 68 63 68 69 68 70 68 72 79 82 78 73 75 80 72 78132 132 130 134 131 129 136 130 129 127 126 125 126 127 126 126 120 125 114 111 132 102 105 103 96 86 75 76 63 67 66 68 60 53 60 55 64 65 63 62 71 70 70 71 69 66 68 73 76 74131 132 129 134 131 129 136 130 130 128 127 126 127 127 127 127 120 119 111 110 125 97 107 100 92 85 77 82 69 71 66 66 64 55 61 56 67 68 65 63 76 73 73 76 77 74 70 68 77 73
% ① 采用Gx与B进行卷积
B_Gx = conv2(B, Gx, 'same');% ② 采用Gy与B进行卷积
B_Gy = conv2(B, Gy, 'same');% ③ 先采用Gx与B进行卷积,然后再采用Gy与B进行卷积
B_Gx_Gy = conv2(B_Gx, Gy, 'same');% ④ 在一个figure中,分四个子图显示图像
figure;
subplot(2,2,1), imshow(B), title('原始图像');
subplot(2,2,2), imshow(B_Gx, []), title('Gx卷积滤波后图像');
subplot(2,2,3), imshow(B_Gy, []), title('Gy卷积滤波后图像');
subplot(2,2,4), imshow(B_Gx_Gy, []), title('Gx和Gy卷积滤波后图像');

原始图像:未经处理的灰度图像。
Gx卷积滤波后图像:突出水平边缘。
Gy卷积滤波后图像:突出垂直边缘。
Gx和Gy卷积滤波后图像:结合两者,全面突出边缘。
思考题
(1) Matlab 的工具箱函数conv,能用于计算两个有限长序列之间的卷积,但conv 函数假定这两个序列都从n=0 开始。试编写M 文件计算x(n) = [3,11,7,0,−1,4,2],−3≤ n ≤ 3 和 h(n) = [2,3,0,−5,2,1],−1≤ n ≤ 4 之 间 的 卷积,并绘制y(n)的波形图。
close;
clear;
% 定义序列 x(n) 和 h(n)
nx = -3:3; % n 的范围
x = [3, 11, 7, 0, -1, 4, 2]; % x(n)nh = -1:4; % n 的范围
h = [2, 3, 0, -5, 2, 1]; % h(n)% 计算卷积
y = conv(x, h);% 定义 y(n) 的范围
ny = nx(1) + nh(1) : nx(end) + nh(end); % y(n) 的范围% 绘制x(n)的图像
subplot(311);
stem(nx, x, 'fill');
grid on;
xlabel('n');
title('x(n)');
axis([-4 8 -5 15]);% 绘制h(n)的图像
subplot(312);
stem(nh, h, 'fill');
grid on;
xlabel('n');
title('h(n)');
axis([-4 8 -5 5]);% 绘制y(n)的图像
subplot(313);
stem(ny, y, 'fill');
grid on;
xlabel('n');
title('y(n) = x(n) * h(n)');
axis([-4 8 -80 80]);

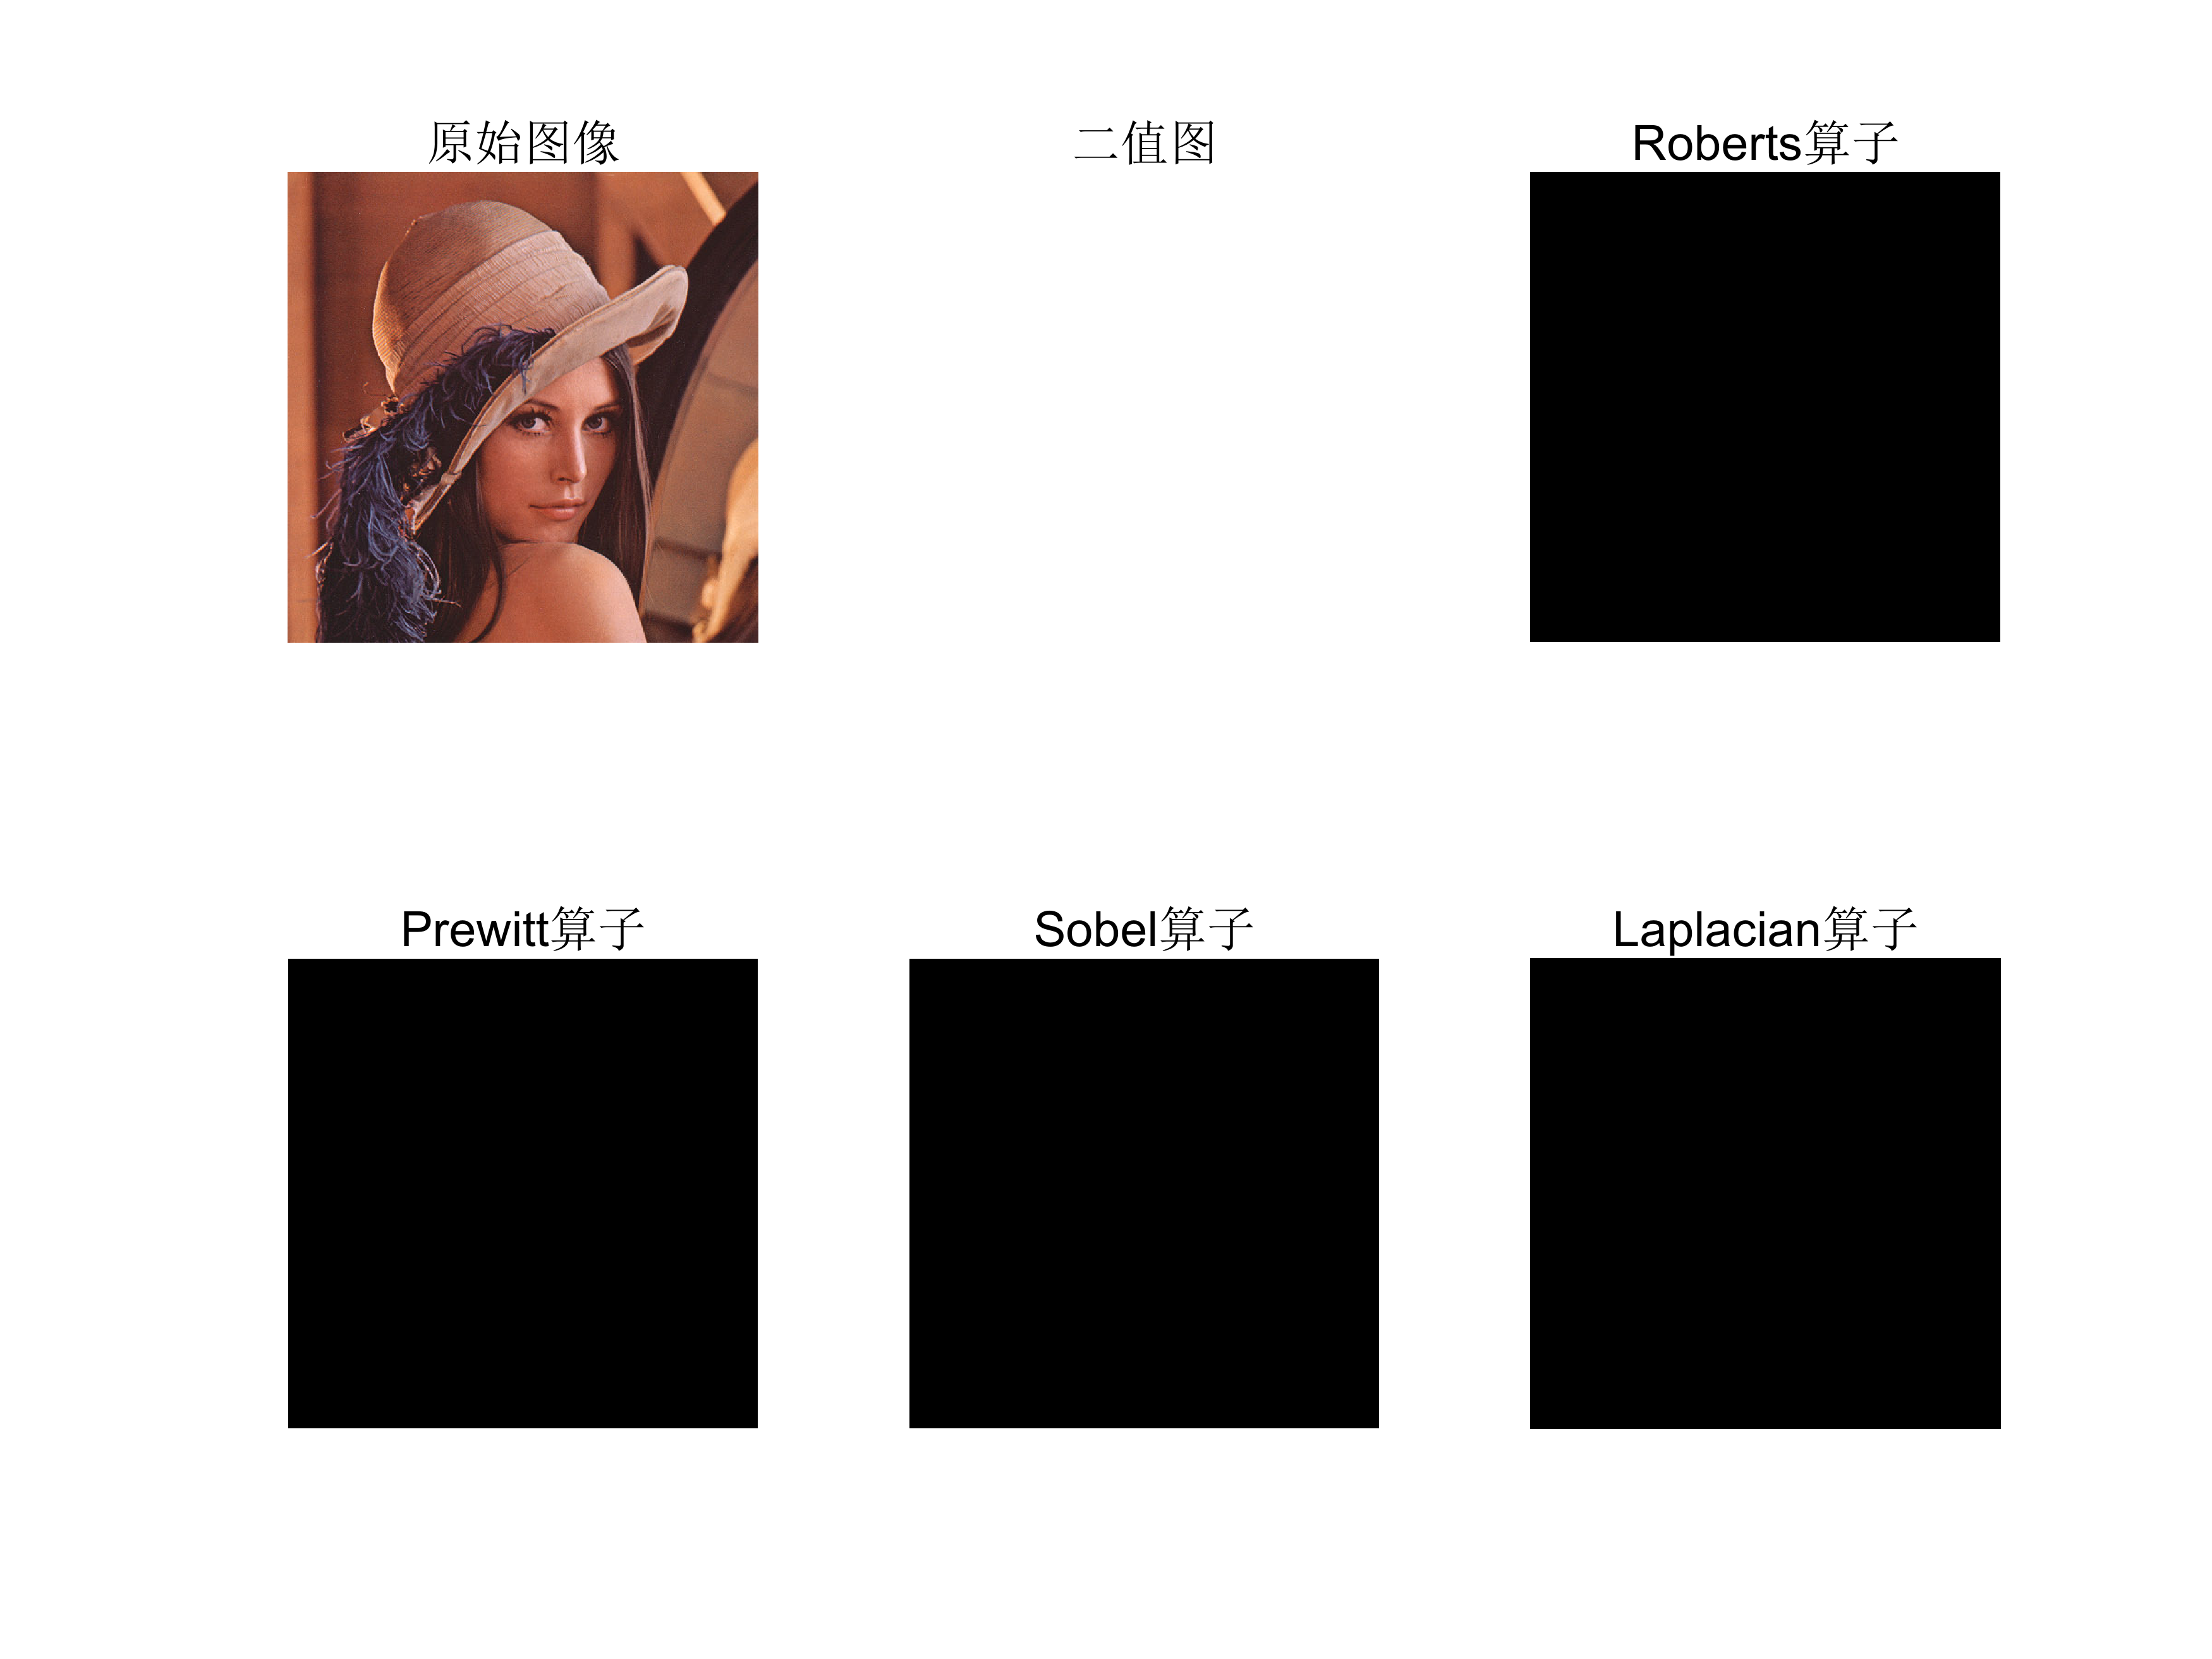
(2) 在数字图像处理边缘检测技术中,除了Sobel 算子外,还有哪些边缘检测算子?通过查找资料,选择某种边缘检测算子,在Matlab 平台上编程实现对lena 或其他图像进行边缘检测,显示出原图和边缘检测后的图像。
- Prewitt 算子
- Canny 边缘检测
- Roberts 交叉梯度算子
- Laplacian 边缘检测
- Scharr 算子
数字图像处理(19): 边缘检测算子(Roberts算子、Prewitt算子、Sobel算子 和 Laplacian算子)_ubuntu写出roberts、sobel、laplace边缘检测算法-CSDN博客
图像特征与边缘检测:从Sobel算子到Canny边缘检测【计算机视觉】-CSDN博客
clear;
% 读取图像
img = imread([...'.\2024-2025(1)《信号处理实验》资料(请拷贝到u盘中,每次试验带到实验室)\实验中用到的一些函数和音频图像文件\lena_colour.bmp'% '运动.jpg'% '东方明珠.jpg']);
img_RGB = img; % MATLAB 读取图像默认是 RGB 格式% 灰度化处理图像
grayImage = rgb2gray(img);% 高斯滤波
gaussianBlur = imgaussfilt(grayImage, 1); % 1 为标准差% 阈值处理
binary = imbinarize(gaussianBlur, 0.5); % 0.5 为阈值% Roberts算子
kernelx = [-1 0; 0 1];
kernely = [0 -1; 1 0];
x_roberts = imfilter(double(binary), kernelx);
y_roberts = imfilter(double(binary), kernely);
Roberts = uint8(sqrt(x_roberts.^2 + y_roberts.^2));% Prewitt算子
kernelx = [1 1 1; 0 0 0; -1 -1 -1];
kernely = [-1 0 1; -1 0 1; -1 0 1];
x_prewitt = imfilter(double(binary), kernelx);
y_prewitt = imfilter(double(binary), kernely);
Prewitt = uint8(sqrt(x_prewitt.^2 + y_prewitt.^2));% Sobel算子
Sobel_x = imfilter(double(binary), fspecial('sobel'));
Sobel_y = imfilter(double(binary), fspecial('sobel')');
Sobel = uint8(sqrt(Sobel_x.^2 + Sobel_y.^2));% Laplacian算子
Laplacian = uint8(imfilter(double(binary), fspecial('laplacian')));% 显示图像
figure;
subplot(2, 3, 1), imshow(img_RGB), title('原始图像'), axis off;
subplot(2, 3, 2), imshow(binary,[]), title('二值图'), axis off;
subplot(2, 3, 3), imshow(Roberts,[]), title('Roberts算子'), axis off;
subplot(2, 3, 4), imshow(Prewitt,[]), title('Prewitt算子'), axis off;
subplot(2, 3, 5), imshow(Sobel,[]), title('Sobel算子'), axis off;
subplot(2, 3, 6), imshow(Laplacian,[]), title('Laplacian算子'), axis off;

clear;
% 读取图像
img = imread('.\2024-2025(1)《信号处理实验》资料(请拷贝到u盘中,每次试验带到实验室)\实验中用到的一些函数和音频图像文件\lena_colour.bmp');
img_RGB = img; % MATLAB 读取图像默认是 RGB 格式% 灰度化处理图像
grayImage = rgb2gray(img);% 高斯滤波
gaussianBlur = imgaussfilt(grayImage, 1); % 1 为标准差% 阈值处理
binary = imbinarize(gaussianBlur, 0.); % 0.5 为阈值% Roberts算子(使用 conv2)
kernelx = [-1 0; 0 1];
kernely = [0 -1; 1 0];
x_roberts = conv2(double(binary), kernelx, 'same');
y_roberts = conv2(double(binary), kernely, 'same');
Roberts = uint8(sqrt(x_roberts.^2 + y_roberts.^2));% Prewitt算子(使用 conv2)
kernelx_prewitt = [1 1 1; 0 0 0; -1 -1 -1];
kernely_prewitt = [-1 0 1; -1 0 1; -1 0 1];
x_prewitt = conv2(double(binary), kernelx_prewitt, 'same');
y_prewitt = conv2(double(binary), kernely_prewitt, 'same');
Prewitt = uint8(sqrt(x_prewitt.^2 + y_prewitt.^2));% Sobel算子(使用 conv2)
Sobel_x = conv2(double(binary), fspecial('sobel'), 'same');
Sobel_y = conv2(double(binary), fspecial('sobel')', 'same');
Sobel = uint8(sqrt(Sobel_x.^2 + Sobel_y.^2));% Laplacian算子(使用 conv2)
Laplacian = uint8(conv2(double(binary), fspecial('laplacian'), 'same'));% 显示图像
figure;
subplot(2, 3, 1), imshow(img_RGB), title('原始图像'), axis off;
subplot(2, 3, 2), imshow(binary, []), title('二值图'), axis off;
subplot(2, 3, 3), imshow(Roberts, []), title('Roberts算子'), axis off;
subplot(2, 3, 4), imshow(Prewitt, []), title('Prewitt算子'), axis off;
subplot(2, 3, 5), imshow(Sobel, []), title('Sobel算子'), axis off;
subplot(2, 3, 6), imshow(Laplacian, []), title('Laplacian算子'), axis off;


![[pdf,epub]162页《分析模式》漫谈合集01-35提供下载](https://img-blog.csdnimg.cn/img_convert/462213a7a1880b8a3c46e43ba0681ad3.png)
