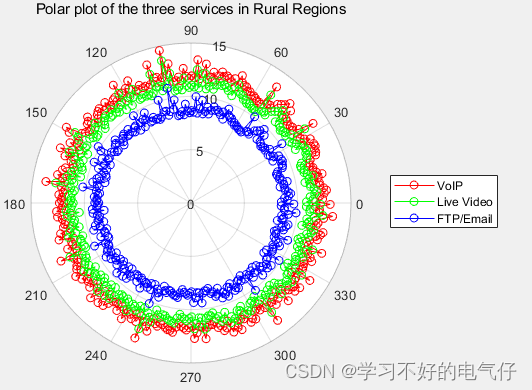
基于Hata信道模型的BPSK调制信号小区覆盖模拟matlab仿真,对比VoIP, Live Video,FTP/Email
完整程序:
clc;
clear;
close all;
warning off;
addpath(genpath(pwd));
% Random bits are generated here.
bits = randi([0, 1], [50,1]);
M = 2;
t = 1:1:50;
trans = pskmod(bits,M);
plot(t,trans);
title('BPSK Modulated Signal in Time domain');
xlabel('Bits Distribution');
ylabel('Bit Magnitude');
h = scatterplot(trans);
title('Scatter Plot of BPSK Modulated signal');
% HATA Model
fc = 900;
hr = 3;
ht = 70;
d = 2;
alpha = (1.11*log10(fc) -0.7)*hr - (1.56*log10(fc) -0.8);
% Path Loss in dB for urban case
PL = 69.55 + 26.16*log10(fc) - 13.82*log10(ht) - alpha + (44.9 - 6.55*log10(ht))*log10(d);
%Path Loss in rural case
PLr = PL - 4.78*((log10(fc))^2) + 18.33*log10(fc) - 40.94;
PLr_log_normal = PLr + (randn*6);
%For VOIP
ber1 = 0.01;
%For Live Video Streaming
ber2 = 0.001;
%For Email / File Transfer
ber3 = 0.000001;
snr1 = (qfuncinv(ber1))^2;
snr2 = (qfuncinv(ber2))^2;
snr3 = (qfuncinv(ber3))^2;
sensitivity = -126;
margin = 6*qfuncinv(.1);
Noise=10*log10(normrnd(0,6,1,300));
Pr1 = snr1 + sensitivity + margin +Noise ;
Pr2 = snr2 + sensitivity + margin +Noise ;
Pr3 = snr3 + sensitivity + margin +Noise;
lcable = 0; %No cable loss
I = 0; % Assuming a single cell model
%Taking N to be 0;
Pt1 = PLr + snr1 + margin +lcable +I;
Pt2 = PLr + snr2 + margin +lcable +I;
Pt3 = PLr + snr3 + margin +lcable+I ;
Y = ['The Transmitted Power in dB is: ',num2str(Pt1)];
disp(Y);
area1 = (Pr1/Pt1)*pi*2*2;
area2 = (Pr2/Pt2)*pi*2*2;
area3 = (Pr3/Pt3)*pi*2*2;
theta = linspace(0,2*pi,300);
%plot(theta,area1(length(theta)));
figure;
polarplot(theta,area1,'r-o');
hold on;
polarplot(theta,area2,'g-o');
hold on;
polarplot(theta,area3,'b-o');
title('Polar plot of the three services in Rural Regions');
legend('VoIP', 'Live Video','FTP/Email');








![java八股文面试[数据库]——分库分表](https://img-blog.csdnimg.cn/img_convert/bcd2fcaeec3ec03c370f10f223e46199.jpeg)
