1. 需求
2. 实现
2.1 获取数据源
# -*- coding: utf-8 -*-
import os
import json
import requests
import pandas as pd
from pathlib import PurePath, Path
import plotly.express as px
from requests_toolbelt import MultipartEncoderdef get_data():dt = ['2023-10-01', '2023-10-02', '2023-10-03', '2023-10-04', '2023-10-05', '2023-10-06', '2023-10-07', '2023-10-08']y1 = [0.701923, 0.653595, 0.683258, 0.647059, 0.670659, 0.637615, 0.736586, 0.685000]y2 = [i+0.1 for i in y1]data = {'dt': dt,'y1': y1,'y2': y2}df = pd.DataFrame(data)return df
或从hive中读数据
conn = BaseHook.get_connection('hive_cli_default')
conn_hive = connect(host=conn.host, port=conn.port, timeout=3600, auth_mechanism='PLAIN',user=conn.login, password=conn.password)
cursor = conn_hive.cursor()
cursor.execute('SET mapreduce.job.queuename=root.bigdata')
cursor.execute('set mapred.job.name={table}'.format(table=dag_name))
cursor.execute('set hive.vectorized.execution.enabled = false')
sql = '''select dt, y1, y2from table;
'''
cursor.execute(sql)
data = cursor.fetchall()
cursor.close()
df = pd.DataFrame(data, columns=['dt'] + ['y1', 'y2'])
return df# 或
# df = pd.read_sql(sql, con)
2.2 绘制图片
# 绘制折线图
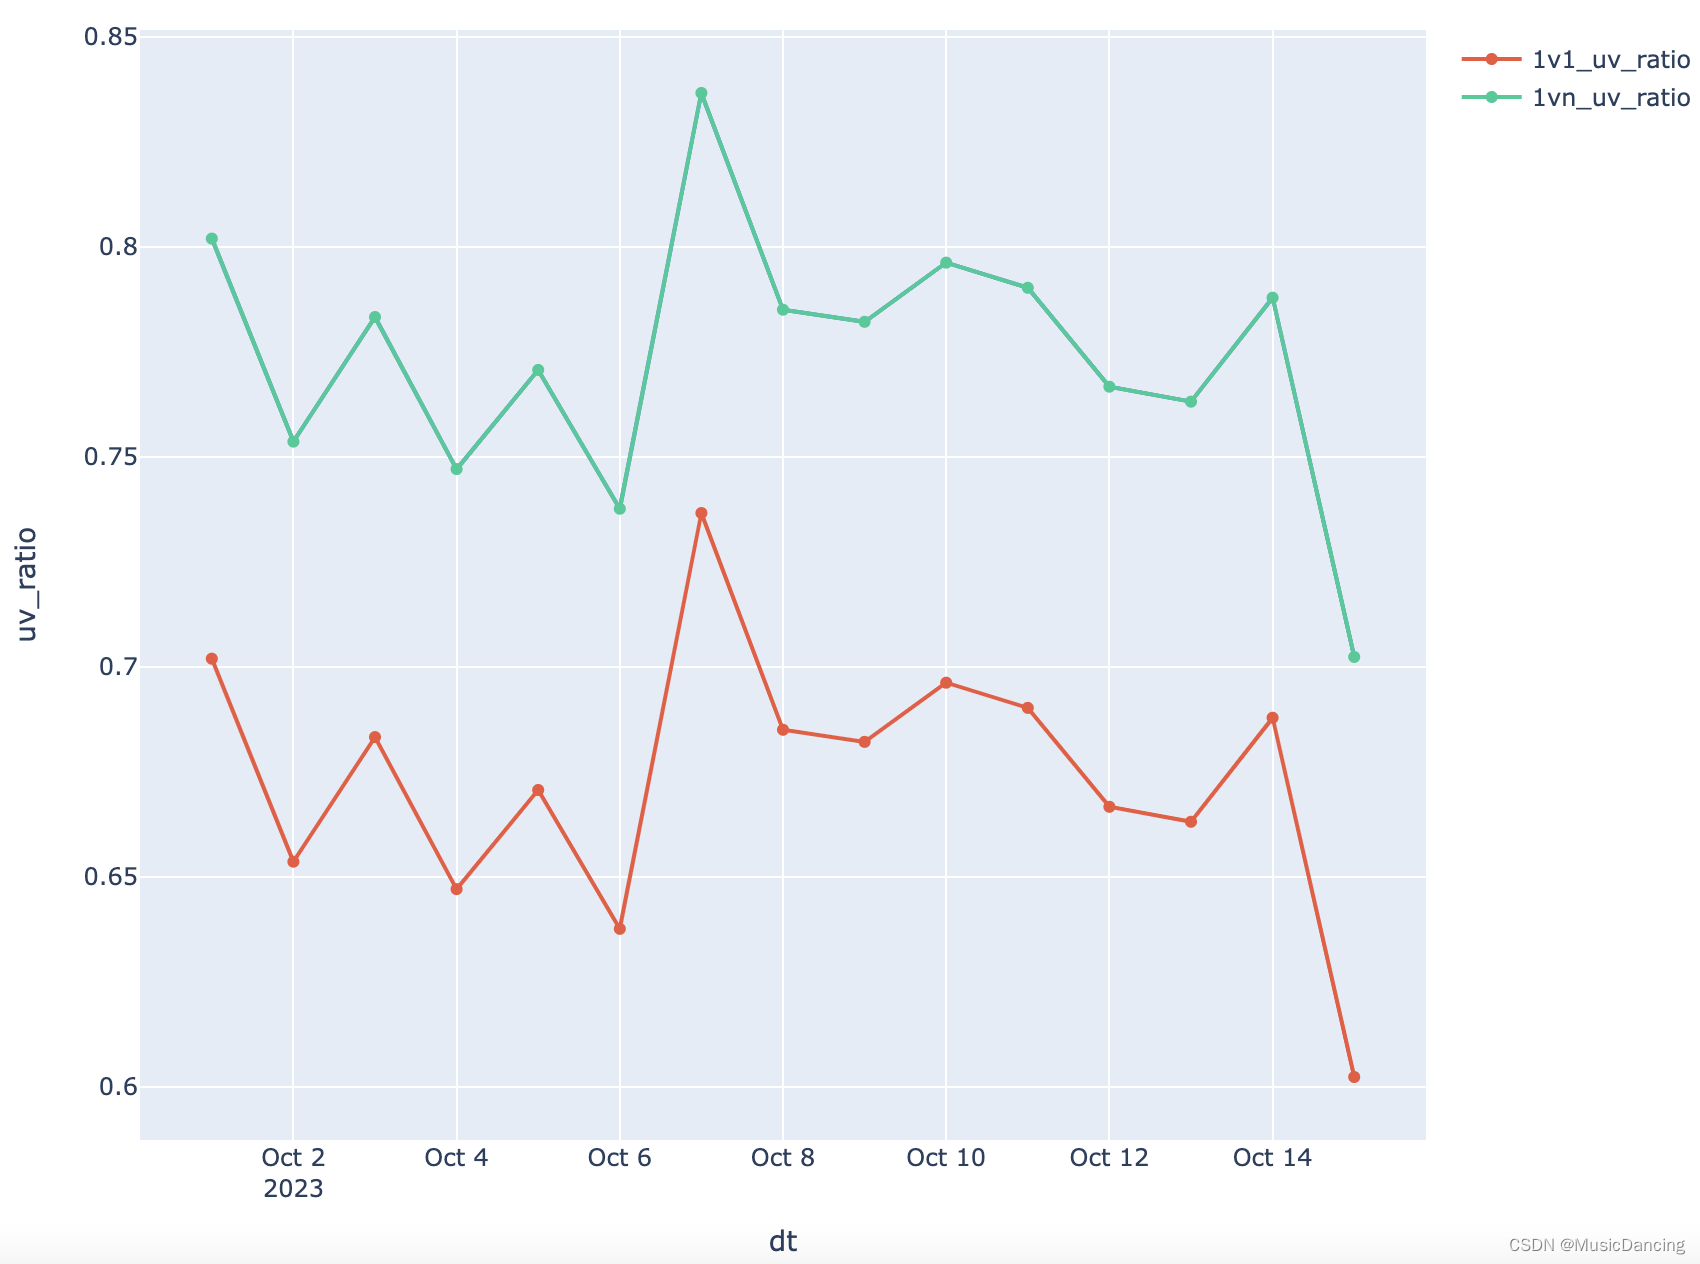
def draw_img(df):fig = px.line(df, x='dt', y='y1')# fig = px.line(df, x='dt', y='y1', markers=True, line_shape='linear')fig.add_scatter(x=df['dt'], y=df['y1'], name='y1')fig.add_scatter(x=df['dt'], y=df['y2'], name='y2')fig.update_traces(textfont_size=8)fig.layout.yaxis.title = "uv_ratio"# fig.show()return fig
如下:
2.3 存储图片
def save_img(fig, img_name):try:root_dir = os.path.dirname(__file__)except Exception as e:print(e)root_dir = PurePath(Path.cwd())root_dir = os.path.abspath(root_dir)print(root_dir)# 在该项目目录下创建images文件夹if not os.path.exists("images"):os.mkdir("images")img_path = f"{root_dir}/images/{img_name}"fig.write_image(img_path)return img_path2.4 上传图片并获得图片ID
def upload_image(img_path):# 1. 获得tokenurl_1 = "https://open.feishu.cn/open-apis/auth/v3/tenant_access_token/internal/"req_body = {"app_id": "cli_a23XXXX","app_secret": "4w8XXX"}data = bytes(json.dumps(req_body), encoding='utf8')result = requests.request("POST", url_1, headers={'Content-Type': 'application/json; charset=utf-8'}, data=data)# print(result.content)token = result.json()["tenant_access_token"]print(token)# 2. 上传图片url = "https://open.feishu.cn/open-apis/im/v1/images"multi_form = MultipartEncoder({'image_type': 'message', 'image': (open(f'{img_path}', 'rb'))})headers = {'Authorization': f'Bearer {token}', # tenant_access_token'Content-Type': multi_form.content_type}response = requests.request("POST", url, headers=headers, data=multi_form)# print(response.headers['X-Tt-Logid']) # for debug or oncall# print(response.content) # Print Responseimg_id = eval(response.content.decode("utf-8"))["data"]["image_key"]return img_id2.5 发送飞书图片消息
def send_markdown(title, token, dt, img_id_1, img_id_2):http_headers = {'content-type': 'application/json'}request_url = f'https://open.feishu.cn/open-apis/bot/v2/hook/{token}'request_data = {"msg_type": "interactive","card": {"config": {"wide_screen_mode": True,"enable_forward": True},"header": {"title": {"tag": "plain_text","content": f"{title}"},"template": "blue"},"elements": [{"tag": "div","fields": [{"is_short": True,"text": {"tag": "lark_md","content": f"**日期:** {dt}"}},]},{"tag": "img","img_key": f"{img_id_1}","alt": {"tag": "plain_text","content": "图片"}},{"tag": "img","img_key": f"{img_id_2}","alt": {"tag": "plain_text","content": "图片"}},]}}response = requests.post(request_url, json=request_data, headers=http_headers)print(response)if response.status_code != 200:print('飞书消息发送失败,http_code={},http_message={}'.format(response.status_code, response.reason))else:print('飞书消息发送成功')2.6 调用
1. 发单张图片
dt = '2023-10-18'
df = get_data()
fig = draw_img(df)
fig.show()
img_path = save_img(fig, img_name='pv_ratio.png')
img_id = upload_image(img_path)
send_markdown('XX服务日报-近14日指标趋势图', token, dt, img_id)
2. 发多张图片
# ------- 画PV相关指标 ----------
df.columns = ['dt', 'y1_pv', 'y1_uv', 'y2_pv', 'y2_uv']
fig_pv = px.line(df, x='dt', y='y1_pv', markers=True, line_shape='linear')
fig_pv.add_scatter(x=df['dt'], y=df['y1_pv'], name='y1_pv')
fig_pv.add_scatter(x=df['dt'], y=df['y2_pv'], name='y2_pv')
fig_pv.update_traces(textfont_size=8)
fig_pv.layout.yaxis.title = "pv_ratio"
img_path_pv = save_img(fig_pv, img_name='pv_ratio.png')
img_id_pv = upload_image(img_path_pv)# ------- 画UV相关指标 ----------
fig_uv = px.line(df, x='dt', y='y1_uv', markers=True, line_shape='linear')
fig_uv.add_scatter(x=df['dt'], y=df['y1_uv'], name='y1_uv')
fig_uv.add_scatter(x=df['dt'], y=df['y2_uv'], name='y2_uv')
fig_uv.update_traces(textfont_size=8)
fig_uv.layout.yaxis.title = "uv_ratio"
img_path_uv = save_img(fig_uv, img_name='uv_ratio.png')
img_id_uv = upload_image(img_path_uv)send_markdown('XX服务日报-近14日指标趋势图', token, dt, img_id_pv, img_id_uv)

