visium_heart/st_snRNAseq/05_colocalization/create_niches_ct.R at 5b30c7e497e06688a8448afd8d069d2fa70ebcd2 · saezlab/visium_heart (github.com) 更多内容,关注微信:生信小博士
The ILR (Isometric Log-Ratio) transformation is used in the analysis of compositional data. Any given observation is a set of positive values summing to unity, such as the proportions of chemicals in a mixture or proportions of total time spent in various activities. The sum-to-unity invariant implies that although there may be k≥2�≥2 components to each observation, there are only k−1�−1 functionally independent values. (Geometrically, the observations lie on a k−1�−1-dimensional simplex in k�-dimensional Euclidean space Rk��. This simplicial nature is manifest in the triangular shapes of the scatterplots of simulated data shown below.)
Typically, the distributions of the components become "nicer" when log transformed. This transformation can be scaled by dividing all values in an observation by their geometric mean before taking the logs.
ilr数据输入要求:

baseILR <- ilrBase(x = integrated_compositions,method = "basic")head( baseILR)cell_ilr <- as.matrix(ilr(integrated_compositions, baseILR))colnames(cell_ilr) <- paste0("ILR_", 1:ncol(cell_ilr))print(head(cell_ilr)[,1:9]) 

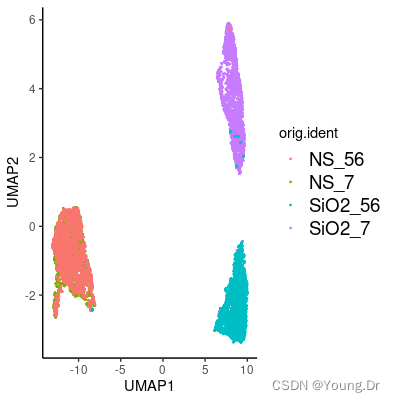
umap图
comp_umap <- umap(cell_ilr, n_neighbors = 30, n_epochs = 1000) %>%as.data.frame() %>%mutate(row_id = rownames(cell_ilr))head(atlas_meta)comp_umap %>%left_join(atlas_meta, by = c("row_id")) %>%ggplot(aes(x = V1, y = V2, color = opt_clust_integrated)) +ggrastr::geom_point_rast(size = 0.3) +theme_classic() +xlab("UMAP1") +ylab("UMAP2")+theme(legend.text = element_text(size = 14))
comp_umap %>%
left_join(atlas_meta, by = c("row_id")) %>%
ggplot(aes(x = V1, y = V2,
color = orig.ident)) +
ggrastr::geom_point_rast(size = 0.3) +
theme_classic() +
xlab("UMAP1") +
ylab("UMAP2")+
theme(legend.text = element_text(size = 14))

