在我之前的文章 “Elasticsearch:ES|QL 查询语言简介”,我对 Elasticsearch 的最新查询语言 ES|QL 做了一个简单的介绍。在今天的文章中,我们详细来使用一些例子来展示 ES|QL 强大的搜索与分析功能。

安装
如果你还没有安装好自己的 Elasticsearch 及 Kibana,请参考如下的链接来进行安装:
- 如何在 Linux,MacOS 及 Windows 上进行安装 Elasticsearch
- Kibana:如何在 Linux,MacOS 及 Windows上安装 Elastic 栈中的 Kibana
在安装的时候,我们选择 Elastic Stack 8.x 来进行安装。特别值得指出的是:ES|QL 只在 Elastic Stack 8.11 及以后得版本中才有。你需要下载 Elastic Stack 8.11 及以后得版本来进行安装。
在首次启动 Elasticsearch 的时候,我们可以看到如下的输出:

我们需要记下 Elasticsearch 超级用户 elastic 的密码。
写入数据
首先,我们在 Kibana 中打入如下的命令来创建一个叫做 nyc_taxis 的索引:
PUT nyc_taxis
{"mappings": {"dynamic": "strict","_source": {"mode": "stored"},"properties": {"cab_color": {"type": "keyword"},"dropoff_datetime": {"type": "date","format": "yyyy-MM-dd HH:mm:ss"},"dropoff_location": {"type": "geo_point"},"ehail_fee": {"type": "scaled_float","scaling_factor": 100},"extra": {"type": "scaled_float","scaling_factor": 100},"fare_amount": {"type": "double"},"improvement_surcharge": {"type": "scaled_float","scaling_factor": 100},"mta_tax": {"type": "scaled_float","scaling_factor": 100},"passenger_count": {"type": "integer"},"payment_type": {"type": "keyword"},"pickup_datetime": {"type": "date","format": "yyyy-MM-dd HH:mm:ss"},"pickup_location": {"type": "geo_point"},"rate_code_id": {"type": "keyword"},"store_and_fwd_flag": {"type": "keyword"},"surcharge": {"type": "scaled_float","scaling_factor": 100},"tip_amount": {"type": "double"},"tolls_amount": {"type": "scaled_float","scaling_factor": 100},"total_amount": {"type": "scaled_float","scaling_factor": 100},"trip_distance": {"type": "scaled_float","scaling_factor": 100},"trip_type": {"type": "keyword"},"vendor_id": {"type": "keyword"},"vendor_name": {"type": "text"}}}
}
接着,我们可以在地址 GitHub - liu-xiao-guo/esql 下载数据集文件 esql.json。 我们可以使用如下的命令来写入数据:
curl --cacert /Users/liuxg/elastic/elasticsearch-8.11.0/config/certs/http_ca.crt -u elastic:o6G_pvRL=8P*7on+o6XH -s -H "Content-Type: application/x-ndjson" -XPOST https://localhost:9200/nyc_taxis/_bulk --data-binary @esql.json你需要根据自己的安装目录改写上面的证书 http_ca.crt 的路径。你需要根据 elastic 用户的密码做相应的调整。
运行完上面的命令后:
GET nyc_taxis/_count上面的命令返回:
{"count": 100,"_shards": {"total": 1,"successful": 1,"skipped": 0,"failed": 0}
}
我们可以看到 100 个数据。我们为这个数据创建一个 data view:


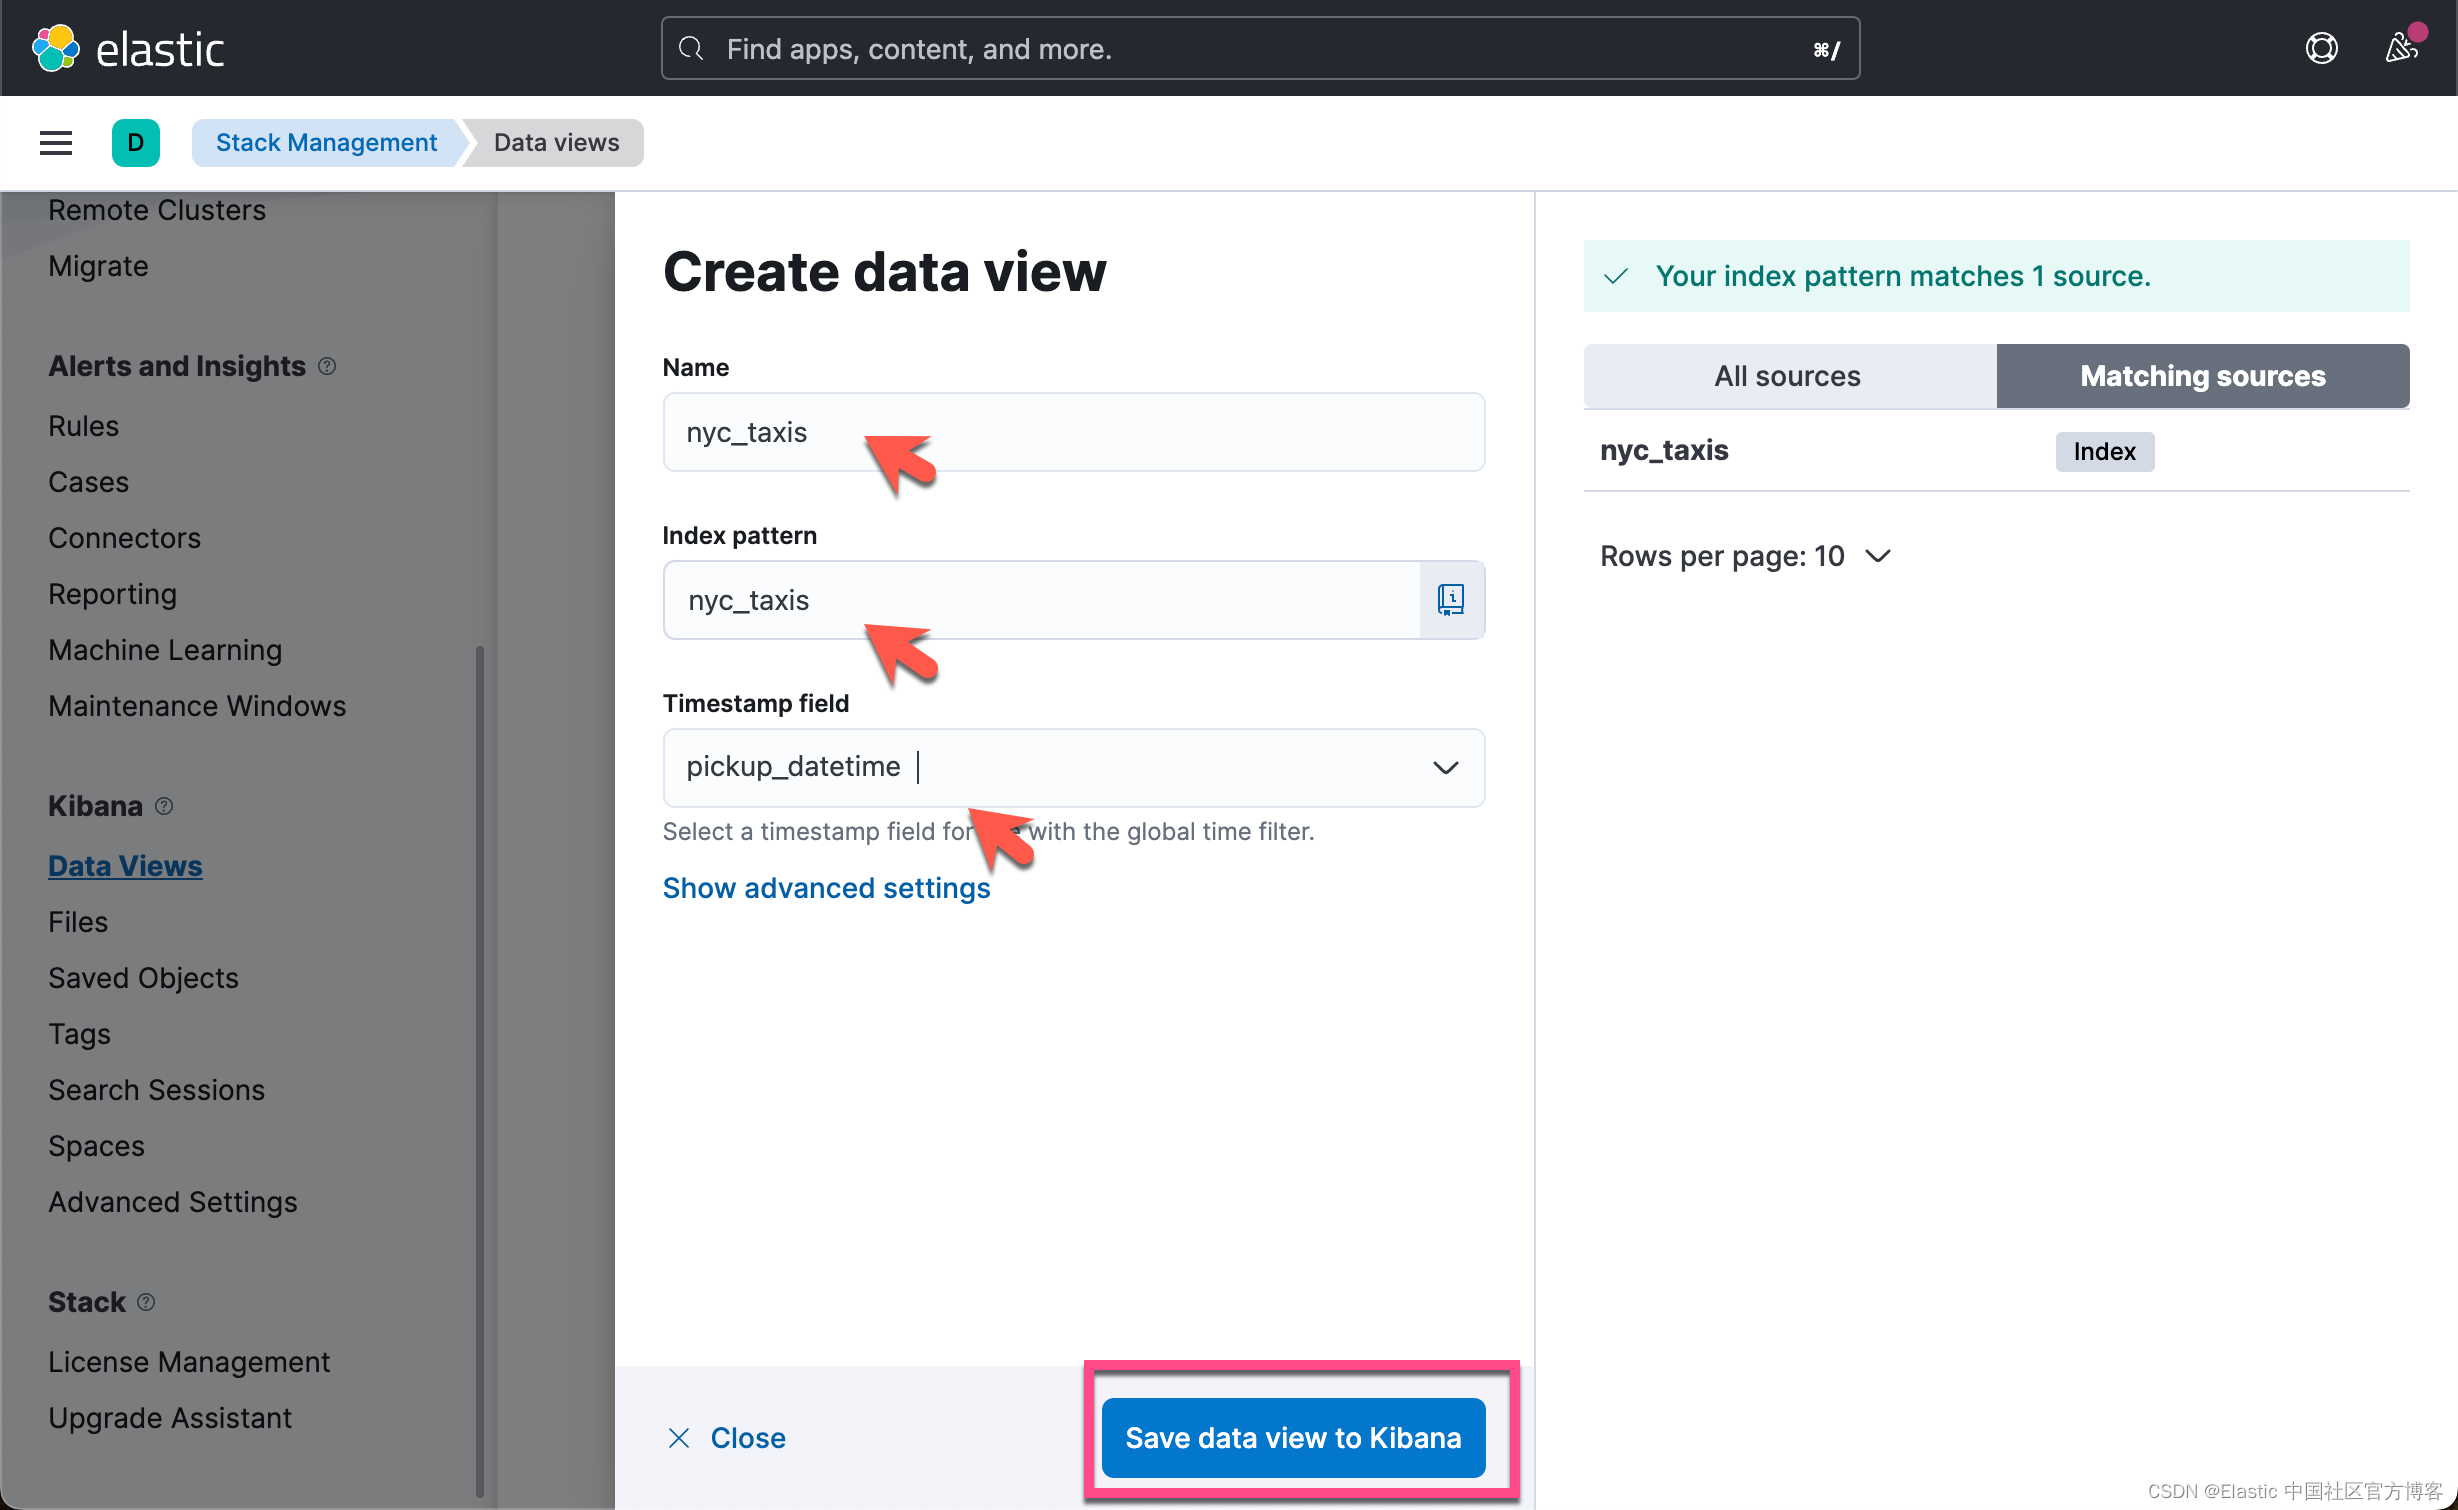

这样我们就为 nyc_taxis 创建好了一个 index pattern。
ES|QL 动手实践
首先我们来做一个简单的练习。
查询数据

我们选定好时间范围,再选择 Try ES|QL:

我们发现在默认的情况下,在 Query bar 里的查询语句是这样的:
from nyc_taxis | limit 10这个相当于:
GET nyc_taxis/_search?size=10为了方便展示,我们把编辑框放大:
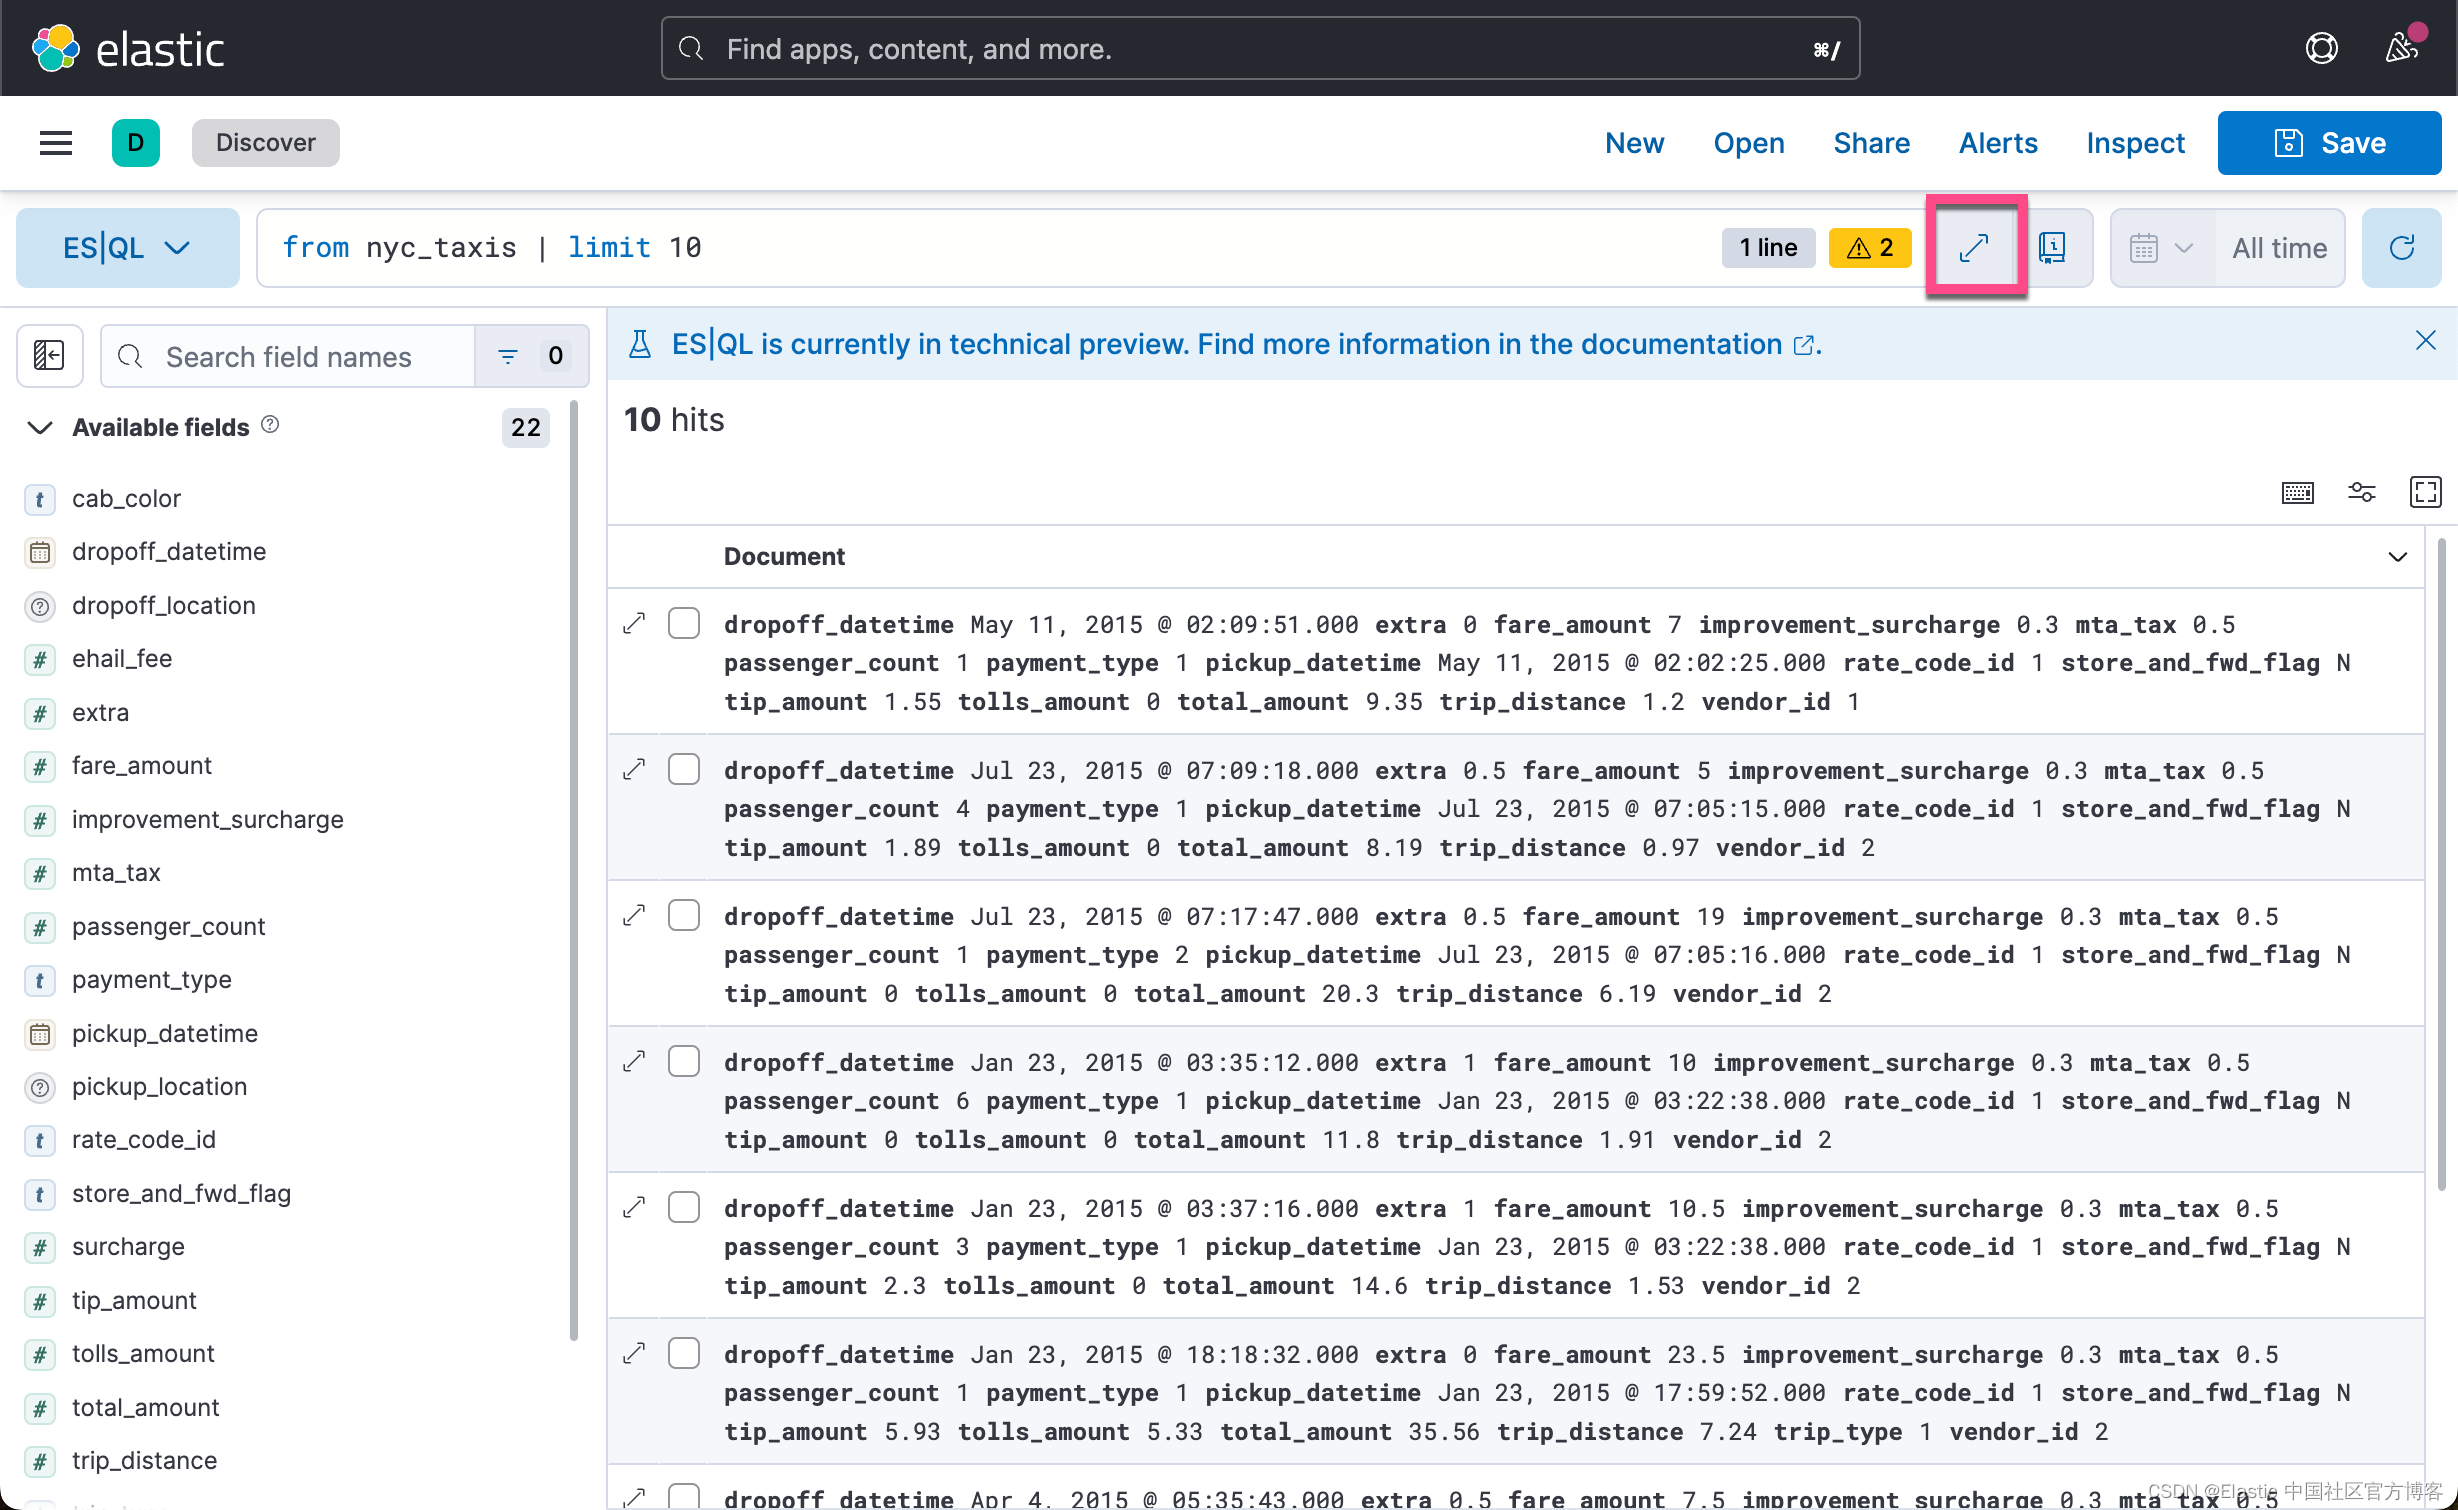

这样我们的内容更容易看的清楚一些。
我们做如下的查询:
from nyc_taxis
| limit 100
| project pickup_datetime, total_amount
在上面,我们使用 project 来返回我们想要的字段。当然我们可以使用 keep 来做同样的事情:
from nyc_taxis
| limit 100
| keep pickup_datetime, total_amount
我们也可以在 Kibana 的 Dev Tools 中打入如下的命令:
POST /_query?format=json
{"query": """from nyc_taxis | limit 100| keep pickup_datetime, total_amount"""
}
我们也可以改变它的输出格式:
POST /_query?format=txt
{"query": """from nyc_taxis | limit 100| keep pickup_datetime, total_amount"""
}
我们可以通过 sort 来对结果进行排序:

我们可以看到结果是按照 total_amount 进行降序排列的。

在上面,我们可以看到针对 nyc_taxis 这个索引,它没有 @timestamp 时间字段。那我们该怎么办呢?我们可以通过字段 alias 来实现这个。我们执行如下的命令:
PUT nyc_taxis/_mapping
{"properties": {"@timestamp": {"type": "alias","path": "pickup_datetime"}}
}
执行完上面的命令后,我们再次刷新页面:

可能有人想问,这个相应的 DSL 查询的语句是什么呢?如果大家对 DSL 很熟悉的话,上面的语句和下面的查询的结果是一样的:
GET nyc_taxis/_search?filter_path=**.hits
{"size": 100,"_source": false,"fields": ["pickup_datetime","tolls_amount"],"sort": [{"total_amount": {"order": "desc"}}]
}
接下来,我们来查询 fare_amount 大于 20 的结果:
from nyc_taxis
| where fare_amount > 20
from nyc_taxis
| where fare_amount > 20
| where payment_type == "1"
上面显示的结果不是很清楚,我们可以使用 keep 来进行查看:
from nyc_taxis
| where fare_amount > 20
| where payment_type == "1"
| keep fare_amount, payment_type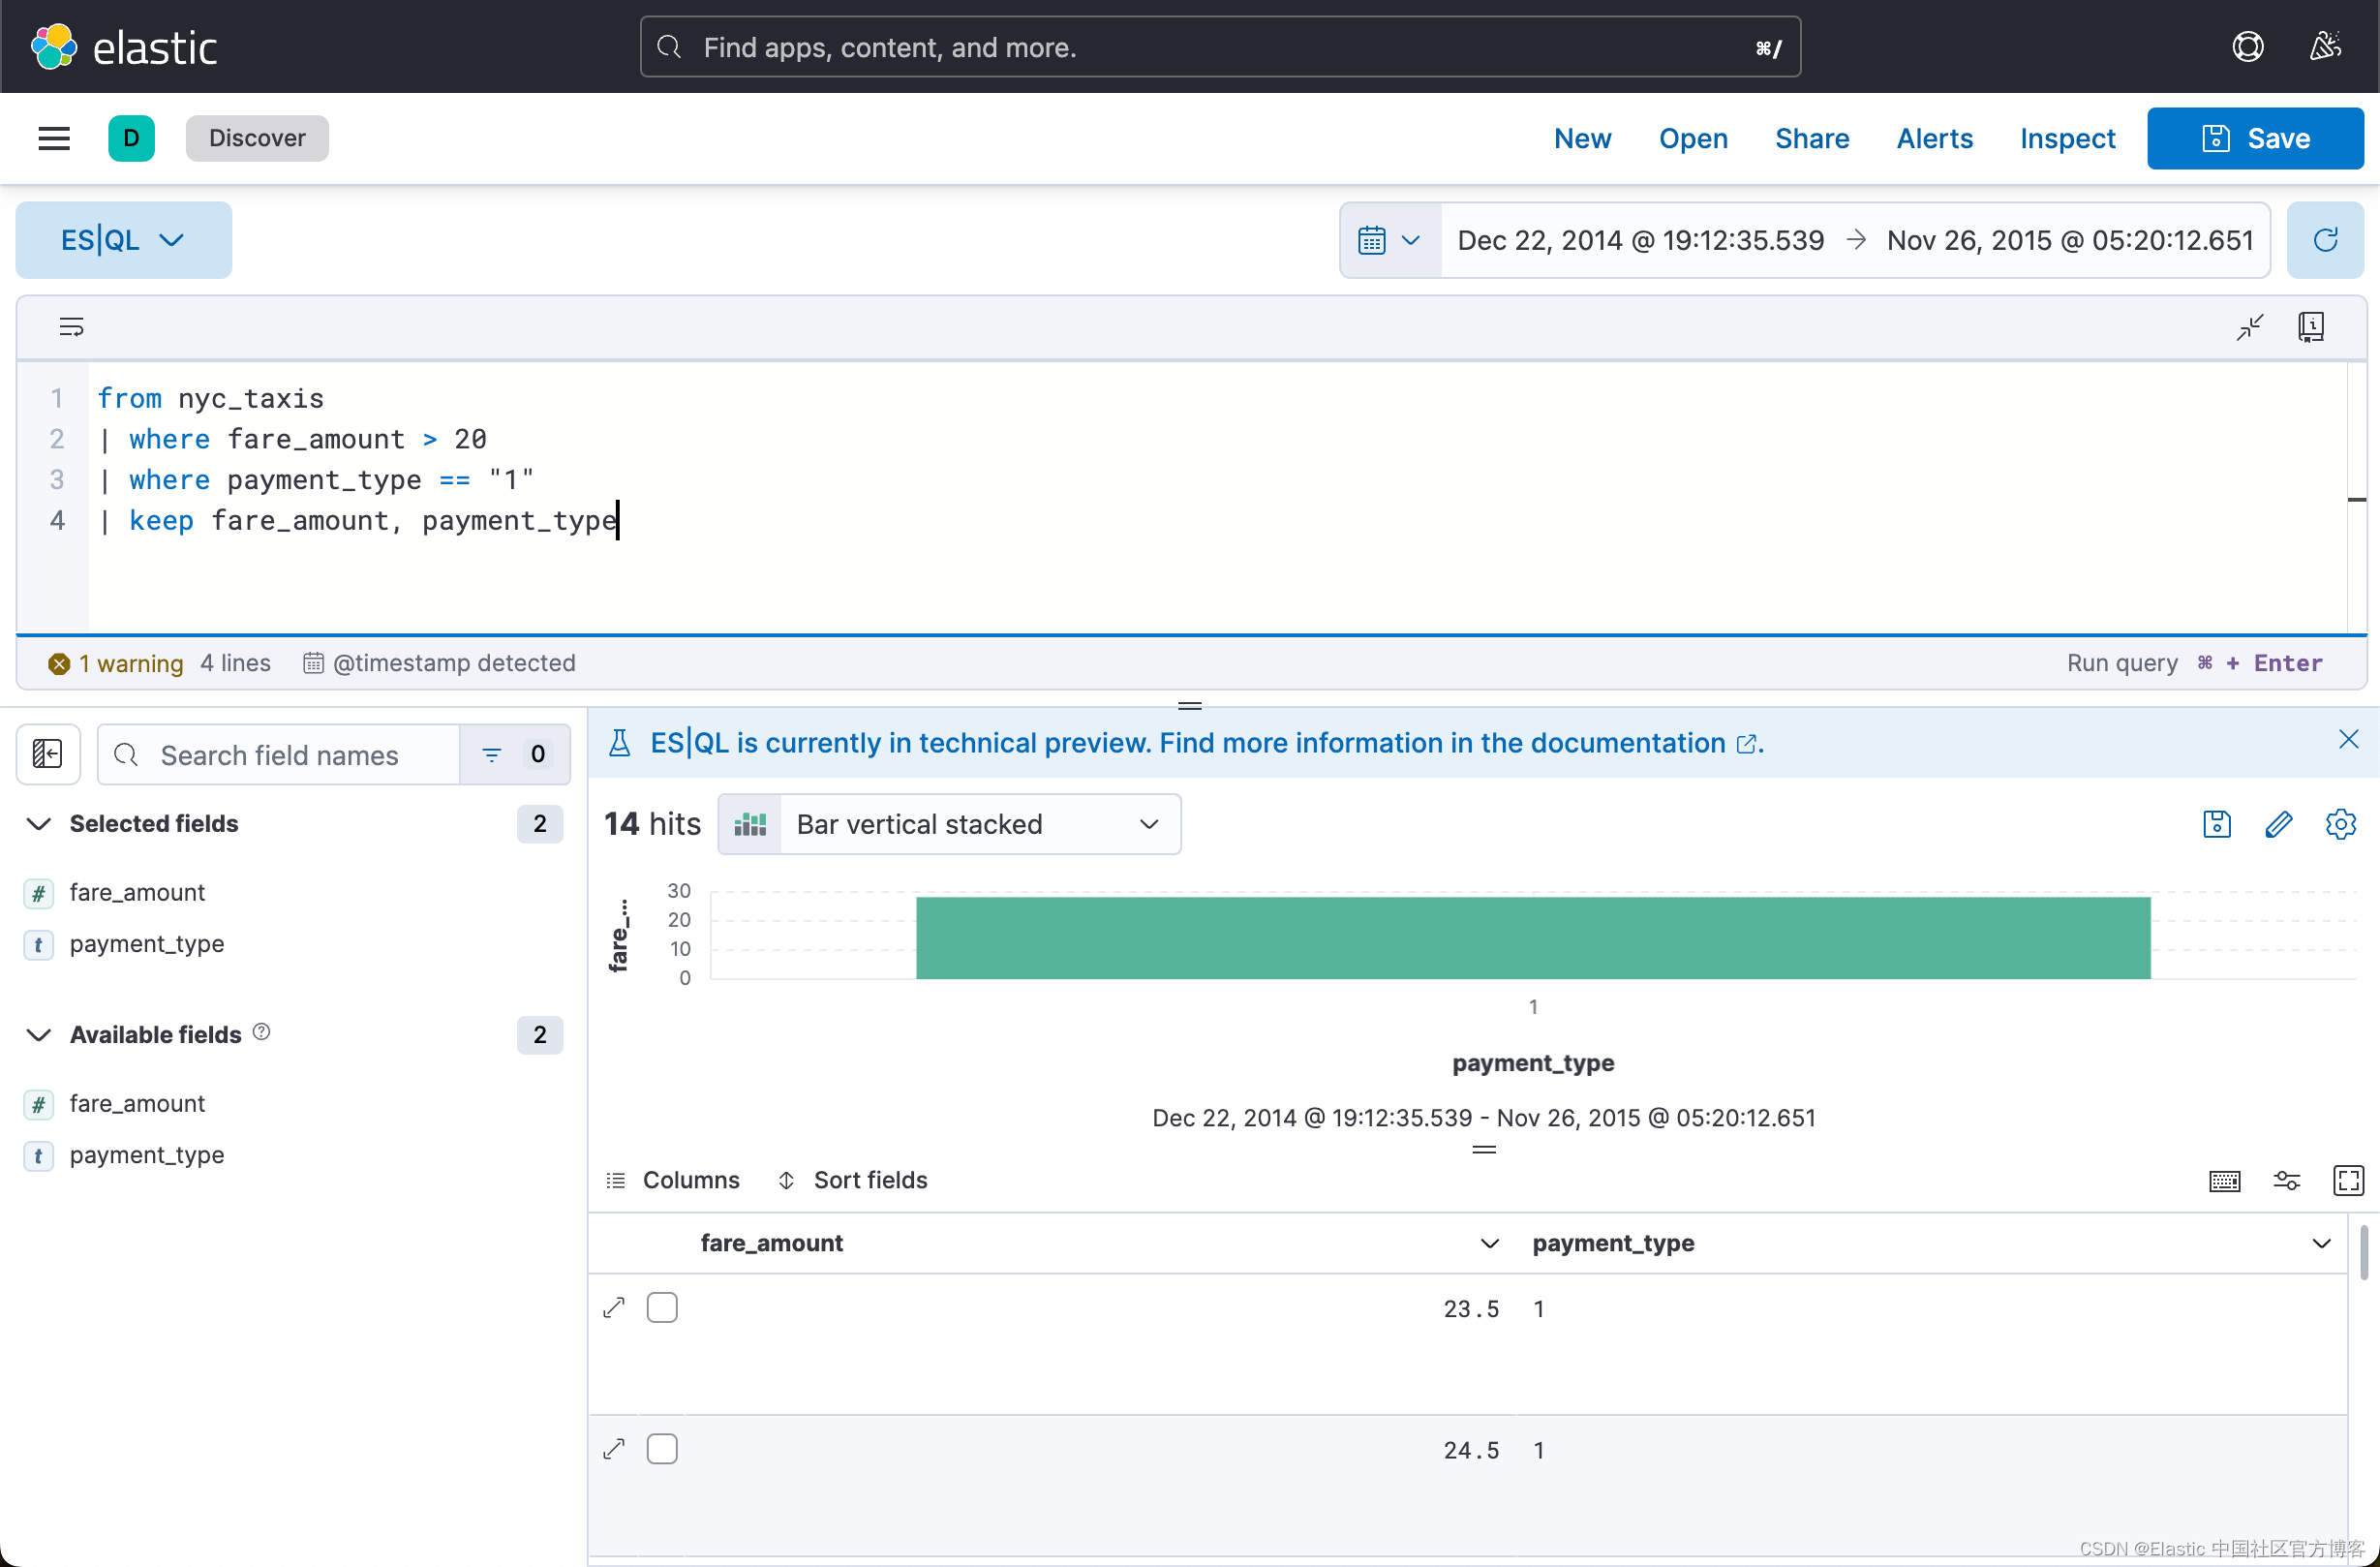
我们可以加入更多的过滤器:
from nyc_taxis
| where fare_amount > 20
| where payment_type == "1"
| where tip_amount > 5
| keep fare_amount, payment_type, tip_amount
我们可以通过 limit 来限制前面的 5 个结果(在上面有6个结果显示):

在上面我有有意把 limit 写成大写的 LIMIT。我们可以看出来,它实际上是没有任何的影响。也就是说关键词和大小写无关。我们还可以针对结果进行排序:
from nyc_taxis
| where fare_amount > 20
| where payment_type == "1"
| where tip_amount > 5
| LIMIT 5 | Sort tip_amount desc
| keep fare_amount, payment_type, tip_amount
上面的查询和下面的 DSL 查询是一样的:
GET nyc_taxis/_search
{"size": 5,"_source": ["fare_amount","payment_type","tip_amount"],"query": {"bool": {"filter": [{"range": {"fare_amount": {"gt": 20}}},{"term": {"payment_type": "1"}},{"range": {"tip_amount": {"gt": 5}}}]}},"sort": [{"tip_amount": {"order": "desc"}}]
}
很显然,我们的 ES|QL 语法更为简单明了。更重要的是,它的执行速度还更快!
接下来,我们来通过现有的字段来生成新的字段。这个也就是我们之前讲过的运行时字段(runtime fields)。我们想计算出来每英里的费用是多少:
from nyc_taxis
| eval cost_per_mile = total_amount/trip_distance
| keep total_amount, trip_distance, cost_per_mile
如果我们使用之前的 runtime fields 来实现,也就是这样的:
GET nyc_taxis/_search?filter_path=**.hits{"_source": false, "runtime_mappings": {"cost_per_mile": {"type": "double","script": {"source": "emit(doc['total_amount'].value/doc['trip_distance'].value)"}}},"fields": ["total_amount","trip_distance","cost_per_mile"]}
从上面的比较我们可以看出来,ES|QL 是非常简洁的,而且易于理解。
针对上面的查询,我们还可以添加过滤器来进行过滤:
from nyc_taxis
| eval cost_per_mile = total_amount/trip_distance
| where trip_distance > 10
| keep total_amount, trip_distance, cost_per_mile
我们接下来针对生成的字段 cost_per_mile 更进一步过滤:
from nyc_taxis
| eval cost_per_mile = total_amount/trip_distance
| where trip_distance > 10
| keep total_amount, trip_distance, cost_per_mile
| where cost_per_mile > 3.5
从显示的结果中,我们可以看出来,我们只有两个结果。
我们可更进一步进行排序:
from nyc_taxis
| eval cost_per_mile = total_amount/trip_distance
| where trip_distance > 10
| keep total_amount, trip_distance, cost_per_mile
| where cost_per_mile > 3.5
| sort cost_per_mile desc
我们接下来针对数据进行聚合:
聚合数据
我们想知道每个 payment_type 的最多 passenger_count 的数值是多少。我们可以使用 stats 来完成:
from nyc_taxis
| stats max_passengers=max(passenger_count) by payment_type
| keep payment_type, max_passengers
这个和如下我们以前的 DSL 相似:
GET nyc_taxis/_search?filter_path=aggregations
{"size": 0,"aggs": {"max_passengers": {"terms": {"field": "payment_type"},"aggs": {"max_count": {"max": {"field": "passenger_count"}}}}}
}
上面命令返回的结果是:
{"aggregations": {"max_passengers": {"doc_count_error_upper_bound": 0,"sum_other_doc_count": 0,"buckets": [{"key": "1","doc_count": 71,"max_count": {"value": 6}},{"key": "2","doc_count": 27,"max_count": {"value": 5}},{"key": "3","doc_count": 1,"max_count": {"value": 1}},{"key": "4","doc_count": 1,"max_count": {"value": 1}}]}}
}
很显然,我们的 ES|QL 查询会简单明了很多。
我们还可以添加其他的聚合,比如我们想得到每个 max_passengers 里支付种类 payment_type 的数量:
from nyc_taxis
| stats max_passengers=max(passenger_count) by payment_type
| keep payment_type, max_passengers
| stats type_count=count(payment_type) by max_passengers
如上所示,在显示区了,它只显示最近的一次的聚会情况。
我们还可以针对时间来做 date_histogram 聚合:
from nyc_taxis
| eval bucket=AUTO_BUCKET(@timestamp, 12, "2014-12-22T00:00:00.00Z", "2015-11-26T00:00:00.00Z")
| stats count(*) by bucket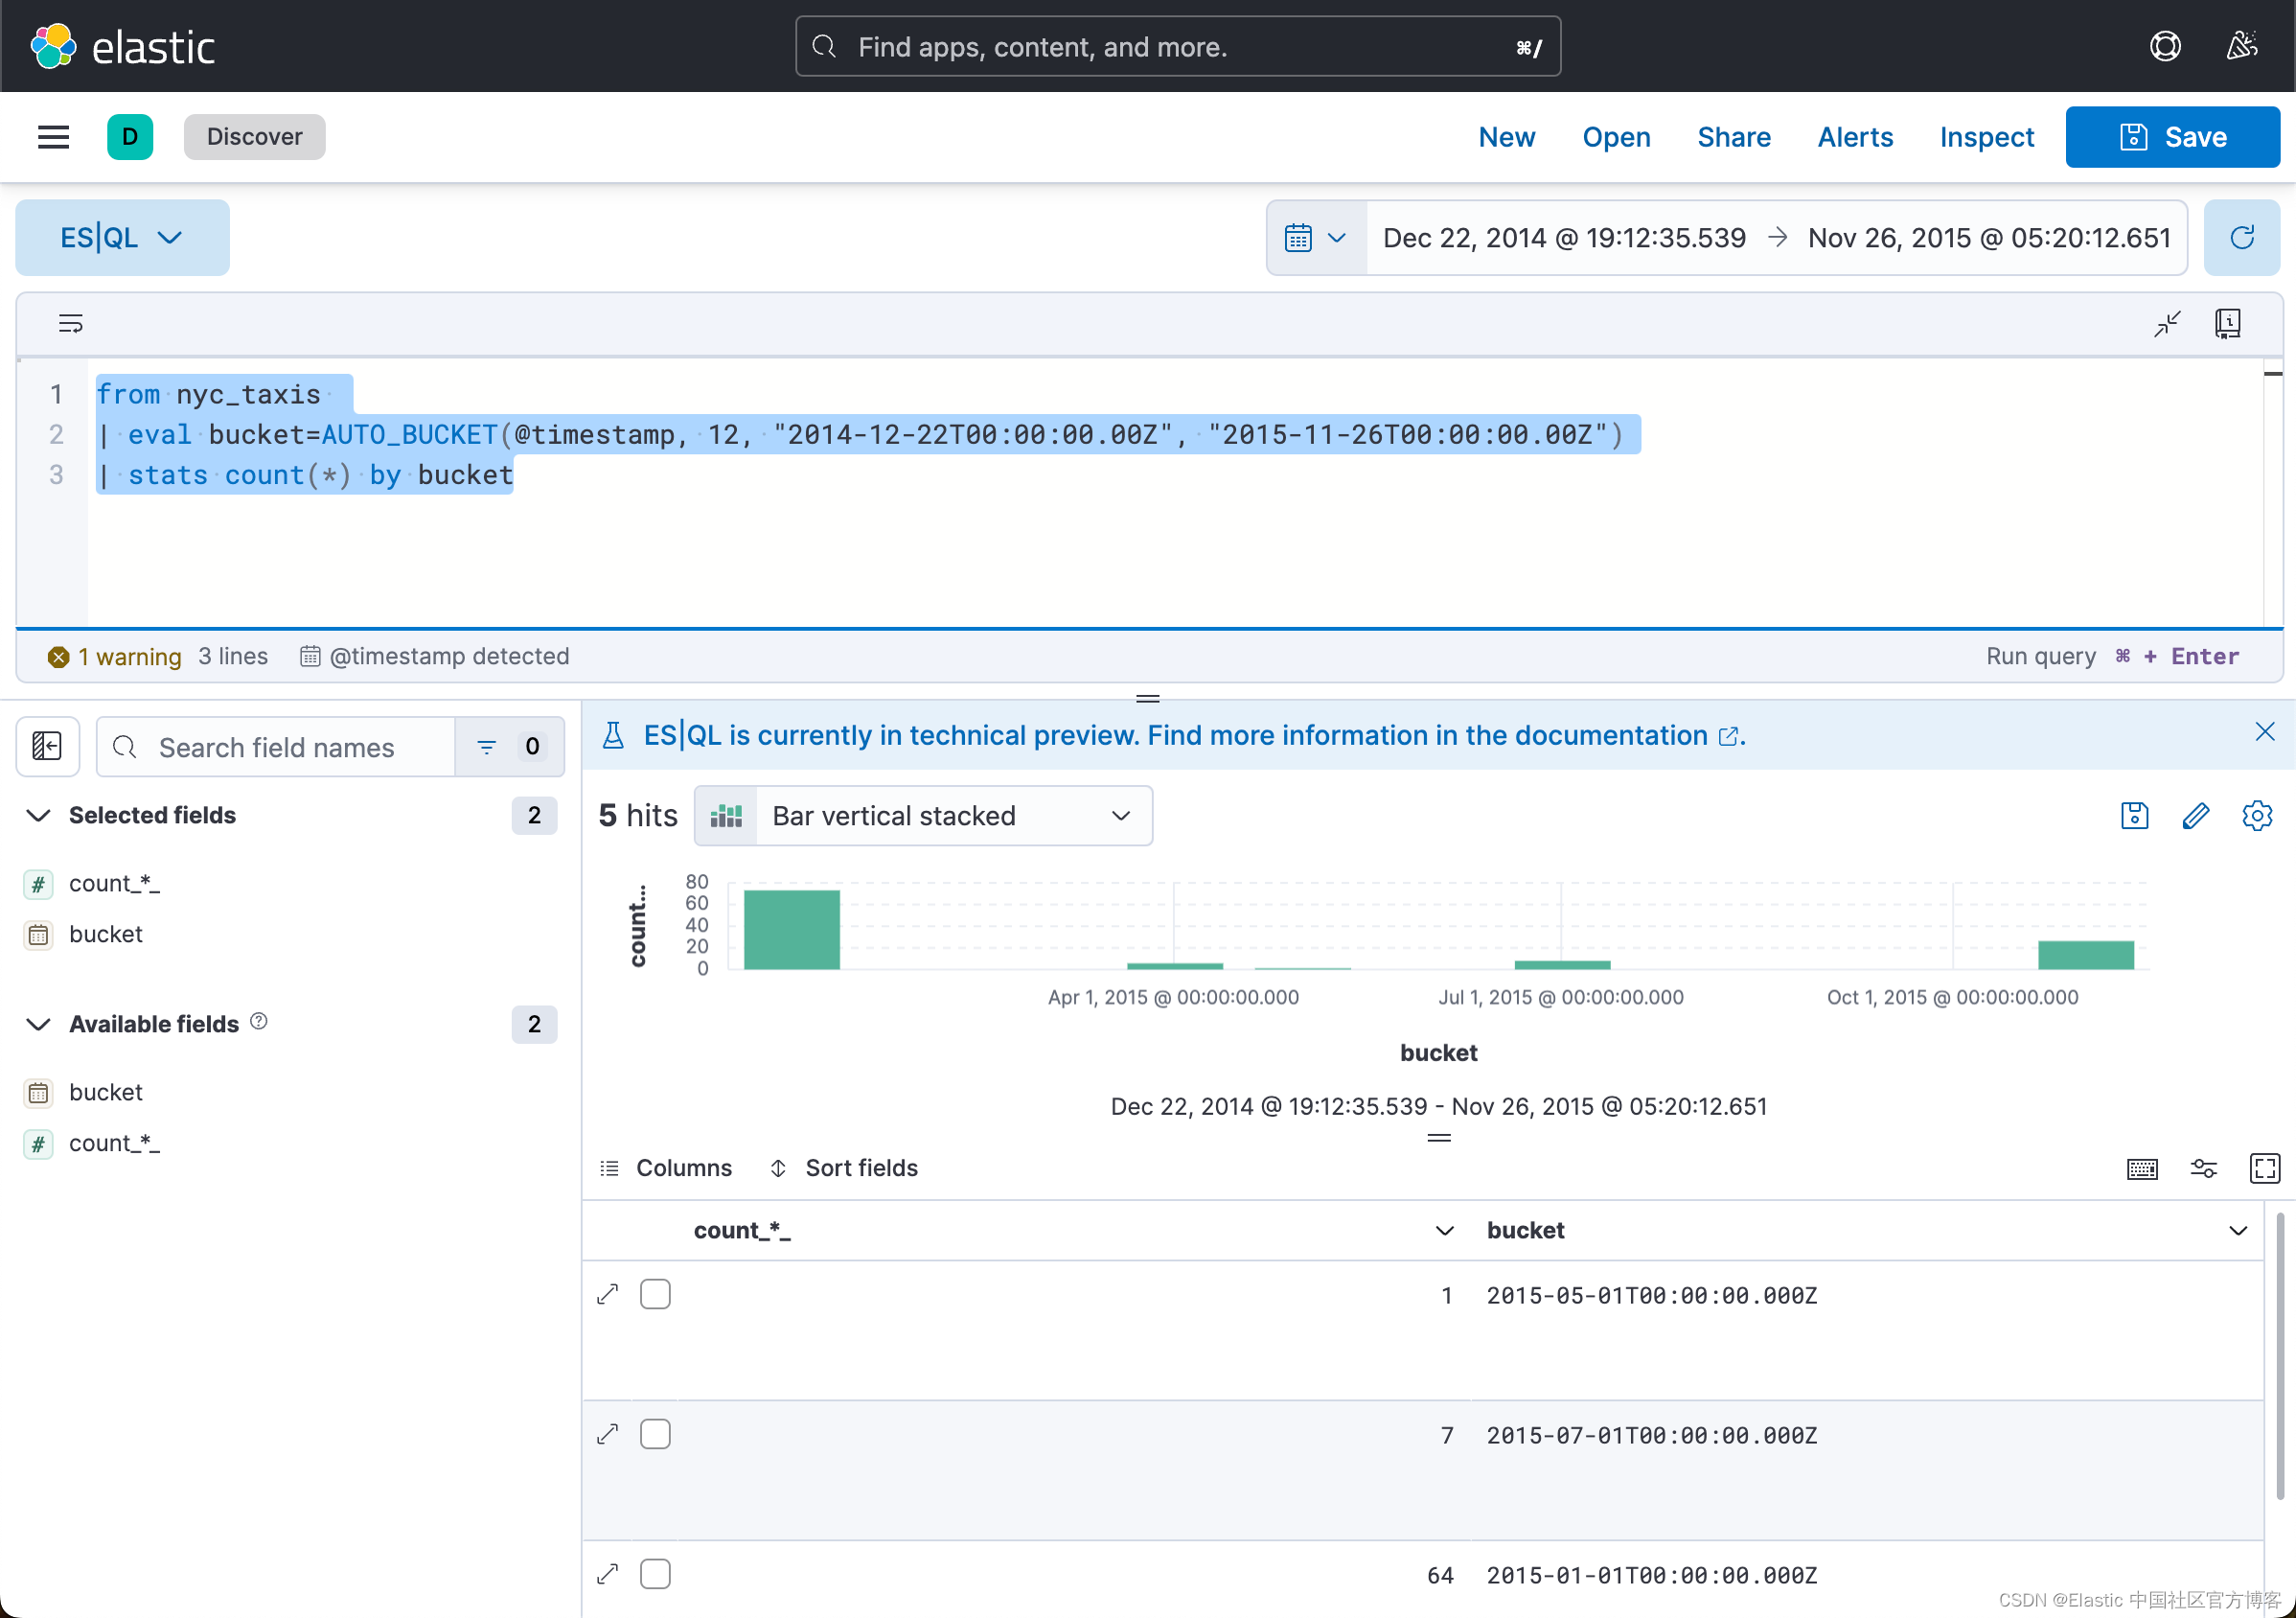
这个和我们之前的如下 DSL 相似:
GET nyc_taxis/_search?filter_path=aggregations
{"size": 0,"aggs": {"monthly_count": {"date_histogram": {"field": "@timestamp","fixed_interval": "30d"}}}
}
我们可以针对 payment_types 进行统计:
from nyc_taxis
| stats payment_types = count(*) by payment_type
| sort payment_types desc
这个和 DSL 的如下统计类似:
GET nyc_taxis/_search?filter_path=aggregations
{"size":0,"aggs": {"payment_types": {"terms": {"field": "payment_type"}}}
}
在 Kibana 中进行可视化
我们也可以使用 ES|QL 在 可视化中进行使用:
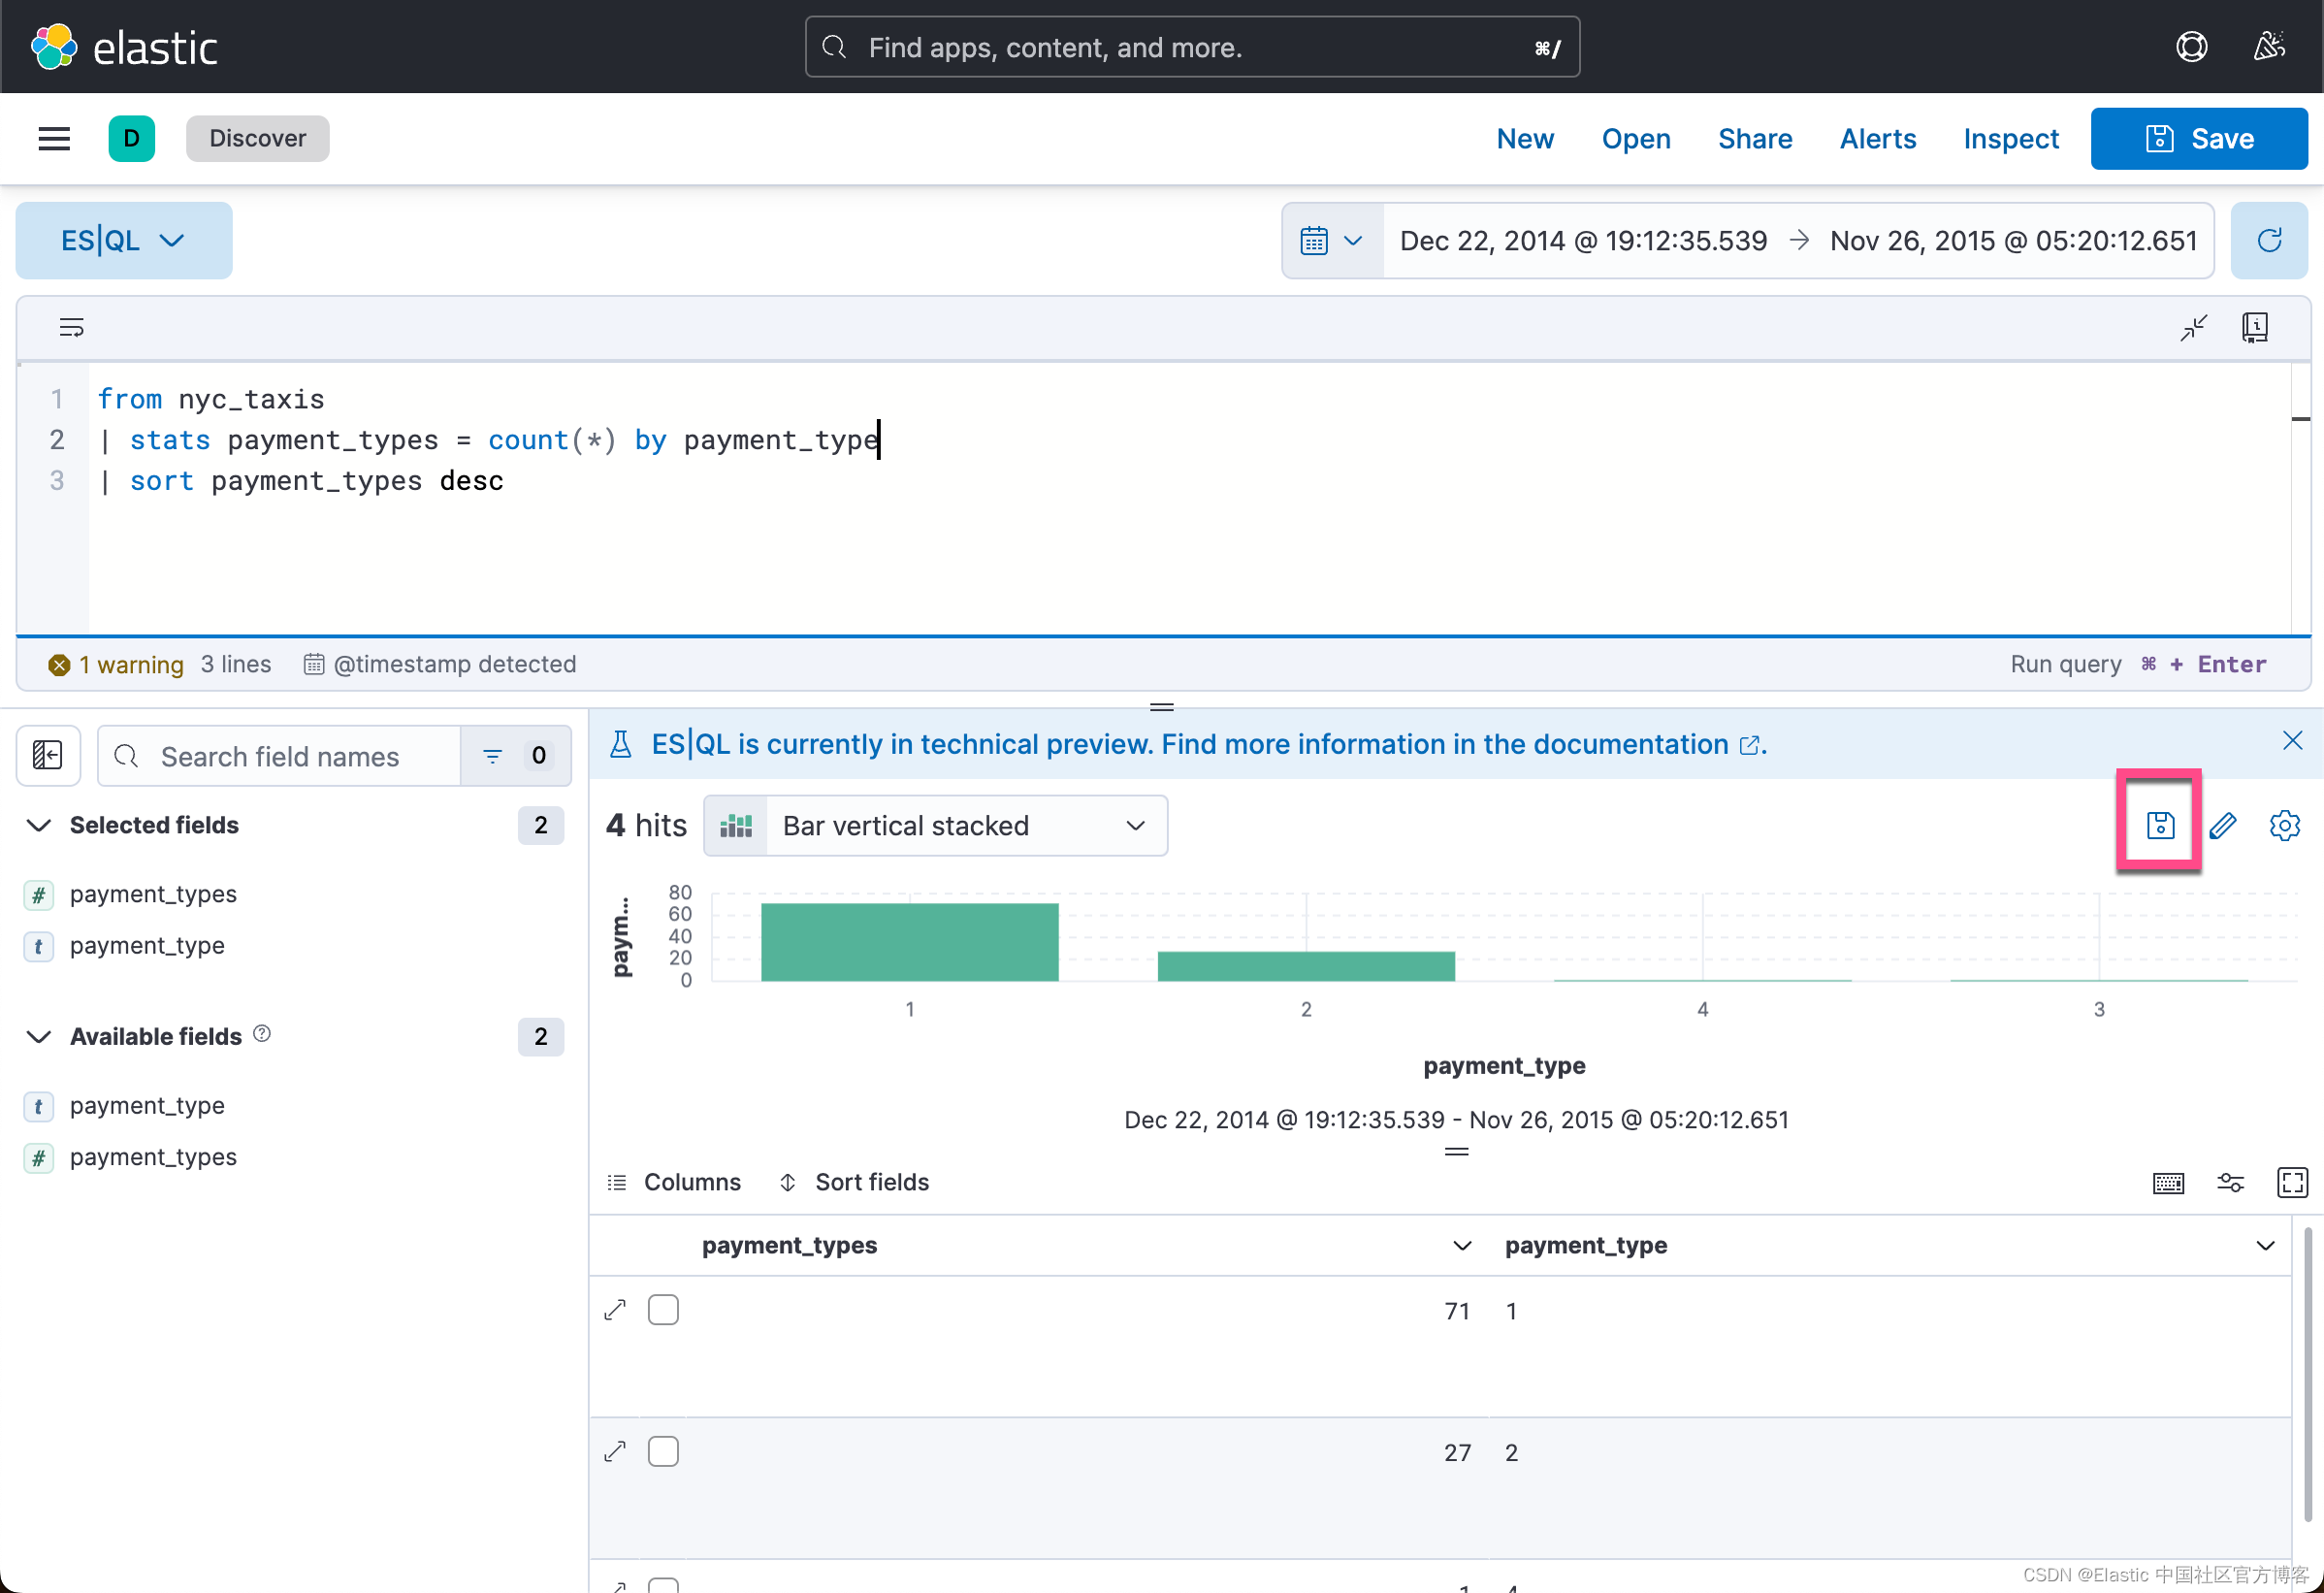
我们可以自己在 Discover 中生成相应的可视化。点击上面的保存图标:


这样就很方便地生成了我们的可视化。

我们还可以对它进行编辑:
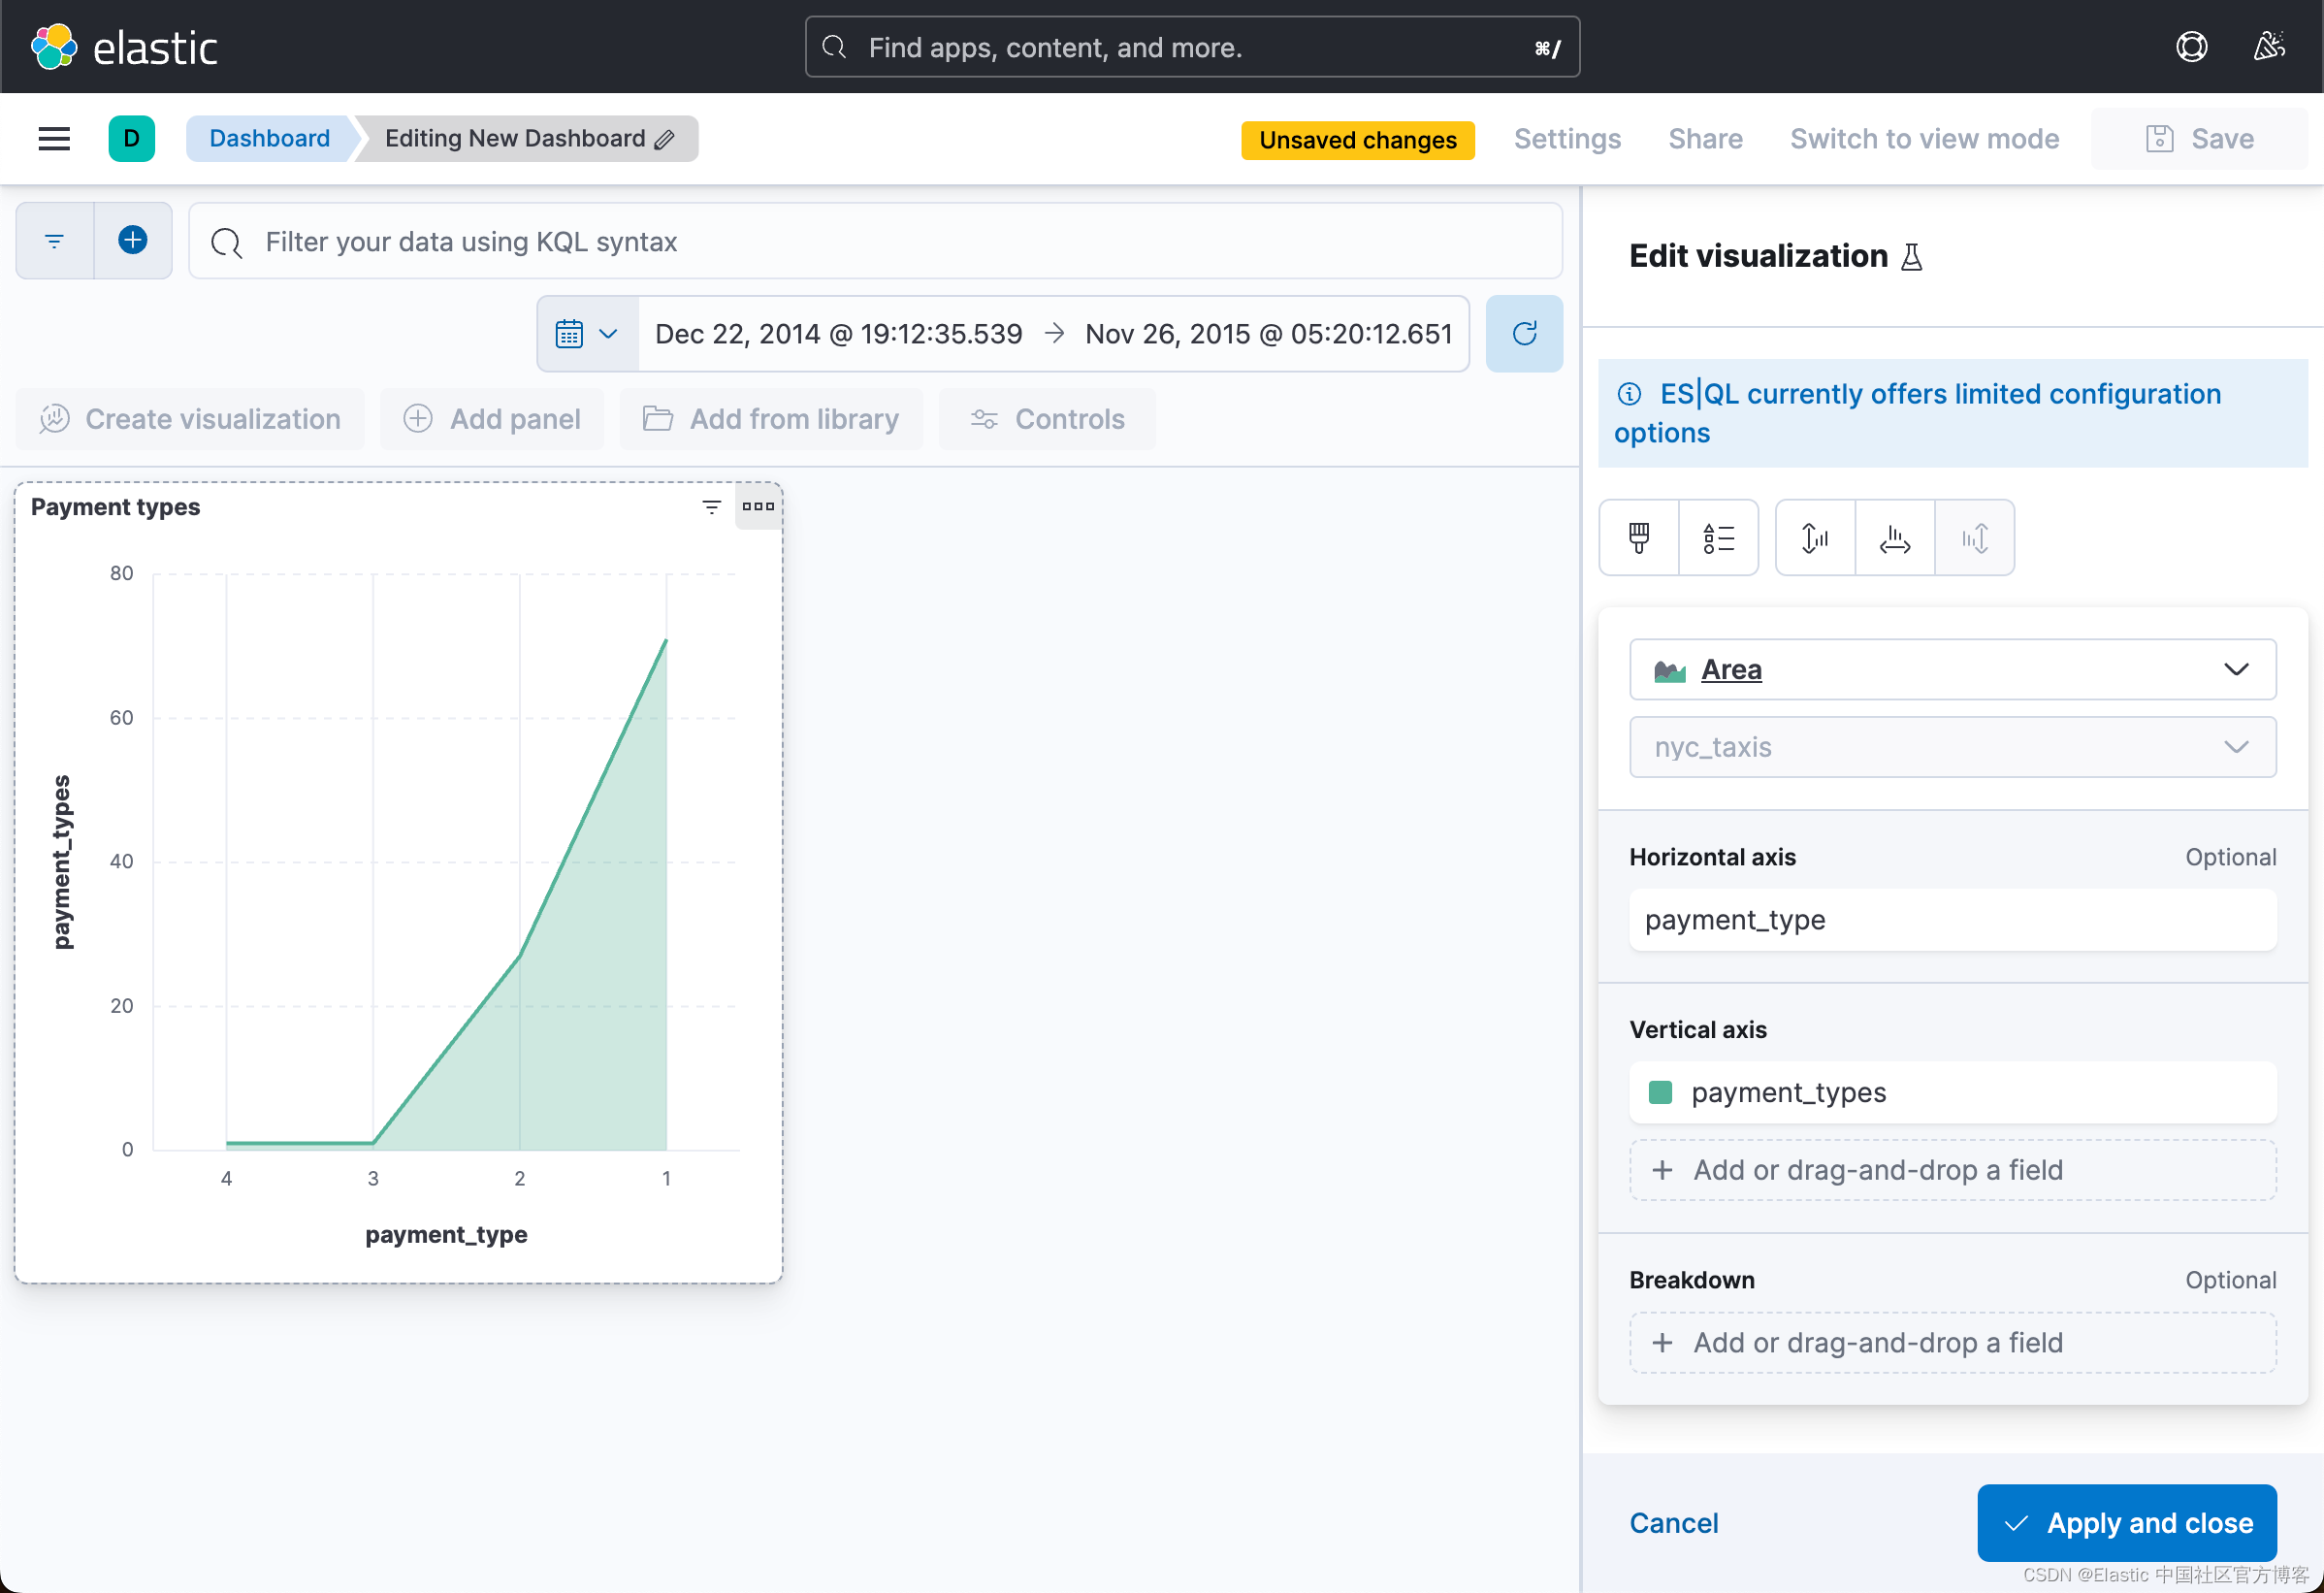
好了,今天就写到这里。希望我们都学到如何使用 ES|QL 这个工具在未来我们的工作中提供效率。
![[RK3568][Android12.0]--- 系统自带预置第三方APK方法](https://img-blog.csdnimg.cn/6f3cae0cf875407c8e13facb712b5f4d.png)


