目录
- 1. 前言
- 2. 项目结构
- 3. 详细介绍
- 3.1 main.py
- 3.2 GetModel.py
- 3.3 GetData.py
- 3.4 ProcessData.py
- 3.5天气网.html
- 4. 成果展示
1. 前言
本文介绍了天气预测数据分析及可视化的实现过程使用joblib导入模型和自定义模块GetModel获取模型,输出模型的MAE。使用pyecharts库进行天气数据的可视化,展示南京当日天气数据的表格。总体来说,该文叙述通过调用自定义模块和第三方库,获取天气数据、进行模型预测,并使用 pyecharts 实现了可视化,展示了南京的实时天气、未来一周的天气趋势以及全国各省会城市今日的天气情况。
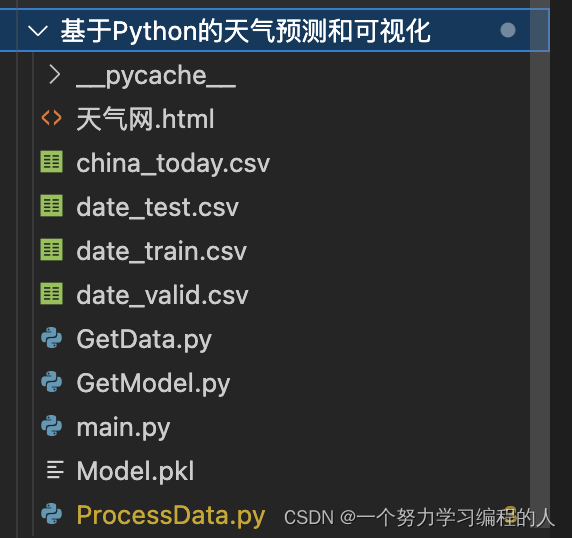
2. 项目结构
- 天气数据的来源
GetData文件使用python爬虫技术,爬取南京和全国的天气信息数据
爬取网站:http://tianqi.2345.com/wea_history/58238.htm
ProcessDate文件对爬取的天气数据进行了预处理
几个CSV文件保存的是爬取后并经过处理的数据- 天气数据的预测
GetModel文件通过训练预测模型来预测长春近一周的天气,该文件利用Joblib将模型保存到本地
Main文件是项目主文件,通过运行该文件即可运行整个项目,该文件前部分获取保存到本地的预测模型来进行预测,并将预测结果打印到控制台- 天气数据的可视化
Main文件后部分实现了天气数据的可视化
3. 详细介绍
3.1 main.py
import joblib
import datetime as DT
import GetModelfrom pyecharts.charts import Bar, Grid, Line, Tab
from pyecharts.components import Table
from pyecharts.options import ComponentTitleOpts
from pyecharts.charts import Map
from pyecharts import options as opts# 训练并保存模型并返回MAE
import ProcessData
import GetData#import GetModel
r = GetModel.getModel()
print("MAE:", r[0])
# 读取保存的模型
model = joblib.load('Model.pkl')# 最终预测结果
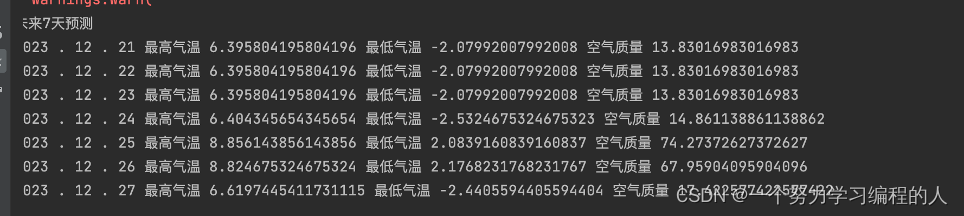
preds = model.predict(r[1])print("未来7天预测")
for a in range(1, 8):#import datetime as DTtoday = DT.datetime.now()time = (today + DT.timedelta(days=a)).date()print(time.year, '.', time.month, '.', time.day,'最高气温', preds[a][0],'最低气温', preds[a][1],"空气质量", preds[a][2],)'''
数据可视化代码
通过爬虫获取到的天气信息,利用pyecharts框架来实现绘图功能,实现天气的可视化
''''''
可视化当日南京天气数据
'''
# 获取当日南京天气数据
today_data = GetData.getToday(58238)
headers_ = ["日期", "最高温", "最低温", "天气", "风力风向", "空气质量指数"]
rows_ = [[today_data['日期'].values[0], today_data['最高温'].values[0], today_data['最低温'].values[0],today_data['天气'].values[0], today_data['风力风向'].values[0], today_data['空气质量指数'].values[0]],
]
def table_main() ->Table:c=(Table().add(headers_, rows_).set_global_opts(title_opts=ComponentTitleOpts(title="", subtitle="")))return c'''
可视化当日南京近一周的天气质量和气温
'''
# 获取最近七天的天气数据
week_data=GetData.getWeek(58238)
# 最近南京一周的天气和空气
airs = ProcessData.setAir(week_data)
low_temperature = ProcessData.setLowTemp(week_data)
high_temperature = ProcessData.setHighTemp(week_data)def grid_week() -> Grid:x_data = ["前七天", "前六天", "前五天", "前四天", "前三天", "前两天", "前一天"]bar = (Bar().add_xaxis(x_data).add_yaxis("最高温",high_temperature,yaxis_index=0,color="#d14a61",).add_yaxis("最低温",low_temperature,yaxis_index=1,color="#5793f3",).extend_axis(yaxis=opts.AxisOpts(name="最高温",type_="value",min_=-30,max_=40,position="right",axisline_opts=opts.AxisLineOpts(linestyle_opts=opts.LineStyleOpts(color="#d14a61")),axislabel_opts=opts.LabelOpts(formatter="{value} °C"),)).extend_axis(yaxis=opts.AxisOpts(type_="value",name="天气质量指数",min_=0,max_=300,position="left",axisline_opts=opts.AxisLineOpts(linestyle_opts=opts.LineStyleOpts(color="#675bba")),axislabel_opts=opts.LabelOpts(formatter="{value}"),splitline_opts=opts.SplitLineOpts(is_show=True, linestyle_opts=opts.LineStyleOpts(opacity=1)),)).set_global_opts(yaxis_opts=opts.AxisOpts(name="最低温",min_=-30,max_=40,position="right",offset=80,axisline_opts=opts.AxisLineOpts(linestyle_opts=opts.LineStyleOpts(color="#5793f3")),axislabel_opts=opts.LabelOpts(formatter="{value} °C"),),title_opts=opts.TitleOpts(title=""),tooltip_opts=opts.TooltipOpts(trigger="axis", axis_pointer_type="cross"),))line = (Line().add_xaxis(x_data).add_yaxis("天气质量指数 ""优(0~50) 良(51~100) 轻度(101~150) 中度(151~200) 重度(201~300)",airs,yaxis_index=2,color="#675bba",label_opts=opts.LabelOpts(is_show=False),))bar.overlap(line)return Grid().add(bar, opts.GridOpts(pos_left="5%", pos_right="20%"), is_control_axis_index=True)'''
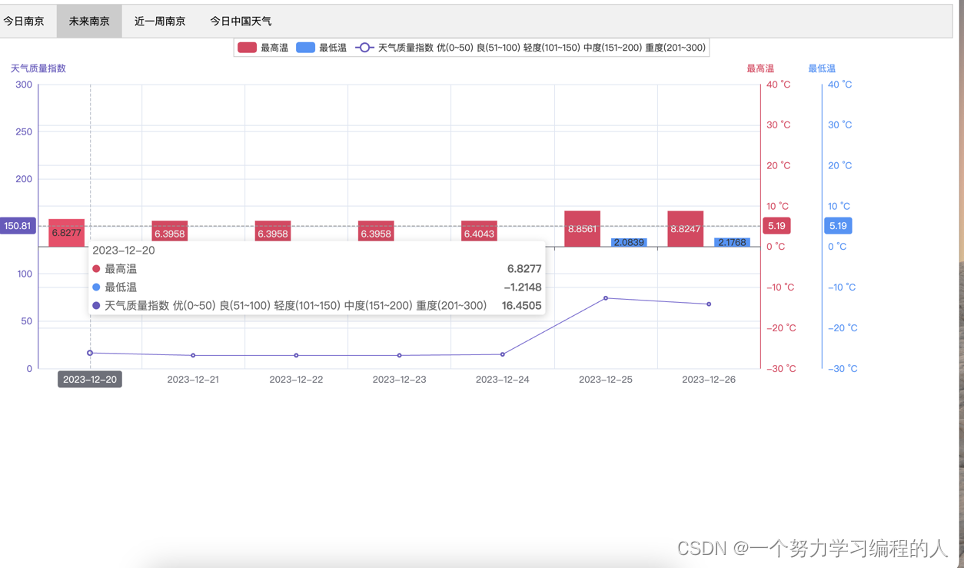
可视化预测南京的天气
'''# 预测南京一周的天气和空气
predict_airs=[]
predict_low_temperature=[]
predict_high_temperature=[]
x_data=[]
for i in range(0,7):predict_high_temperature.append(round(preds[i][0],4))predict_low_temperature.append(round(preds[i][1],4))predict_airs.append(round(preds[i][2],4))x_data.append((today + DT.timedelta(days=i)).date())def grid_week_predict() -> Grid:bar = (Bar().add_xaxis(x_data).add_yaxis("最高温",predict_high_temperature,yaxis_index=0,color="#d14a61",).add_yaxis("最低温",predict_low_temperature,yaxis_index=1,color="#5793f3",).extend_axis(yaxis=opts.AxisOpts(name="最高温",type_="value",min_=-30,max_=40,position="right",axisline_opts=opts.AxisLineOpts(linestyle_opts=opts.LineStyleOpts(color="#d14a61")),axislabel_opts=opts.LabelOpts(formatter="{value} °C"),)).extend_axis(yaxis=opts.AxisOpts(type_="value",name="天气质量指数",min_=0,max_=300,position="left",axisline_opts=opts.AxisLineOpts(linestyle_opts=opts.LineStyleOpts(color="#675bba")),axislabel_opts=opts.LabelOpts(formatter="{value}"),splitline_opts=opts.SplitLineOpts(is_show=True, linestyle_opts=opts.LineStyleOpts(opacity=1)),)).set_global_opts(yaxis_opts=opts.AxisOpts(name="最低温",min_=-30,max_=40,position="right",offset=80,axisline_opts=opts.AxisLineOpts(linestyle_opts=opts.LineStyleOpts(color="#5793f3")),axislabel_opts=opts.LabelOpts(formatter="{value} °C"),),title_opts=opts.TitleOpts(title=""),tooltip_opts=opts.TooltipOpts(trigger="axis", axis_pointer_type="cross"),))line = (Line().add_xaxis(x_data).add_yaxis("天气质量指数 ""优(0~50) 良(51~100) 轻度(101~150) 中度(151~200) 重度(201~300)",predict_airs,yaxis_index=2,color="#675bba",label_opts=opts.LabelOpts(is_show=False),))bar.overlap(line)return Grid().add(bar, opts.GridOpts(pos_left="5%", pos_right="20%"), is_control_axis_index=True)'''
获取全国各省会城市今日的天气情况
'''
china_today = GetData.getChinaToday()
china_today.to_csv("china_today.csv")def setData(str,i):return china_today[i:i+1][str].values[0]
provinces = ["黑龙江","内蒙古", "吉林", "辽宁", "河北","天津","山西", "陕西","甘肃","宁夏", "青海","新疆", "西藏", "四川", "重庆", "山东", "河南","江苏", "安徽","湖北", "浙江", "福建", "江西", "湖南", "贵州","广西", "海南","上海","广东","云南","台湾"
]
rows=[]
for i in range(0,31):rows.append([provinces[i],setData('最低温',i),setData('最高温',i),setData('天气',i),setData('风力风向',i)])def today_china_table() ->Table:c=(Table().add(["省份","最低温","最高温", "天气", "风力风向"], rows).set_global_opts(title_opts=ComponentTitleOpts(title="今日全国各省会城市的天气信息表", subtitle="")))return cchina_airs = ProcessData.setAir(china_today)
airs_list=[]
for i in range(0,31):airs_list.append(china_airs[i])# 分页图的标题
tab = Tab()
tab.add(table_main(), "今日南京")
tab.add(grid_week_predict(), "未来南京")
tab.add(grid_week(), "近一周南京")
tab.add(today_china_table(), "今日中国天气")
tab.render("天气网.html")'''all_high_t = []all_low_t = []all_air = []all_high_t.append(preds[a][0])all_low_t.append(preds[a][1])all_air.append(preds[a][2])
temp = {"最高温": all_high_t, "最低温": all_low_t, "空气质量": all_air}
# 绘画折线图
plt.plot(range(1, 7), temp["最高温"], color="red", label="high_t")
plt.plot(range(1, 7), temp["最低温"], color="blue", label="low_t")
plt.legend() # 显示图例
plt.ylabel("Temperature(°C)")
plt.xlabel("day")
# 显示
plt.show()
plt.plot(range(1, 7), temp["空气质量"], color="black", label="air")
plt.legend()
plt.ylabel(" ")
plt.xlabel("day")
plt.show()
'''
3.2 GetModel.py
from sklearn.ensemble import RandomForestRegressor
import joblib
from sklearn.metrics import mean_absolute_error
import ProcessData# 训练并保存模型
def getModel(a="Model.pkl"):# 获取测试集、训练集、验证集[X_train, X_valid, y_train, y_valid, X_test] = ProcessData.ProcessData()# 随机树森林模型model = RandomForestRegressor(random_state=0, n_estimators=1001)# 训练模型model.fit(X_train, y_train)# 预测模型preds = model.predict(X_valid)# 用MAE评估score = mean_absolute_error(y_valid, preds)# 保存模型到本地joblib.dump(model, a)# 返回MAEreturn [score, X_test]
3.3 GetData.py
import requests
import pandas as pd
import datetime# 提供年份和月份,爬取对应的的表格数据
url = "http://tianqi.2345.com/Pc/GetHistory"
headers = {"User-Agent":"""Mozilla/5.0 (Windows NT 10.0; Win64; x64) AppleWebKit/537.36 (KHTML, like Gecko) Chrome/101.0.4951.41 Safari/537.36 Edg/101.0.1210.32"""
}def craw_table(id,year,month):params = {"areaInfo[areaId]": id,"areaInfo[areaType]": 2,"date[year]": year,"date[month]": month}resq = requests.get(url, headers=headers, params=params)data = resq.json()["data"]# data framedf = pd.read_html(data)[0]return df# 输入城市id,爬取该城市今日的天气数据
def getToday(id):# 获取当前年份和月份today = datetime.datetime.today()year = today.yearmonth = today.month# 获取当日南京天气数据month_data =craw_table(id, year, month)return month_data.tail(1)# 输入城市id,爬取该城市近七周的天气数据
def getWeek(id):# 获取当前年份和月份today = datetime.datetime.today()year = today.yearmonth = today.month# 获取当日南京天气数据month_data =craw_table(id, year, month)return month_data.tail(7)# 爬取全国各个省会城市的今日的天气数据
def getChinaToday():ids=[50953, 53463,58238,54342,53698,54527,53772,57036 ,52889,53614,52866,51463,55591, 56294, 57516,54823,57083,58238, 58321, 57494, 58457,58847,58606,57687,57816 ,59431,59758 ,58362 ,59287,56778,59554]list=[]for i in ids:df=getToday(i)list.append(df)return pd.concat(list).reset_index(drop=True)# 获取南京最近3年的天气数据,用于预测
def getYears():today = datetime.datetime.today()df_list = []for year in range(today.year-5, today.year):for month in range(1, 13):df = craw_table(58238,year, month)df_list.append(df)for month in range(1,today.month+1):df = craw_table(58238, today.year, month)df_list.append(df)# 多年数据合并return pd.concat(df_list).reset_index(drop=True)# 传入一个时间范围,获取某个时间范围的天气数据
def getPredictDate(year0,month0,day0,year1,month1,day1):id=58238date_list=[]if month0!=month1:date0=craw_table(id,year0,month0)date_ago=date0[day0-1:]date1 = craw_table(id,year1, month1)date_pre = date1[:day1]date_list.append(date_ago)date_list.append(date_pre)date=pd.concat(date_list).reset_index(drop=True)else:date0 = craw_table(id, year0, month0)date=date0[day0-1:day1]return date
3.4 ProcessData.py
from calendar import isleapimport pandas as pd
from sklearn.model_selection import train_test_split
from sklearn.impute import SimpleImputer
import GetData
import datetime as DT
'''
处理预测数据
'''def setAir(week_data):airs = []for i in week_data['空气质量指数']:if isinstance(i, float) or pd.isna(i):airs.append(7)  # 或者你偏好的缺失数据的任何默认值elif '-' in str(i):airs.append(7)else:i = str(i).split(' ')[0]airs.append(int(i))return airs# 气温数据处理:去掉数据的单位°并把数据变为整形
def setHighTemp(week_data):temperature = []for i in week_data['最高温']:i = i.split('°')[0]temperature.append(int(i))return temperaturedef setLowTemp(week_data):temperature = []for i in week_data['最低温']:i = i.split('°')[0]temperature.append(int(i))return temperature# 处理天气数据,为天气状态编码
def setCondition(week_data):# 天气状况编码flag = []for StringData in week_data['最低温']:if '晴' in str(StringData):flag.append(1)elif '多云' in str(StringData):flag.append(2)elif '阴' in str(StringData):flag.append(3)elif '雨' in str(StringData):flag.append(4)elif '雪' in str(StringData):flag.append(5)elif '雾' in str(StringData) or '霾' in str(StringData):flag.append(6)elif  '扬沙' in str(StringData):flag.append(7)else:flag.append(-1)return flagdef process(date):date['最高温']=setHighTemp(date)date['最低温']=setLowTemp(date)date['空气质量指数']=setAir(date)date1=date.drop('天气', axis=1)date2=date1.drop('风力风向',axis=1)return date2#原来
def write(years, months,c):# 取现在日期today = DT.datetime.today()# 闰年片段st = isleap(today.year)week_ago = (today - DT.timedelta(days=months[0])).date()week_pre = (today + DT.timedelta(days=months[1])).date()if week_ago.month + week_pre.month == 3 or week_ago.month + week_pre.month == 5:if week_ago.month == 2 and not st == isleap(today.year - years[0]):if st:# 今年是,去年或未来不是,所以-1week_ago -= DT.timedelta(days=1)else:# 今年不是,去年或未来是,所以+1week_ago += DT.timedelta(days=1)# 爬取数据id =58238# 取到预处理后的用来预测的数据date0 = GetData.getPredictDate(week_ago.year-years[0],week_ago.month,week_ago.day,week_pre.year-years[1],week_pre.month,week_pre.day)date_=process(date0).set_index("日期")date_.to_csv(c)# 功能: 对用来预测的数据进行预处理def ProcessData():# 写入csvwrite([1,1], [14, 0], "date_train.csv")write([1,1],  [0, 14], "date_valid.csv")write([0,0], [14, 0], "date_test.csv")X_test = pd.read_csv("date_test.csv", index_col="日期", parse_dates=True)# 读取测试集和验证集X = pd.read_csv("date_train.csv", index_col="日期", parse_dates=True)y = pd.read_csv("date_valid.csv", index_col="日期", parse_dates=True)my_imputer = SimpleImputer()# train_test_split()是sklearn包的model_selection模块中提供的随机划分训练集和测试集的函数;# 使用train_test_split函数可以将原始数据集按照一定比例划分训练集和测试集对模型进行训练X_train, X_valid, y_train, y_valid = train_test_split(X, y, train_size=0.8, test_size=0.2, random_state=0)imputed_X_train = pd.DataFrame(my_imputer.fit_transform(X_train))imputed_X_valid = pd.DataFrame(my_imputer.transform(X_valid))imputed_X_train.columns = X_train.columnsimputed_X_valid.columns = X_valid.columnsimputed_y_train = pd.DataFrame(my_imputer.fit_transform(y_train))imputed_y_valid = pd.DataFrame(my_imputer.transform(y_valid))imputed_y_train.columns = y_train.columnsimputed_y_valid.columns = y_valid.columnsimputed_X_test = pd.DataFrame(my_imputer.fit_transform(X_test))# 返回分割后的数据集return [imputed_X_train, imputed_X_valid, imputed_y_train, imputed_y_valid, imputed_X_test]
3.5天气网.html
<!DOCTYPE html>
<html>
<head><meta charset="UTF-8"><title>Awesome-pyecharts</title><script type="text/javascript" src="https://assets.pyecharts.org/assets/v5/echarts.min.js"></script></head>
<body ><style>.tab {overflow: hidden;border: 1px solid #ccc;background-color: #f1f1f1;}.tab button {background-color: inherit;float: left;border: none;outline: none;cursor: pointer;padding: 12px 16px;transition: 0.3s;}.tab button:hover {background-color: #ddd;}.tab button.active {background-color: #ccc;}.chart-container {display: block;}.chart-container:nth-child(n+2) {display: none;}</style><div class="tab"><button class="tablinks" onclick="showChart(event, 'c95a7006653c463b87ea5f86fb2fa9d6')">今日南京</button><button class="tablinks" onclick="showChart(event, 'd51b7fb3725d442fafd9365201317690')">未来南京</button><button class="tablinks" onclick="showChart(event, '87f0e6e843f443f986ad5a3539b28a78')">近一周南京</button><button class="tablinks" onclick="showChart(event, '2e9b063085384e43805f0f24afc63b80')">今日中国天气</button></div><div class="box"><style>.fl-table {margin: 20px;border-radius: 5px;font-size: 12px;border: none;border-collapse: collapse;max-width: 100%;white-space: nowrap;word-break: keep-all;}.fl-table th {text-align: left;font-size: 20px;}.fl-table tr {display: table-row;vertical-align: inherit;border-color: inherit;}.fl-table tr:hover td {background: #00d1b2;color: #F8F8F8;}.fl-table td, .fl-table th {border-style: none;border-top: 1px solid #dbdbdb;border-left: 1px solid #dbdbdb;border-bottom: 3px solid #dbdbdb;border-right: 1px solid #dbdbdb;padding: .5em .55em;font-size: 15px;}.fl-table td {border-style: none;font-size: 15px;vertical-align: center;border-bottom: 1px solid #dbdbdb;border-left: 1px solid #dbdbdb;border-right: 1px solid #dbdbdb;height: 30px;}.fl-table tr:nth-child(even) {background: #F8F8F8;}</style><div id="c95a7006653c463b87ea5f86fb2fa9d6" class="chart-container" style=""><p class="title" style="font-size: 18px; font-weight:bold;" > </p><p class="subtitle" style="font-size: 12px;" > </p><table class="fl-table"><thead><tr><th>日期</th><th>最高温</th><th>最低温</th><th>天气</th><th>风力风向</th><th>空气质量指数</th></tr></thead><tbody><tr><td>2023-12-19 周二</td><td>1°</td><td>-3°</td><td>小雪~多云</td><td>西北风2级</td><td>66 良</td></tr></tbody>
</table></div><div id="d51b7fb3725d442fafd9365201317690" class="chart-container" style="width:900px; height:500px; "></div><script>document.getElementById('d51b7fb3725d442fafd9365201317690').style.width = document.getElementById('d51b7fb3725d442fafd9365201317690').parentNode.clientWidth + 'px';var chart_d51b7fb3725d442fafd9365201317690 = echarts.init(document.getElementById('d51b7fb3725d442fafd9365201317690'), 'white', {renderer: 'canvas'});var option_d51b7fb3725d442fafd9365201317690 = {"animation": true,"animationThreshold": 2000,"animationDuration": 1000,"animationEasing": "cubicOut","animationDelay": 0,"animationDurationUpdate": 300,"animationEasingUpdate": "cubicOut","animationDelayUpdate": 0,"aria": {"enabled": false},"color": ["#d14a61","#5793f3","#675bba","#5470c6","#91cc75","#fac858","#ee6666","#73c0de","#3ba272","#fc8452","#9a60b4","#ea7ccc"],"series": [{"type": "bar","name": "\u6700\u9ad8\u6e29","yAxisIndex": 0,"legendHoverLink": true,"data": [6.8277,6.3958,6.3958,6.3958,6.4043,8.8561,8.8247],"realtimeSort": false,"showBackground": false,"stackStrategy": "samesign","cursor": "pointer","barMinHeight": 0,"barCategoryGap": "20%","barGap": "30%","large": false,"largeThreshold": 400,"seriesLayoutBy": "column","datasetIndex": 0,"clip": true,"zlevel": 0,"z": 2,"label": {"show": true,"margin": 8}},{"type": "bar","name": "\u6700\u4f4e\u6e29","yAxisIndex": 1,"legendHoverLink": true,"data": [-1.2148,-2.0799,-2.0799,-2.0799,-2.5325,2.0839,2.1768],"realtimeSort": false,"showBackground": false,"stackStrategy": "samesign","cursor": "pointer","barMinHeight": 0,"barCategoryGap": "20%","barGap": "30%","large": false,"largeThreshold": 400,"seriesLayoutBy": "column","datasetIndex": 0,"clip": true,"zlevel": 0,"z": 2,"label": {"show": true,"margin": 8}},{"type": "line","name": "\u5929\u6c14\u8d28\u91cf\u6307\u6570 \u4f18(0~50) \u826f(51~100) \u8f7b\u5ea6(101~150) \u4e2d\u5ea6(151~200) \u91cd\u5ea6(201~300)","connectNulls": false,"xAxisIndex": 0,"yAxisIndex": 2,"symbolSize": 4,"showSymbol": true,"smooth": false,"clip": true,"step": false,"data": [["2023-12-20",16.4505],["2023-12-21",13.8302],["2023-12-22",13.8302],["2023-12-23",13.8302],["2023-12-24",14.8611],["2023-12-25",74.2737],["2023-12-26",67.959]],"hoverAnimation": true,"label": {"show": false,"margin": 8},"logBase": 10,"seriesLayoutBy": "column","lineStyle": {"show": true,"width": 1,"opacity": 1,"curveness": 0,"type": "solid"},"areaStyle": {"opacity": 0},"zlevel": 0,"z": 0}],"legend": [{"data": ["\u6700\u9ad8\u6e29","\u6700\u4f4e\u6e29","\u5929\u6c14\u8d28\u91cf\u6307\u6570 \u4f18(0~50) \u826f(51~100) \u8f7b\u5ea6(101~150) \u4e2d\u5ea6(151~200) \u91cd\u5ea6(201~300)"],"selected": {},"show": true,"padding": 5,"itemGap": 10,"itemWidth": 25,"itemHeight": 14,"backgroundColor": "transparent","borderColor": "#ccc","borderWidth": 1,"borderRadius": 0,"pageButtonItemGap": 5,"pageButtonPosition": "end","pageFormatter": "{current}/{total}","pageIconColor": "#2f4554","pageIconInactiveColor": "#aaa","pageIconSize": 15,"animationDurationUpdate": 800,"selector": false,"selectorPosition": "auto","selectorItemGap": 7,"selectorButtonGap": 10}],"tooltip": {"show": true,"trigger": "axis","triggerOn": "mousemove|click","axisPointer": {"type": "cross"},"showContent": true,"alwaysShowContent": false,"showDelay": 0,"hideDelay": 100,"enterable": false,"confine": false,"appendToBody": false,"transitionDuration": 0.4,"textStyle": {"fontSize": 14},"borderWidth": 0,"padding": 5,"order": "seriesAsc"},"xAxis": [{"show": true,"scale": false,"nameLocation": "end","nameGap": 15,"gridIndex": 0,"inverse": false,"offset": 0,"splitNumber": 5,"minInterval": 0,"splitLine": {"show": true,"lineStyle": {"show": true,"width": 1,"opacity": 1,"curveness": 0,"type": "solid"}},"data": ["2023-12-20","2023-12-21","2023-12-22","2023-12-23","2023-12-24","2023-12-25","2023-12-26"]}],"yAxis": [{"name": "\u6700\u4f4e\u6e29","show": true,"scale": false,"nameLocation": "end","nameGap": 15,"gridIndex": 0,"axisLine": {"show": true,"onZero": true,"onZeroAxisIndex": 0,"lineStyle": {"show": true,"width": 1,"opacity": 1,"curveness": 0,"type": "solid","color": "#5793f3"}},"axisLabel": {"show": true,"margin": 8,"formatter": "{value} \u00b0C"},"inverse": false,"position": "right","offset": 80,"splitNumber": 5,"min": -30,"max": 40,"minInterval": 0,"splitLine": {"show": true,"lineStyle": {"show": true,"width": 1,"opacity": 1,"curveness": 0,"type": "solid"}}},{"type": "value","name": "\u6700\u9ad8\u6e29","show": true,"scale": false,"nameLocation": "end","nameGap": 15,"gridIndex": 0,"axisLine": {"show": true,"onZero": true,"onZeroAxisIndex": 0,"lineStyle": {"show": true,"width": 1,"opacity": 1,"curveness": 0,"type": "solid","color": "#d14a61"}},"axisLabel": {"show": true,"margin": 8,"formatter": "{value} \u00b0C"},"inverse": false,"position": "right","offset": 0,"splitNumber": 5,"min": -30,"max": 40,"minInterval": 0,"splitLine": {"show": true,"lineStyle": {"show": true,"width": 1,"opacity": 1,"curveness": 0,"type": "solid"}}},{"type": "value","name": "\u5929\u6c14\u8d28\u91cf\u6307\u6570","show": true,"scale": false,"nameLocation": "end","nameGap": 15,"gridIndex": 0,"axisLine": {"show": true,"onZero": true,"onZeroAxisIndex": 0,"lineStyle": {"show": true,"width": 1,"opacity": 1,"curveness": 0,"type": "solid","color": "#675bba"}},"axisLabel": {"show": true,"margin": 8,"formatter": "{value}"},"inverse": false,"position": "left","offset": 0,"splitNumber": 5,"min": 0,"max": 300,"minInterval": 0,"splitLine": {"show": true,"lineStyle": {"show": true,"width": 1,"opacity": 1,"curveness": 0,"type": "solid"}}}],"title": [{"show": true,"target": "blank","subtarget": "blank","padding": 5,"itemGap": 10,"textAlign": "auto","textVerticalAlign": "auto","triggerEvent": false}],"grid": [{"show": false,"zlevel": 0,"z": 2,"left": "5%","right": "20%","containLabel": false,"backgroundColor": "transparent","borderColor": "#ccc","borderWidth": 1,"shadowOffsetX": 0,"shadowOffsetY": 0}]
};chart_d51b7fb3725d442fafd9365201317690.setOption(option_d51b7fb3725d442fafd9365201317690);</script><div id="87f0e6e843f443f986ad5a3539b28a78" class="chart-container" style="width:900px; height:500px; "></div><script>document.getElementById('87f0e6e843f443f986ad5a3539b28a78').style.width = document.getElementById('87f0e6e843f443f986ad5a3539b28a78').parentNode.clientWidth + 'px';var chart_87f0e6e843f443f986ad5a3539b28a78 = echarts.init(document.getElementById('87f0e6e843f443f986ad5a3539b28a78'), 'white', {renderer: 'canvas'});var option_87f0e6e843f443f986ad5a3539b28a78 = {"animation": true,"animationThreshold": 2000,"animationDuration": 1000,"animationEasing": "cubicOut","animationDelay": 0,"animationDurationUpdate": 300,"animationEasingUpdate": "cubicOut","animationDelayUpdate": 0,"aria": {"enabled": false},"color": ["#d14a61","#5793f3","#675bba","#5470c6","#91cc75","#fac858","#ee6666","#73c0de","#3ba272","#fc8452","#9a60b4","#ea7ccc"],"series": [{"type": "bar","name": "\u6700\u9ad8\u6e29","yAxisIndex": 0,"legendHoverLink": true,"data": [10,13,2,0,0,1,1],"realtimeSort": false,"showBackground": false,"stackStrategy": "samesign","cursor": "pointer","barMinHeight": 0,"barCategoryGap": "20%","barGap": "30%","large": false,"largeThreshold": 400,"seriesLayoutBy": "column","datasetIndex": 0,"clip": true,"zlevel": 0,"z": 2,"label": {"show": true,"margin": 8}},{"type": "bar","name": "\u6700\u4f4e\u6e29","yAxisIndex": 1,"legendHoverLink": true,"data": [5,5,-3,-5,-2,-2,-3],"realtimeSort": false,"showBackground": false,"stackStrategy": "samesign","cursor": "pointer","barMinHeight": 0,"barCategoryGap": "20%","barGap": "30%","large": false,"largeThreshold": 400,"seriesLayoutBy": "column","datasetIndex": 0,"clip": true,"zlevel": 0,"z": 2,"label": {"show": true,"margin": 8}},{"type": "line","name": "\u5929\u6c14\u8d28\u91cf\u6307\u6570 \u4f18(0~50) \u826f(51~100) \u8f7b\u5ea6(101~150) \u4e2d\u5ea6(151~200) \u91cd\u5ea6(201~300)","connectNulls": false,"xAxisIndex": 0,"yAxisIndex": 2,"symbolSize": 4,"showSymbol": true,"smooth": false,"clip": true,"step": false,"data": [["\u524d\u4e03\u5929",59],["\u524d\u516d\u5929",63],["\u524d\u4e94\u5929",29],["\u524d\u56db\u5929",50],["\u524d\u4e09\u5929",26],["\u524d\u4e24\u5929",42],["\u524d\u4e00\u5929",66]],"hoverAnimation": true,"label": {"show": false,"margin": 8},"logBase": 10,"seriesLayoutBy": "column","lineStyle": {"show": true,"width": 1,"opacity": 1,"curveness": 0,"type": "solid"},"areaStyle": {"opacity": 0},"zlevel": 0,"z": 0}],"legend": [{"data": ["\u6700\u9ad8\u6e29","\u6700\u4f4e\u6e29","\u5929\u6c14\u8d28\u91cf\u6307\u6570 \u4f18(0~50) \u826f(51~100) \u8f7b\u5ea6(101~150) \u4e2d\u5ea6(151~200) \u91cd\u5ea6(201~300)"],"selected": {},"show": true,"padding": 5,"itemGap": 10,"itemWidth": 25,"itemHeight": 14,"backgroundColor": "transparent","borderColor": "#ccc","borderWidth": 1,"borderRadius": 0,"pageButtonItemGap": 5,"pageButtonPosition": "end","pageFormatter": "{current}/{total}","pageIconColor": "#2f4554","pageIconInactiveColor": "#aaa","pageIconSize": 15,"animationDurationUpdate": 800,"selector": false,"selectorPosition": "auto","selectorItemGap": 7,"selectorButtonGap": 10}],"tooltip": {"show": true,"trigger": "axis","triggerOn": "mousemove|click","axisPointer": {"type": "cross"},"showContent": true,"alwaysShowContent": false,"showDelay": 0,"hideDelay": 100,"enterable": false,"confine": false,"appendToBody": false,"transitionDuration": 0.4,"textStyle": {"fontSize": 14},"borderWidth": 0,"padding": 5,"order": "seriesAsc"},"xAxis": [{"show": true,"scale": false,"nameLocation": "end","nameGap": 15,"gridIndex": 0,"inverse": false,"offset": 0,"splitNumber": 5,"minInterval": 0,"splitLine": {"show": true,"lineStyle": {"show": true,"width": 1,"opacity": 1,"curveness": 0,"type": "solid"}},"data": ["\u524d\u4e03\u5929","\u524d\u516d\u5929","\u524d\u4e94\u5929","\u524d\u56db\u5929","\u524d\u4e09\u5929","\u524d\u4e24\u5929","\u524d\u4e00\u5929"]}],"yAxis": [{"name": "\u6700\u4f4e\u6e29","show": true,"scale": false,"nameLocation": "end","nameGap": 15,"gridIndex": 0,"axisLine": {"show": true,"onZero": true,"onZeroAxisIndex": 0,"lineStyle": {"show": true,"width": 1,"opacity": 1,"curveness": 0,"type": "solid","color": "#5793f3"}},"axisLabel": {"show": true,"margin": 8,"formatter": "{value} \u00b0C"},"inverse": false,"position": "right","offset": 80,"splitNumber": 5,"min": -30,"max": 40,"minInterval": 0,"splitLine": {"show": true,"lineStyle": {"show": true,"width": 1,"opacity": 1,"curveness": 0,"type": "solid"}}},{"type": "value","name": "\u6700\u9ad8\u6e29","show": true,"scale": false,"nameLocation": "end","nameGap": 15,"gridIndex": 0,"axisLine": {"show": true,"onZero": true,"onZeroAxisIndex": 0,"lineStyle": {"show": true,"width": 1,"opacity": 1,"curveness": 0,"type": "solid","color": "#d14a61"}},"axisLabel": {"show": true,"margin": 8,"formatter": "{value} \u00b0C"},"inverse": false,"position": "right","offset": 0,"splitNumber": 5,"min": -30,"max": 40,"minInterval": 0,"splitLine": {"show": true,"lineStyle": {"show": true,"width": 1,"opacity": 1,"curveness": 0,"type": "solid"}}},{"type": "value","name": "\u5929\u6c14\u8d28\u91cf\u6307\u6570","show": true,"scale": false,"nameLocation": "end","nameGap": 15,"gridIndex": 0,"axisLine": {"show": true,"onZero": true,"onZeroAxisIndex": 0,"lineStyle": {"show": true,"width": 1,"opacity": 1,"curveness": 0,"type": "solid","color": "#675bba"}},"axisLabel": {"show": true,"margin": 8,"formatter": "{value}"},"inverse": false,"position": "left","offset": 0,"splitNumber": 5,"min": 0,"max": 300,"minInterval": 0,"splitLine": {"show": true,"lineStyle": {"show": true,"width": 1,"opacity": 1,"curveness": 0,"type": "solid"}}}],"title": [{"show": true,"target": "blank","subtarget": "blank","padding": 5,"itemGap": 10,"textAlign": "auto","textVerticalAlign": "auto","triggerEvent": false}],"grid": [{"show": false,"zlevel": 0,"z": 2,"left": "5%","right": "20%","containLabel": false,"backgroundColor": "transparent","borderColor": "#ccc","borderWidth": 1,"shadowOffsetX": 0,"shadowOffsetY": 0}]
};chart_87f0e6e843f443f986ad5a3539b28a78.setOption(option_87f0e6e843f443f986ad5a3539b28a78);</script><style>.fl-table {margin: 20px;border-radius: 5px;font-size: 12px;border: none;border-collapse: collapse;max-width: 100%;white-space: nowrap;word-break: keep-all;}.fl-table th {text-align: left;font-size: 20px;}.fl-table tr {display: table-row;vertical-align: inherit;border-color: inherit;}.fl-table tr:hover td {background: #00d1b2;color: #F8F8F8;}.fl-table td, .fl-table th {border-style: none;border-top: 1px solid #dbdbdb;border-left: 1px solid #dbdbdb;border-bottom: 3px solid #dbdbdb;border-right: 1px solid #dbdbdb;padding: .5em .55em;font-size: 15px;}.fl-table td {border-style: none;font-size: 15px;vertical-align: center;border-bottom: 1px solid #dbdbdb;border-left: 1px solid #dbdbdb;border-right: 1px solid #dbdbdb;height: 30px;}.fl-table tr:nth-child(even) {background: #F8F8F8;}</style><div id="2e9b063085384e43805f0f24afc63b80" class="chart-container" style=""><p class="title" style="font-size: 18px; font-weight:bold;" > 今日全国各省会城市的天气信息表</p><p class="subtitle" style="font-size: 12px;" > </p><table class="fl-table"><thead><tr><th>省份</th><th>最低温</th><th>最高温</th><th>天气</th><th>风力风向</th></tr></thead><tbody><tr><td>黑龙江</td><td>-29°</td><td>-20°</td><td>多云</td><td>北风2级</td></tr><tr><td>内蒙古</td><td>-26°</td><td>-16°</td><td>阴~晴</td><td>西北风2级</td></tr><tr><td>吉林</td><td>-3°</td><td>1°</td><td>小雪~多云</td><td>西北风2级</td></tr><tr><td>辽宁</td><td>-25°</td><td>-11°</td><td>阴~多云</td><td>北风3级</td></tr><tr><td>河北</td><td>-11°</td><td>-2°</td><td>多云~晴</td><td>东北风2级</td></tr><tr><td>天津</td><td>-11°</td><td>-5°</td><td>晴</td><td>西北风4级</td></tr><tr><td>山西</td><td>-16°</td><td>-2°</td><td>多云~晴</td><td>西北风2级</td></tr><tr><td>陕西</td><td>-3°</td><td>4°</td><td>雾~多云</td><td>东北风3级</td></tr><tr><td>甘肃</td><td>-10°</td><td>-1°</td><td>晴</td><td>东北风2级</td></tr><tr><td>宁夏</td><td>-17°</td><td>-8°</td><td>多云~晴</td><td>东风2级</td></tr><tr><td>青海</td><td>-13°</td><td>4°</td><td>多云~晴</td><td>西风2级</td></tr><tr><td>新疆</td><td>-22°</td><td>-18°</td><td>多云~晴</td><td>东南风1级</td></tr><tr><td>西藏</td><td>-5°</td><td>6°</td><td>晴</td><td>东北风2级</td></tr><tr><td>四川</td><td>1°</td><td>10°</td><td>晴</td><td>东南风2级</td></tr><tr><td>重庆</td><td>4°</td><td>8°</td><td>阴~多云</td><td>东北风1级</td></tr><tr><td>山东</td><td>-13°</td><td>-2°</td><td>多云~晴</td><td>东北风2级</td></tr><tr><td>河南</td><td>-6°</td><td>3°</td><td>多云~晴</td><td>东北风2级</td></tr><tr><td>江苏</td><td>-3°</td><td>1°</td><td>小雪~多云</td><td>西北风2级</td></tr><tr><td>安徽</td><td>-5°</td><td>1°</td><td>阴~多云</td><td>西北风2级</td></tr><tr><td>湖北</td><td>-3°</td><td>5°</td><td>雾~多云</td><td>北风2级</td></tr><tr><td>浙江</td><td>0°</td><td>3°</td><td>阴</td><td>西北风2级</td></tr><tr><td>福建</td><td>10°</td><td>15°</td><td>阴~小雨</td><td>东北风1级</td></tr><tr><td>江西</td><td>1°</td><td>3°</td><td>多云</td><td>北风2级</td></tr><tr><td>湖南</td><td>0°</td><td>4°</td><td>雨夹雪~多云</td><td>西北风2级</td></tr><tr><td>贵州</td><td>-1°</td><td>2°</td><td>阴</td><td>东北风3级</td></tr><tr><td>广西</td><td>7°</td><td>10°</td><td>阴</td><td>北风2级</td></tr><tr><td>海南</td><td>12°</td><td>15°</td><td>小雨~阴</td><td>东北风4级</td></tr><tr><td>上海</td><td>0°</td><td>5°</td><td>小雨~晴</td><td>西北风3级</td></tr><tr><td>广东</td><td>7°</td><td>11°</td><td>阴~多云</td><td>北风4级</td></tr><tr><td>云南</td><td>5°</td><td>18°</td><td>多云</td><td>西南风3级</td></tr><tr><td>台湾</td><td>19°</td><td>28°</td><td>阴~小雨</td><td>北风3级</td></tr></tbody>
</table></div></div><script></script><script>(function() {containers = document.getElementsByClassName("chart-container");if(containers.length > 0) {containers[0].style.display = "block";}})()function showChart(evt, chartID) {let containers = document.getElementsByClassName("chart-container");for (let i = 0; i < containers.length; i++) {containers[i].style.display = "none";}let tablinks = document.getElementsByClassName("tablinks");for (let i = 0; i < tablinks.length; i++) {tablinks[i].className = "tablinks";}document.getElementById(chartID).style.display = "block";evt.currentTarget.className += " active";}</script>
</body>
</html>