Package paleobioDB version 0.7.0
paleobioDB 包在2020年已经停止更新,该包依赖PBDB v1 API。
可以选择在Index of /src/contrib/Archive/paleobioDB (r-project.org)下载安装包后,执行本地安装。
Usage
pbdb_temporal_resolution (data, do.plot=TRUE)Arguments
参数【data】:输入的数据,数据帧格式。可以通过 pbdb_occurrences() 函数获得数据。
参数【do.plot】:TRUE/FALSE。默认为 TRUE。
Value
一个图和一个列表,其中包含数据的时间分辨率(最小值、最大值、第 1 和第 3 个四分位数、中位数和平均值)以及每个化石记录的时间分辨率 (马) 的摘要。
Example
library(paleobioDB)
library(RCurl)options(RCurlOptions = list(cainfo = system.file("CurlSSL", "cacert.pem", package = "RCurl")))data<- pbdb_occurrences (taxon_name= "Canidae", interval= "Quaternary")pbdb_temporal_resolution (data)$summaryMin. 1st Qu.  Median    Mean 3rd Qu.    Max. 0.0117  0.3846  1.5000  2.2046  2.8440 23.0183 $temporal_resolution[1]  3.1000  4.6000  3.1000  3.1000  3.1000  3.1000  3.1000  3.1000[9]  4.6000  3.1000  1.5000  1.5000  1.5000  1.5000  1.5000  1.5000
[17]  1.5000  1.0250  0.7693  1.8070  2.5763  2.5763  2.5763  2.5763
[25]  2.5763  5.3213  2.5763  0.7693 23.0183  0.6550  2.5763  0.6550
[33]  0.6550  8.5000  0.6550  3.1000  0.1143  0.1143  2.5880  0.1143
[41]  0.1143  1.8070  0.1143  0.1143  0.1143  2.5880  0.1143  2.5763
[49]  0.1143  1.8070  0.0117  0.6550  0.1143  4.6000  0.0117  0.0117
[57]  0.1143  2.5763  0.1143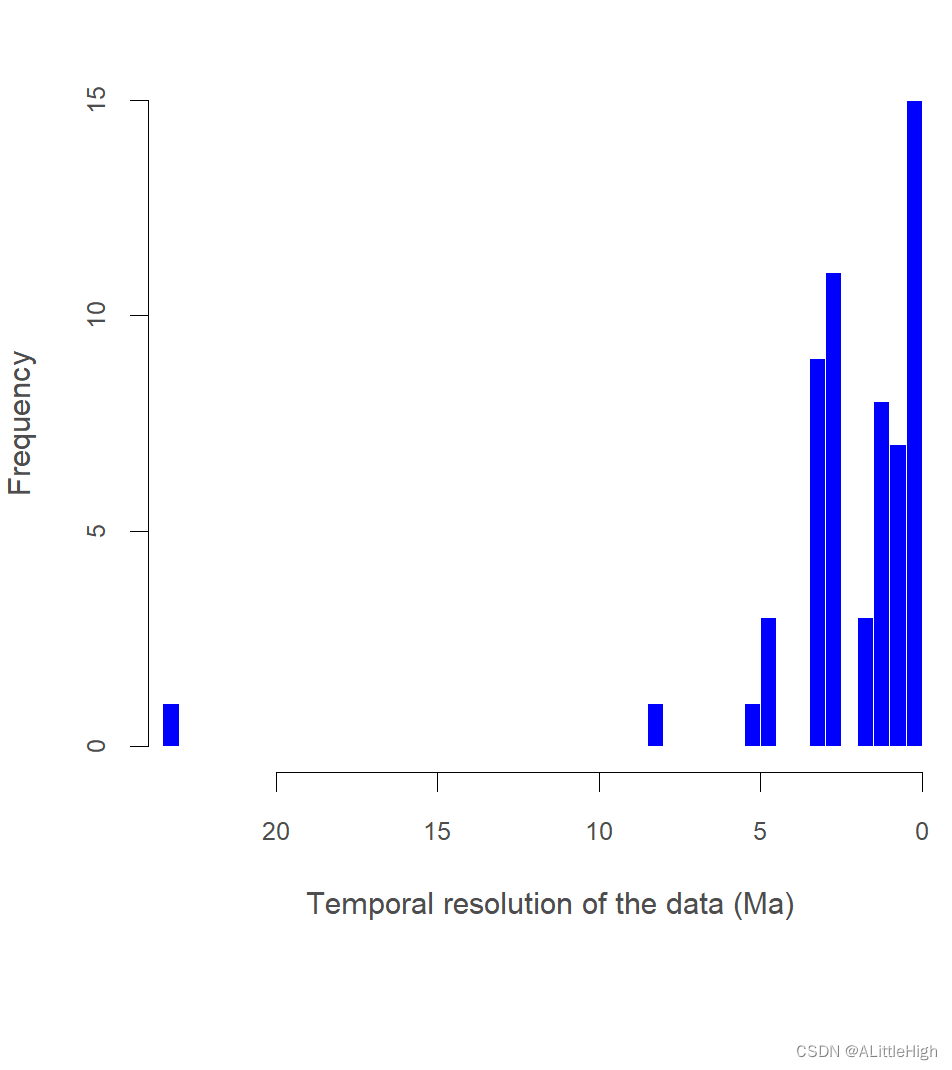
Page
function (data, do.plot = TRUE)
{if ("eag" %in% colnames(data)) {diff <- .numeric_age(data$eag) - .numeric_age(data$lag)tr <- list(summary = summary(diff), temporal_resolution = diff)}if ("early_age" %in% colnames(data)) {diff <- .numeric_age(data$early_age) - .numeric_age(data$late_age)tr <- list(summary = summary(diff), temporal_resolution = diff)}if (do.plot == TRUE) {hist(unlist(tr[[2]]), freq = T, col = "#0000FF", border = F, xlim = c(max(unlist(tr[[2]]), na.rm = TRUE), 0), breaks = 50, xlab = "Temporal resolution of the data (Ma)", main = "", col.lab = "grey30", col.axis = "grey30", cex.axis = 0.8)}return(tr)
}

