1、引言
在这篇文章中,我们将研究Python的一些配色方案,主要是Seaborn库。这将采用 Python Notebook 格式,其中包括绘图的代码。
2、实验数据
首先导入必要的库:
import pandas as pd
import seaborn as sns
import matplotlib.pyplot as plt
我们将使用 Seaborn 库的数据集之一,称为“tips”。
数据集摘要如下:
—244 笔餐厅订单交易(行)以及7个特征(列)
-
账单总额(美元)
-
小费(美元)
-
性别(女/男)
-
吸烟者(是/否)
-
白天(周六、周日、周四、周五)
-
时间(午餐、晚餐)
-
尺寸(范围从1到6)
df = sns.load_dataset("tips")
df.head(7)
3、使用默认样式/调色板
现在让我们使用默认配色方案 (matplotlib) 在 seaborn barplot 中可视化每天的消费额:
sns.barplot(x="tip",y="day",data=df,orient="h")
plt.show()
4、更换样式
有五种样式可供选择,可以使用“set_style”或“set”来更改其余部分的图形样式。
句法:sns.set_style(“darkgrid”)
plt.figure(figsize=(9,8))
for i,style in enumerate(["white", "whitegrid", "dark", "darkgrid", "ticks"]):sns.set(style=style)plt.subplot(3,2,i+1)sns.barplot(x="tip",y="day",data=df,orient="h")plt.ylabel(None)plt.title("style: '"+style+"'",fontweight="bold")
plt.tight_layout()
plt.show()

现在我们的绘图样式是for循环中最新应用的样式,即“ticks”
sns.barplot(x="tip",y="day",data=df,orient="h")
plt.show()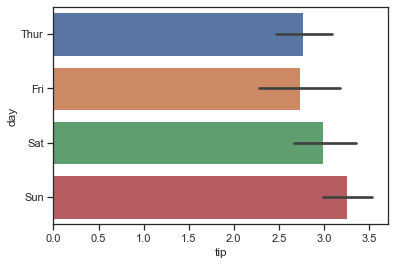
如果想在不同部分使用不同的样式。可以使用“with”语句临时设置样式,该语句仅将样式应用于其下的绘图。
语法:with sns.axes_style(“darkgrid”)
with sns.axes_style("darkgrid"):sns.barplot(x="tip",y="day",data=df,orient="h")
plt.show()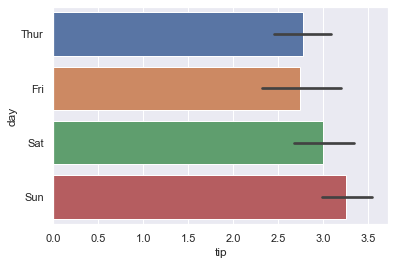
5、更改调色板
除了定义样式之外,还可以调整调色板:
语法:sns.set(palette=”muted”)
可用的调色板名称:
Accent, Accent_r, Blues, Blues_r, BrBG, BrBG_r, BuGn, BuGn_r, BuPu, BuPu_r, CMRmap, CMRmap_r, Dark2, Dark2_r, GnBu, GnBu_r, Greens, Greens_r, Greys, Greys_r, OrRd, OrRd_r, Oranges, Oranges_r, PRGn, PRGn_r, Paired, Paired_r, Pastel1, Pastel1_r, Pastel2, Pastel2_r, PiYG, PiYG_r, PuBu, PuBuGn, PuBuGn_r, PuBu_r, PuOr, PuOr_r, PuRd, PuRd_r, Purples, Purples_r, RdBu, RdBu_r, RdGy, RdGy_r, RdPu, RdPu_r, RdYlBu, RdYlBu_r, RdYlGn, RdYlGn_r, Reds, Reds_r, Set1, Set1_r, Set2, Set2_r, Set3, Set3_r, Spectral, Spectral_r, Wistia, Wistia_r, YlGn, YlGnBu, YlGnBu_r, YlGn_r, YlOrBr, YlOrBr_r, YlOrRd, YlOrRd_r, afmhot, afmhot_r, autumn, autumn_r, binary, binary_r, bone, bone_r, brg, brg_r, bwr, bwr_r, cividis, cividis_r, cool, cool_r, coolwarm, coolwarm_r, copper, copper_r, cubehelix, cubehelix_r, flag, flag_r, gist_earth, gist_earth_r, gist_gray, gist_gray_r, gist_heat, gist_heat_r, gist_ncar, gist_ncar_r, gist_rainbow, gist_rainbow_r, gist_stern, gist_stern_r, gist_yarg, gist_yarg_r, gnuplot, gnuplot2, gnuplot2_r, gnuplot_r, gray, gray_r, hot, hot_r, hsv, hsv_r, icefire, icefire_r, inferno, inferno_r, jet, jet_r, magma, magma_r, mako, mako_r, nipy_spectral, nipy_spectral_r, ocean, ocean_r, pink, pink_r, plasma, plasma_r, prism, prism_r, rainbow, rainbow_r, rocket, rocket_r, seismic, seismic_r, spring, spring_r, summer, summer_r, tab10, tab10_r, tab20, tab20_r, tab20b, tab20b_r, tab20c, tab20c_r, terrain, terrain_r, twilight, twilight_r, twilight_shifted, twilight_shifted_r, viridis, viridis_r, vlag, vlag_r, winter, winter_r
sns.set(style="darkgrid",palette="Set2")
sns.barplot(x="tip",y="day",data=df,orient="h")
plt.show()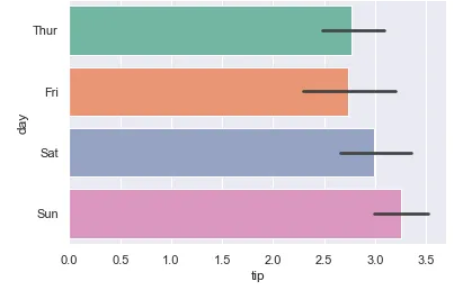
或者,可以使用以下语法来完全更改样式和调色板:plt.style.use(“ggplot”)
26种款式可选,“seaborn-muted”很好看。
plt.figure(figsize=(15,20))
for i,style in enumerate(plt.style.available): with plt.style.context(style): #with 关键字允许临时更改样式plt.subplot(9 ,3,i+1) sns.barplot(x="tip",y="day",data=df,orient="h") plt.ylabel (style)
plt.tight_layout()
plt.show()
现在可视化一些喜欢的样式,并看看它们在不同类型的图表中的外观:
sns.set(style="darkgrid")
palettes = ["muted","Set2","Set2_r","Pastel1","Pastel2","tab20"]
plt.figure(figsize=(15,24))
for i,palette in enumerate(palettes):plt.subplot(len(palettes),3,3*i+1)sns.set(palette=palette)sns.barplot(x="tip",y="day",data=df,orient="h")plt.title(palette,fontweight="bold",fontsize=15)plt.subplot(len(palettes),3,3*i+2)df["sex"].value_counts().plot.pie(autopct="%.1f%%", pctdistance=0.8,wedgeprops=dict(width=0.4))plt.title(palette,fontweight="bold",fontsize=15)ax3 = plt.subplot(len(palettes),3,3*i+3)df[["tip","total_bill","size"]].plot(ax=ax3)plt.title(palette,fontweight="bold",fontsize=15)
plt.tight_layout()
plt.show()
或者,对于散点图和线图,可以使用plt.cm.get_cmap()语法来选择调色板
import numpy as np
palette="Spectral"
plt.figure(figsize=(10,6))
plt.scatter(df.total_bill,df.tip,s=df["size"]**5,alpha=0.8,
c=np.arange(1,df.shape[0]+1),cmap=plt.cm.get_cmap(palette,df.shape[0]))
假设想要可视化数值变量的分布(“total_bill”、“tip”、“size”),但是由于它们的值范围不同,图表看起来不太漂亮:
sns.set(palette="Set2")
plt.figure(figsize=(15,4))
for i,col in enumerate(["total_bill","tip","size"]): sns.distplot(df[ col],label=col)
plt.xlabel("值")
plt.legend()
plt.show()
让我们在循环中使用子图来绘制它们。我们需要一个新函数来按照调色板的顺序进行颜色分布,否则它们将具有相同的颜色。
语法:sns.color_palette(“Set2”)
plt.figure(figsize=(15,4))
for i,col in enumerate(["total_bill","tip","size"]): plt.subplot(1,3,i+1) sns.distplot( df[col],color=sns.color_palette("Set2")[i]) plt.show()
6、手动着色
最后,可以手动选择自己的颜色集,而不是使用样式和调色板。
sns.boxplot(x=df.tip,y=df.day,hue=df.sex,palette=["salmon","darkslateblue"])
plt.show()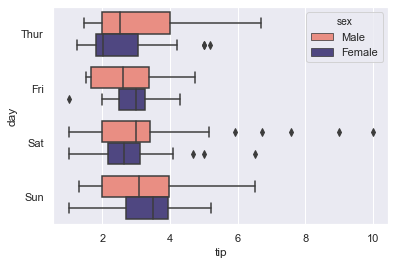
from  matplotlib.axes._axes  import _log as matplotlib_axes_logger
matplotlib_axes_logger.setLevel('ERROR')
sns.boxenplot(x=df.tip,y=df.day,palette=["rosybrown","tab:olive","cornflowerblue","lightsteelblue","plum","sandybrown"])
plt.show()
sns.countplot(y="size",data=df,palette=["c","y","m","pink","deepskyblue","k"])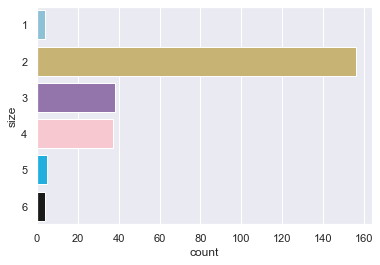


![[Vue3]父子组件相互传值数据同步](https://img-blog.csdnimg.cn/direct/ba49d51babc24eebaa1966868e8b0798.png)
