本教程将详细展示如何使用PyTorch训练神经网络,并给出完整代码和关键注释(ipython),建议使用CoLab的GPU来编译代码。
目录
- 环境初始化
- 数据准备
- 模型搭建
- 模型训练
- 优化器
- 训练和评估函数
- 开始训练
- 可视化
环境初始化
!pip install torchprofile 1>/dev/null
#torchprofile用于分析PyTorch模型,帮助理解模型的计算复杂度和参数数量等;1>/dev/null表示不显示安装过程中的任何输出信息,为了简洁。#一堆库
import random
from collections import OrderedDict, defaultdictimport numpy as np
import torch
from matplotlib import pyplot as plt
from torch import nn
from torch.optim import *
from torch.optim.lr_scheduler import *
from torch.utils.data import DataLoader
from torchprofile import profile_macs
from torchvision.datasets import *
from torchvision.transforms import *
from tqdm.auto import tqdm#定义随机种子,为了能复现
random.seed(0)
np.random.seed(0)
torch.manual_seed(0)
数据准备
本教程用 CIFAR-10 作为训练数据集。该数据集总共有60,000张图片。这些图片被分为50,000张训练图片和10,000张测试图片,包含来自10个类的图像,其中每个图像的大小为3x32x32,即大小为32x32像素的3通道彩色图像。
transforms = {"train": Compose([RandomCrop(32, padding=4),RandomHorizontalFlip(),ToTensor(),]),"test": ToTensor(),
}dataset = {}
for split in ["train", "test"]:dataset[split] = CIFAR10(root="data/cifar10",train=(split == "train"),download=True,transform=transforms[split],)#可视化图像:从测试数据集中为每个类别抽取四个样本,并将这些样本的图像和标签可视化。
samples = [[] for _ in range(10)]  #创建一个列表samples,其中包含10个子列表,对应于数据集中的10个类别。每个子列表用于存储该类别的样本图像
for image, label in dataset["test"]:  #遍历测试数据集dataset["test"]的每一个图像和标签对。对于每个样本,检查其标签对应的子列表中的样本数量。如果某个类别的样本数少于4个,就将当前图像添加到该类别对应的子列表中if len(samples[label]) < 4:samples[label].append(image)plt.figure(figsize=(20, 9)) #设置一个适合显示这些图像的图形大小。
for index in range(40):label = index % 10 #01234567890123...每行依次显示每个label的图像image = samples[label][index // 10] #0000000000111...每列依次显示单个label的图像# 图片格式由 CHW 转换到 HWC,为了可视化image = image.permute(1, 2, 0)# 将类索引转换为类名label = dataset["test"].classes[label]# 画图 4 * 10plt.subplot(4, 10, index + 1)plt.imshow(image)plt.title(label)plt.axis("off")
plt.show()

为了训练神经网络,我们需要批量输入数据。我们创建批处理大小为512的数据加载器 (data loaders):
dataflow = {}
for split in ['train', 'test']:dataflow[split] = DataLoader(dataset[split],batch_size=512,shuffle=(split == 'train'),num_workers=0,pin_memory=True,)for inputs, targets in dataflow["train"]:print("[inputs] dtype: {}, shape: {}".format(inputs.dtype, inputs.shape))print("[targets] dtype: {}, shape: {}".format(targets.dtype, targets.shape))break

模型搭建
我们将使用VGG-11的一个变体(具有更少的下样本和更小的分类器)作为我们的模型。
class VGG(nn.Module):ARCH = [64, 128, 'M', 256, 256, 'M', 512, 512, 'M', 512, 512, 'M'] #网络架构:8个卷积层 + 4个池化层def __init__(self) -> None:super().__init__()layers = []counts = defaultdict(int)def add(name: str, layer: nn.Module) -> None: #用于添加层到layers列表layers.append((f"{name}{counts[name]}", layer))counts[name] += 1in_channels = 3for x in self.ARCH:if x != 'M':# conv-bn-reluadd("conv", nn.Conv2d(in_channels, x, 3, padding=1, bias=False))add("bn", nn.BatchNorm2d(x))add("relu", nn.ReLU(True))in_channels = xelse:# maxpooladd("pool", nn.MaxPool2d(2))self.backbone = nn.Sequential(OrderedDict(layers)) #将层列表转换为有序字典,并通过nn.Sequential创建一个顺序容器self.backbone,这使得输入数据可以顺序通过定义的所有层。self.classifier = nn.Linear(512, 10) #线性层(nn.Linear),用于将卷积网络提取的特征映射到类别标签上。def forward(self, x: torch.Tensor) -> torch.Tensor:# backbone: [N, 3, 32, 32] => [N, 512, 2, 2]x = self.backbone(x) #特征提取# avgpool: [N, 512, 2, 2] => [N, 512]x = x.mean([2, 3]) #对特征图进行全局平均池化# classifier: [N, 512] => [N, 10]x = self.classifier(x) #通过分类器得到最终的类别预测return x model = VGG().cuda() #创建了VGG类的一个实例,并通过.cuda()方法将模型的所有参数和缓冲区移动到GPU上,以利用GPU加速计算。(假设你的环境支持CUDA)
#详细看一下模型结构
print(model.backbone)
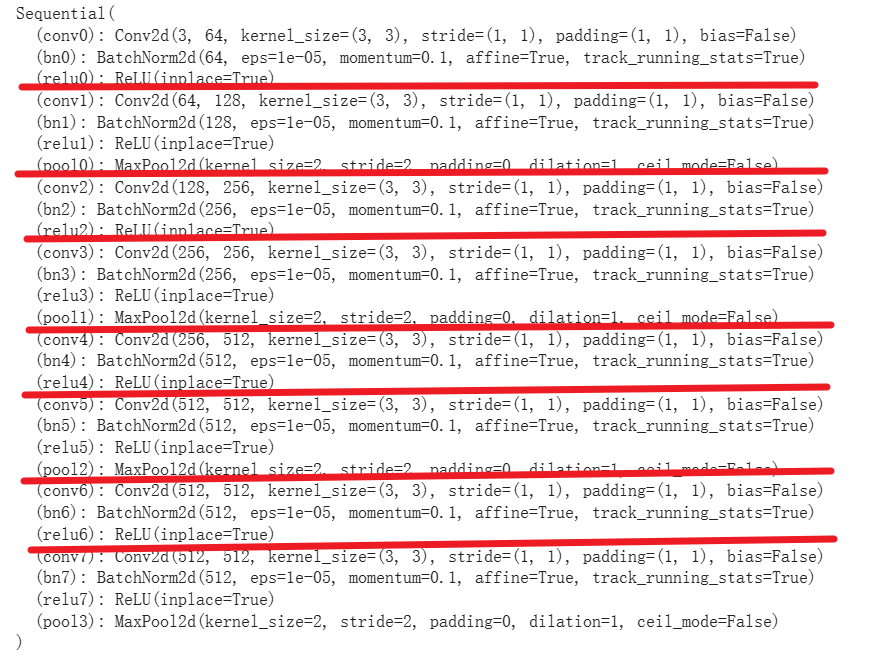
#详细分析一下模型的参数#计算模型大小:
num_params = 0
for param in model.parameters():if param.requires_grad:num_params += param.numel()
print("#Params:", num_params)
#Params: 9228362#计算模型的计算开销,由multiply–accumulate operations (MACs,乘法累加操作)来衡量
num_macs = profile_macs(model, torch.zeros(1, 3, 32, 32).cuda())
print("#MACs:", num_macs)
#MACs: 606164480#该模型有9.2M个参数,需要606M次乘法和累加操作进行一次推理。
模型训练
优化器
optimizer = SGD(model.parameters(),lr=0.4,momentum=0.9,weight_decay=5e-4, #权重衰减(L2正则化),有助于防止模型过拟合
)num_epochs = 20
steps_per_epoch = len(dataflow["train"])# 分段线性学习率调度。学习率随着训练步数的增加先线性增大,达到一定值后再线性减小。
lr_lambda = lambda step: np.interp([step / steps_per_epoch],[0, num_epochs * 0.3, num_epochs],[0, 1, 0]
)[0]# Visualize the learning rate schedule
steps = np.arange(steps_per_epoch * num_epochs)
plt.plot(steps, [lr_lambda(step) * 0.4 for step in steps])
plt.xlabel("Number of Steps")
plt.ylabel("Learning Rate")
plt.grid("on")
plt.show()scheduler = LambdaLR(optimizer, lr_lambda) #应用学习率调度器

训练和评估函数
def train(model: nn.Module,dataflow: DataLoader,criterion: nn.Module,optimizer: Optimizer,scheduler: LambdaLR,
) -> None:model.train() #告诉PyTorch模型现在处于训练模式,这对于某些特定层如Dropout和BatchNorm是必要的,因为它们在训练和评估时的行为不同for inputs, targets in tqdm(dataflow, desc='train', leave=False):# Move the data from CPU to GPUinputs = inputs.cuda()targets = targets.cuda()# 在每次的参数更新前,需要将梯度归零,防止梯度在反向传播时累积optimizer.zero_grad()# Forward inferenceoutputs = model(inputs)loss = criterion(outputs, targets)# Backward propagationloss.backward()# 根据计算出的梯度更新模型参数optimizer.step()# 根据学习率调度器更新学习率scheduler.step()@torch.inference_mode() # 禁用梯度计算
def evaluate(model: nn.Module,dataflow: DataLoader
) -> float:model.eval() ##告诉PyTorch模型现在处于评估模式,关闭Dropout和BatchNorm的特定训练行为。num_samples = 0num_correct = 0for inputs, targets in tqdm(dataflow, desc="eval", leave=False):# Move the data from CPU to GPUinputs = inputs.cuda()targets = targets.cuda()# Inferenceoutputs = model(inputs)# 将模型输出(通常是逻辑值或概率)转换为类别索引outputs = outputs.argmax(dim=1)# Update metricsnum_samples += targets.size(0)num_correct += (outputs == targets).sum()return (num_correct / num_samples * 100).item()
开始训练
for epoch_num in tqdm(range(1, num_epochs + 1)):train(model, dataflow["train"], criterion, optimizer, scheduler)metric = evaluate(model, dataflow["test"])print(f"epoch {epoch_num}:", metric)

可视化
可视化模型的预测,看看模型的真实表现。
plt.figure(figsize=(20, 10))
for index in range(40):image, label = dataset["test"][index+66]# Model inferencemodel.eval()with torch.inference_mode():pred = model(image.unsqueeze(dim=0).cuda())pred = pred.argmax(dim=1)# Convert from CHW to HWC for visualizationimage = image.permute(1, 2, 0)# Convert from class indices to class namespred = dataset["test"].classes[pred]label = dataset["test"].classes[label]# Visualize the imageplt.subplot(4, 10, index + 1)plt.imshow(image)plt.title(f"pred: {pred}" + "\n" + f"label: {label}")plt.axis("off")
plt.show()
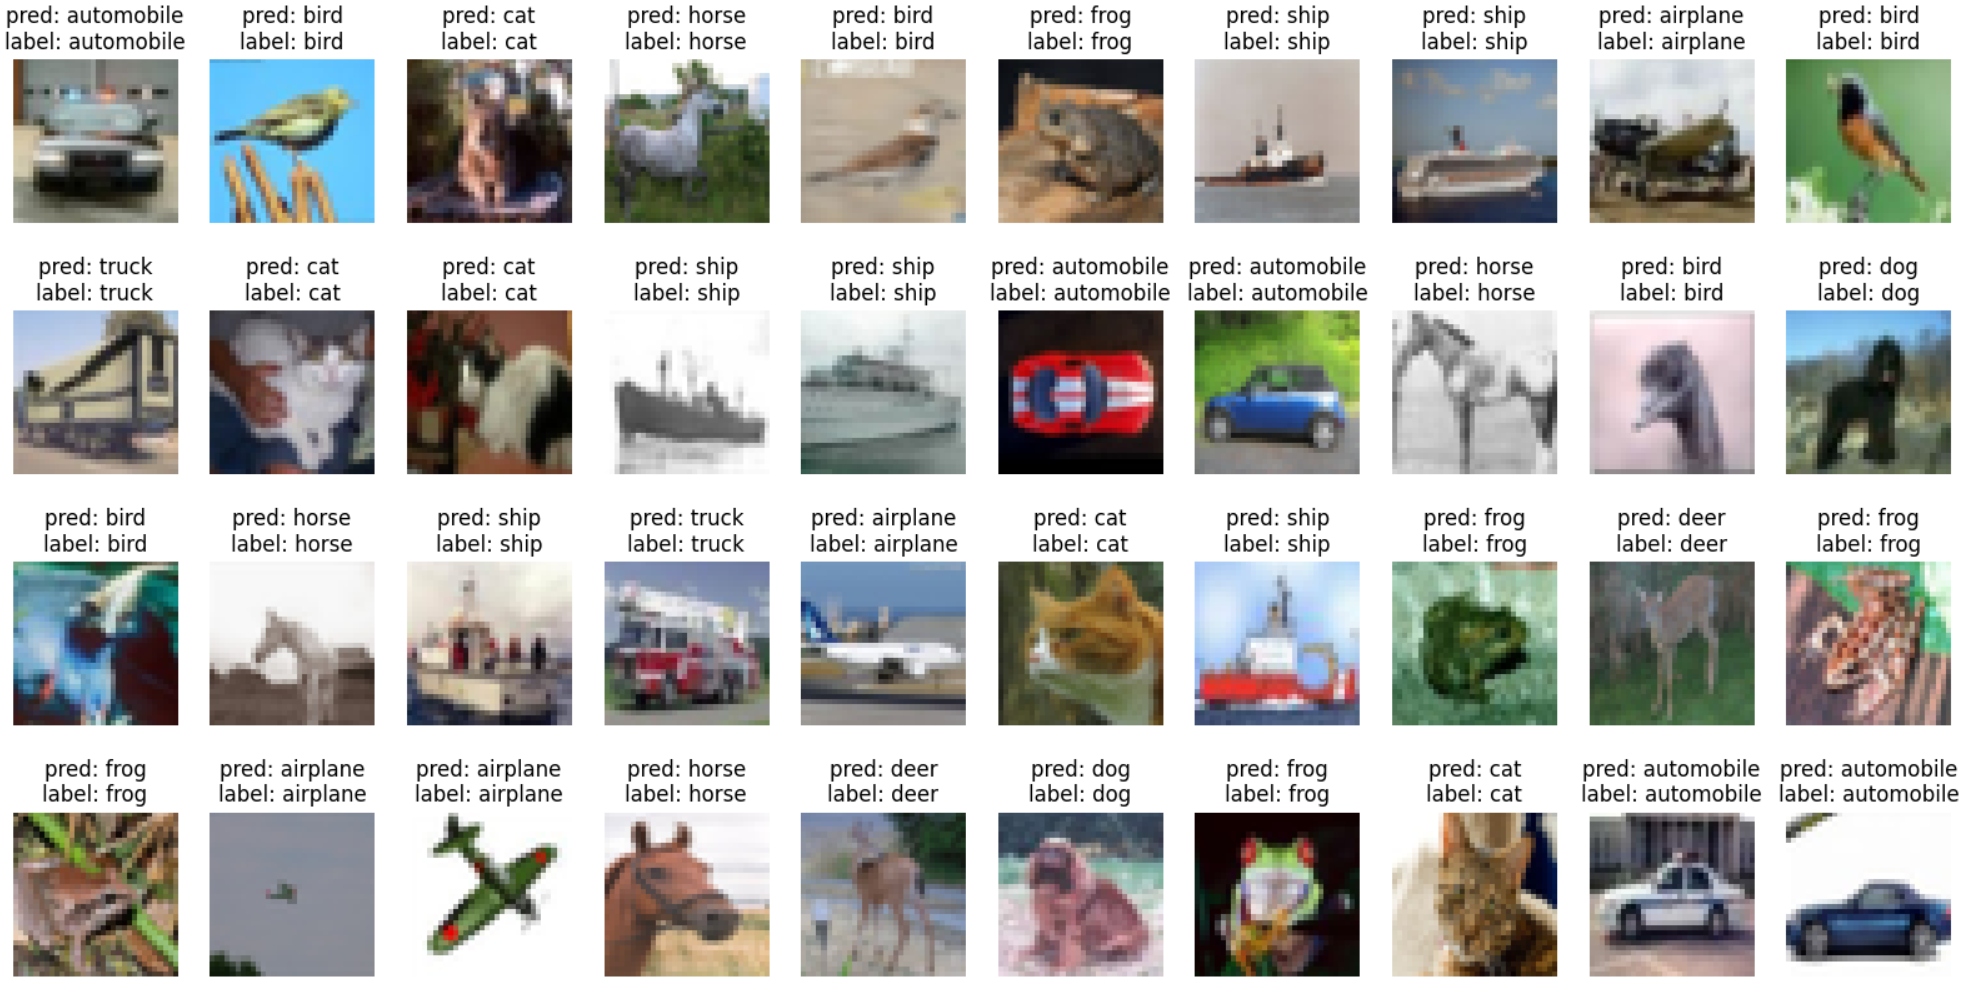
Perfect!
