Title
题目
Deep Learning Coronary Artery Calcium Scores from SPECT/CT Attenuation Maps Improve Prediction of Major Adverse Cardiac Events
从SPECT/CT衰减图中深度学习冠状动脉钙化评分提高了对重大不良心脏事件的预测
01
文献速递介绍
低剂量非门控CT衰减校正(CTAC)扫描常常在SPECT/CT心肌灌注成像中获取。尽管CTAC的图像质量特征上较低,但深度学习(DL)可以潜在地从这些扫描中自动量化冠状动脉钙化(CAC)。我们评估了使用DL模型得出的CAC量化结果,包括与专家注释的相关性以及与主要不良心血管事件(MACE)的关联。方法:我们训练了一个卷积长短期记忆DL模型,使用6608个研究(2个中心)自动量化CTAC扫描上的CAC,并在一个外部患者队列中评估了该模型,该队列中的患者没有已知的冠状动脉疾病(n = 2271),并在另一个中心获取。我们评估了DL和专家注释的CAC分数之间的一致性。我们还评估了DL自动获取的CAC类别(0、1-100、101-400或>400)与MACE(死亡、血管重建、心肌梗死或不稳定性心绞痛)之间的关联,这些分数是由经验丰富的读者手动推导出来的,并使用多变量Cox模型(根据年龄、性别、既往病史、灌注和射血分数进行调整)和净再分类指数进行评估。结果:在外部测试人群中,DL CAC为0的患者有908例(40.0%),1-100的有596例(26.2%),100-400的有354例(15.6%),400以上的有413例(18.2%)。DL CAC与专家注释的CAC类别一致性较好(线性加权k值为0.80),但DL CAC的获取时间少于2秒,而专家CAC约为2.5分钟。与CAC为零相比,DL CAC类别是MACE的独立危险因素,其风险比分别为CAC为1-100(2.20;95% CI,1.54-3.14;P <0.001)、CAC为101-400(4.58;95% CI,3.23-6.48;P <0.001)和CAC为400以上(5.92;95% CI,4.27-8.22;P <0.001)。总体而言,DL CAC的净再分类指数为0.494,与专家注释的CAC(0.503)类似。结论:来自SPECT/CT衰减校正图的DL CAC与专家CAC注释相符,并提供类似的风险分层,但可以自动获取。与仅使用SPECT心肌灌注相比,DL CAC分数改善了相当比例的患者的分类。
Method
方法
Patients who underwent SPECT/CT MPI with CTAC at 1 of 2 cen ters (Yale and Cardiovascular Imaging Technologies) were used to train the convLSTM. Patients who underwent SPECT/CT MPI from a third center (University of Calgary) were used as an external testing cohort. Patients without CTAC were excluded. For external testing, patients with a history of coronary artery disease (n 5 673), defined as previousmyocardial infarction or revascularization with either percutaneous coronary intervention or coronary artery bypass grafting (15), were excluded.Details of the clinical data acquisition are provided in the supplemental materials (available at http://jnm.snmjournals.org). The study protocolcomplied with the Declaration of Helsinki. The study was approved bythe institutional review board at all sites. To the extent allowed by datasharing agreements and institutional review board protocols, data andcodes used in this article will be shared on written request.
研究人群
接受了SPECT/CT MPI与CTAC扫描的患者,其中1中心为耶鲁大学,另1中心为心血管影像技术中心,用于训练convLSTM模型。来自第三个中心(卡尔加里大学)接受了SPECT/CT MPI的患者则用作外部测试队列。没有进行CTAC扫描的患者被排除在外。在外部测试中,具有冠状动脉疾病史(n = 673)的患者被排除,其定义为先前的心肌梗死或经皮冠状动脉介入术或冠状动脉旁路移植术进行过血管重建(15)。临床数据采集的详细信息在补充材料中提供(可在http://jnm.snmjournals.org找到)。该研究方案符合《赫尔辛基宣言》。该研究得到了所有研究机构审查委员会的批准。根据数据共享协议和机构审查委员会的协议,本文中使用的数据和代码将根据书面请求进行分享。
Conclusion
结论
DL CAC derived from SPECT/CT attenuation maps agrees wellwith expert CAC annotations. DL and expert annotated CAC areassociated with MACE, but DL scores can be obtained automatically in a few seconds. DL CAC scores can be quantified automatically after SPECT/CT MPI, without impeding clinical workflow,to improve classification of a significant proportion of patients.
来自SPECT/CT衰减图的DL CAC与专家注释的CAC一致。DL和专家注释的CAC与MACE相关联,但DL分数可以在几秒钟内自动获得。在SPECT/CT MPI后,DL CAC分数可以自动量化,不会妨碍临床工作流程,从而改善相当比例患者的分类。
Figure
图

FIGURE 1. Outline of model architecture. ConvLSTM includes network trained to segment CAC, as well as second network for segmentation of heart, which limits CAC scoring. Softmax argmax function normalizes output of network to expected probabilities. Model identifies coronary calcium(red) and noncoronary calcium (green) within heart mask.
图1. 模型架构概述。ConvLSTM包括用于分割CAC的网络,以及用于限制CAC评分的心脏分割的第二个网络。Softmax argmax函数将网络的输出归一化为预期的概率。模型在心脏掩模内识别冠状动脉钙化(红色)和非冠状动脉钙化(绿色)。

FIGURE 2. Examples of expert scores compared with DL CAC scores. Model identifies coronary calcium (red) and noncoronary calcium (green). In case 1, expert and DL annotations identified simi lar left circumflex CAC as well as ascending aorta calcium. No CAC was identified by either expertor DL scoring in case 2. In case 3, expert and DL annotations identified similar right coronary arteryCAC as well as mitral annular calcification. BMI 5 body mass index.
图2. 专家评分与DL CAC评分的示例比较。模型识别冠状动脉钙化(红色)和非冠状动脉钙化(绿色)。在案例1中,专家和DL注释识别了类似的左回旋支CAC以及升主动脉钙化。在案例2中,专家或DL评分均未识别到CAC。在案例3中,专家和DL注释识别了类似的右冠状动脉CAC以及二尖瓣环钙化。BMI表示身体质量指数。

FIGURE 3. Concordance matrix between DL and expert CAC categories in external testing population.
图3. 外部测试人群中DL和专家CAC类别之间的一致性矩阵。

FIGURE 4. Kaplan–Meier survival curves for MACE. Increasing CAC category was associated with increasing risk of MACE for DL and expert annotated CAC scores on SPECT/CT attenuation maps.
图4.Kaplan-Meier生存曲线的MACE。在SPECT/CT衰减图上,DL和专家注释的CAC分数与MACE的风险增加相关。

FIGURE 5. Results of net-reclassification analysis. We assessed addition of CAC categories to full multivariable model outlined in Table 2.
图5. 净再分类分析结果。我们评估了将CAC类别添加到表2中概述的完整多变量模型中的效果。
Table
表

TABLE 1 External Testing: Patient Characteristics According to CAC Category Determined by Deep-Learning Model
表1 外部测试:根据深度学习模型确定的CAC类别的患者特征
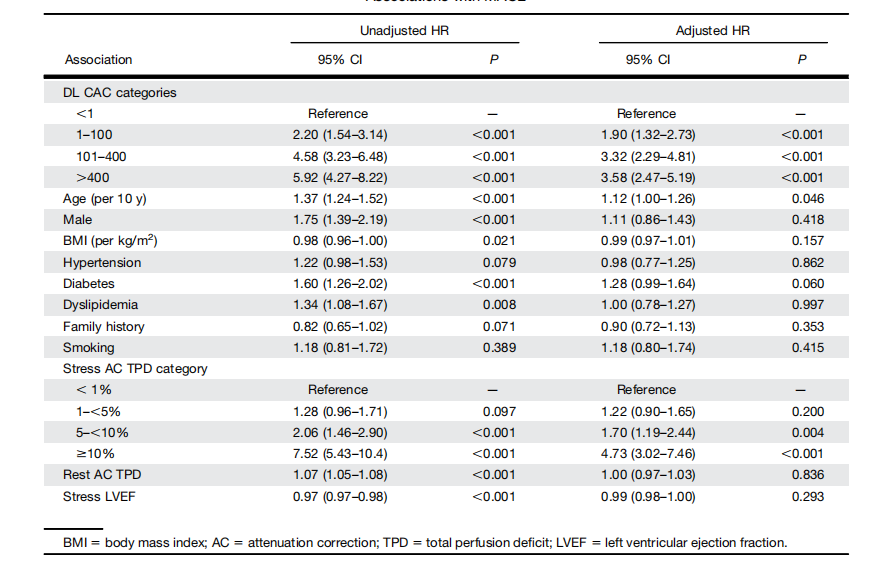
TABLE 2 Associations with MACE
表2 MACE相关性
