文章目录
- 利用par()函数设置公共绘图参数(重点)
- 在已有的plot图像中如何添加线条
- 做出三维表面图
- 控制坐标轴显示的区域
- 在指定坐标中做注释
- 标题和xy的标签
- 标题中的字体
- 通过title()对图形的坐标轴名称和图形标题进行编辑(重点)
- 是否显示坐标轴
- 是否显示坐标刻度
- 通过axis()函数对坐标轴进行编辑(重点)
- 参数
- 例子
- plot中的缩放
- 图例
- 颜色代码大全
- R语言中的调色板
利用par()函数设置公共绘图参数(重点)
par()的功能有点想ggplot中的theme()可以对图形的很多参数进行设置,例如:
par(mfrow=c(2,2))#设置2*2的图形排列
par(family=‘XXX’)#设置作图区域的字体
par(font=1或2或3或4)#设置字型,正常体,font=1, 粗体,font=2,斜体,font=3, 粗斜体,font=4
par(las={0,1,2,3})#设置坐标轴字体的显示格式1-3分别对应正常,水平,与坐标轴正交,一直垂直
在已有的plot图像中如何添加线条
abline(v =1)#添加垂直的辅助线
abline(h=1)#添加水平的辅助线
lines(x,y)#添加由向量x,y组成的线条
做出三维表面图
persp(x,y,z,phi=-45,theta=45,col="yellow",shade=.65 ,ticktype="detailed")
控制坐标轴显示的区域
plot(xlim=c(a,b),ylim=c(c,d))
在指定坐标中做注释
text(x,y,"text")
标题和xy的标签
plot(x,y,main="dfdf",xlab="fdsf",ylab="sdafgsdafg",xlim=c(1,2),ylim=c(1,2))
或者
labs(title="dfdf",x="fdsf",y="sdafgsdafg")
标题中的字体
text(x,y,label="font=1 正常体",font=1)
正常体,font=1
粗体,font=2
斜体,font=3
粗斜体,font=4
通过title()对图形的坐标轴名称和图形标题进行编辑(重点)
title(xlab='XX',ylab='XXX', title='XXX',family=XX)
该函数也是在原有的基础上再进行操作,因为在plot阶段一般不显示这些名称
是否显示坐标轴
plot(x,y,axes=F)
是否显示坐标刻度
plot(x,y,xaxt="n")#不现实x轴的刻度
plot(x,y,yaxt="n")#不现实y轴的刻度
通过axis()函数对坐标轴进行编辑(重点)
plot(x,y)
axis(side, at = NULL, labels = TRUE, tick = TRUE, line = NA,pos = NA, outer = FALSE, font = NA, lty = "solid",lwd = 1, lwd.ticks = lwd, col = NULL, col.ticks = NULL,hadj = NA, padj = NA, gap.axis = NA, cex.axis = 1, ...)
通过at,labels组合可以指定坐标轴的刻度显示;
axis()是在原有的坐标轴的基础上再加一些参数,因此常和plot(…,xaxt=''n)配合使用, 以保证没有原始坐标轴刻度的干扰;
cex.axis=1.5,cex.lab=1.5,cex.main=1.5三个参数可以分别放大坐标刻度字体的大小,lab的字体大小,和标题的字体大小
参数
side
an integer specifying which side of the plot the axis is to be drawn on. The axis is placed as follows: 1=below, 2=left, 3=above and 4=right.
at
the points at which tick-marks are to be drawn. Non-finite (infinite, NaN or NA) values are omitted. By default (when NULL) tickmark locations are computed, see ‘Details’ below.
labels
this can either be a logical value specifying whether (numerical) annotations are to be made at the tickmarks, or a character or expression vector of labels to be placed at the tickpoints. (Other objects are coerced by as.graphicsAnnot.) If this is not logical, at should also be supplied and of the same length. If labels is of length zero after coercion, it has the same effect as supplying TRUE.
tick
a logical value specifying whether tickmarks and an axis line should be drawn.
line
the number of lines into the margin at which the axis line will be drawn, if not NA.
pos
the coordinate at which the axis line is to be drawn: if not NA this overrides the value of line.
outer
a logical value indicating whether the axis should be drawn in the outer plot margin, rather than the standard plot margin.
font
font for text. Defaults to par(“font”).
lty
line type for both the axis line and the tick marks.
lwd, lwd.ticks
line widths for the axis line and the tick marks. Zero or negative values will suppress the line or ticks.
col, col.ticks
colors for the axis line and the tick marks respectively. col = NULL means to use par(“fg”), possibly specified inline, and col.ticks = NULL means to use whatever color col resolved to.
hadj
adjustment (see par(“adj”)) for all labels parallel (‘horizontal’) to the reading direction. If this is not a finite value, the default is used (centring for strings parallel to the axis, justification of the end nearest the axis otherwise).
padj
adjustment for each tick label perpendicular to the reading direction. For labels parallel to the axes, padj = 0 means right or top alignment, and padj = 1 means left or bottom alignment. This can be a vector given a value for each string, and will be recycled as necessary.
If padj is not a finite value (the default), the value of par(“las”) determines the adjustment. For strings plotted perpendicular to the axis the default is to centre the string.
gap.axis
an optional (typically non-negative) numeric factor to be multiplied with the size of an ‘m’ to determine the minimal gap between labels that are drawn, see ‘Details’. The default, NA, corresponds to 1 for tick labels drawn parallel to the axis and 0.25 otherwise, i.e., the default is equivalent to
perpendicular <- function(side, las) {
is.x <- (side %% 2 == 1) # is horizontal x-axis
( is.x && (las %in% 2:3)) ||
(!is.x && (las %in% 1:2))
}
gap.axis <- if(perpendicular(side, las)) 0.25 else 1
gap.axis may typically be relevant when at = … tick-mark positions are specified explicitly.
…
other graphical parameters may also be passed as arguments to this function, particularly, cex.axis, col.axis and font.axis for axis annotation, i.e. tick labels, mgp and xaxp or yaxp for positioning, tck or tcl for tick mark length and direction, las for vertical/horizontal label orientation, or fg instead of col, and xpd for clipping. See par on these.
Parameters xaxt (sides 1 and 3) and yaxt (sides 2 and 4) control if the axis is plotted at all.
Note that lab will partial match to argument labels unless the latter is also supplied. (Since the default axes have already been set up by plot.window, lab will not be acted on by axis.)
例子
plot(x,y)
axis(side=1, at=1:4,labels=LETTERS[1:4])#改变刻度显示
#构造更加多样的坐标轴
axis(4, col = "violet", col.axis = "dark violet", lwd = 2)
axis(3, col = "gold", lty = 2, lwd = 0.5)
plot中的缩放
plot(x,y,xlab = 'x',main = 'title',ylab = 'y',cex.main = 1.5,cex.lab = 1.2)
图例
legend("topright",c("4k及以下","4k~6k","6k~8k","8k及以上"),lty=c(,,,),pch = c(, ,),col=c(,,,),lwd=c(,,,),fill=c("red","blue","black","green"),text.col = "green4",cex=0.6, merge = TRUE)
颜色代码大全
https://www.cnblogs.com/cnblogs-jcy/p/5689033.html
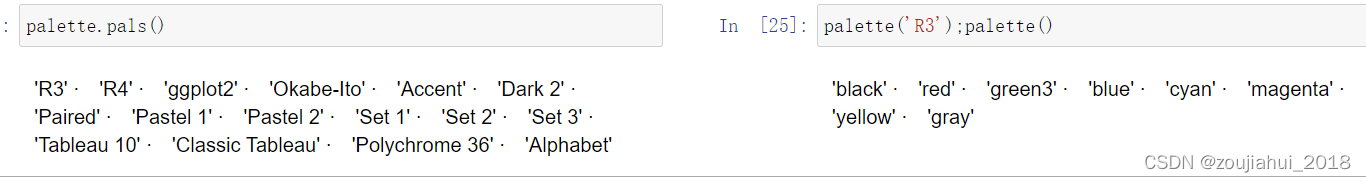
R语言中的调色板
palette(value) # obtain the curren palette or set the palettepalette.pals() # give the names of predefined palettespalette.colors() # return a vector of R colors