背景:
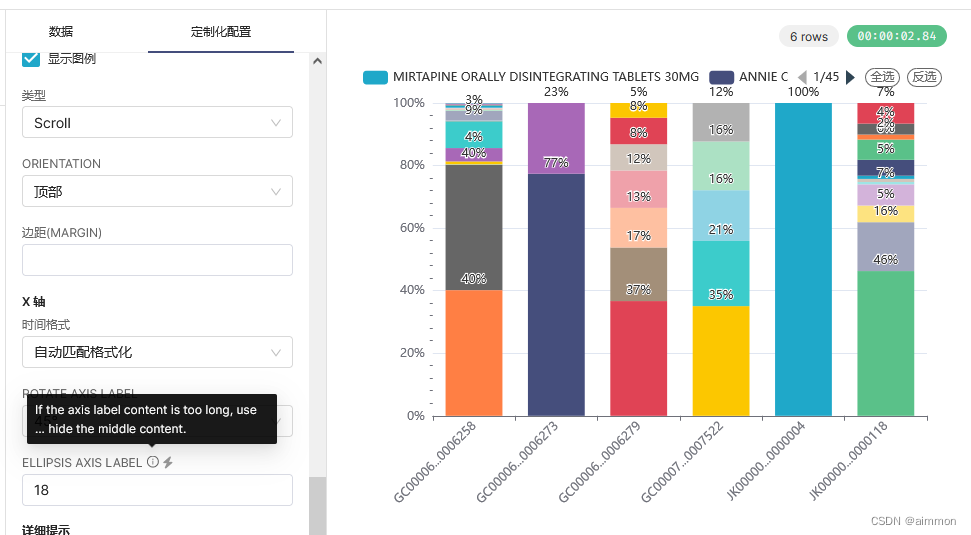
以柱状图(来自Echarts 插件)为例,如果X轴data数据过长,影响图表体验,为此需要省略部分内容
superset-frontend\plugins\plugin-chart-echarts\src\Timeseries\transformProps.ts
import {getBaselineSeriesForStream,getPadding,getTooltipTimeFormatter,getXAxisFormatter,getXAxisEllipsisFormatter,transformEventAnnotation,transformFormulaAnnotation,transformIntervalAnnotation,transformSeries,transformTimeseriesAnnotation,
} from './transformers';-----------------------------------------------------------------------------
let xAxis: any = {type: xAxisType,name: xAxisTitle,nameGap: convertInteger(xAxisTitleMargin),nameLocation: 'middle',axisLabel: {hideOverlap: true,formatter: xAxisFormatter,rotate: xAxisLabelRotation,// overflow: 'truncate',// width: 80,},minInterval:xAxisType === 'time' && timeGrainSqla? TIMEGRAIN_TO_TIMESTAMP[timeGrainSqla]: 0,};
superset-frontend\plugins\plugin-chart-echarts\src\Timeseries\transformers.ts
export function getXAxisEllipsisFormatter(maxLength: number = 10) {return function(value: string | number | null) {const strValue = String(value);if (isNaN(maxLength) || maxLength <= 0 || maxLength >= strValue.length) {return strValue; }if (strValue.length > maxLength && maxLength > 3) {const partLength = Math.floor((maxLength - 3) / 2); const start = strValue.substring(0, partLength);const end = strValue.substring(strValue.length - partLength); return `${start}...${end}`; }return strValue;};
}
superset-frontend\plugins\plugin-chart-echarts\src\Timeseries\Regular\Bar\controlPanel.tsx
const {logAxis,minorSplitLine,truncateYAxis,yAxisBounds,zoomable,xAxisLabelRotation,xAxisLabelEllipsis,orientation,
} = DEFAULT_FORM_DATA;
--------------------------------------------------------------------------------[{name: 'xAxisLabelEllipsis',config: {type: 'TextControl',label: t('Ellipsis axis label'),// default: xAxisLabelRotation,renderTrigger: true,isInt: true,description: t('If the axis label content is too long, use ... hide the middle content.',),visibility: ({ controls }: ControlPanelsContainerProps) =>isXAxis ? isVertical(controls) : isHorizontal(controls),},},],
superset\translations\zh\LC_MESSAGES\messages.json
"If the axis label content is too long, use ... hide the middle content.": ["如果坐标轴文本内容过长,就用...隐藏中间的内容"
],
superset\translations\zh\LC_MESSAGES\messages.po
msgid "If the axis label content is too long, use ... hide the middle content."
msgstr "如果坐标轴文本内容过长,就用...隐藏中间的内容"
superset\translations\en\LC_MESSAGES\messages.json
"If the axis label content is too long, use ... hide the middle content.": [""
],
superset\translations\en\LC_MESSAGES\messages.po
msgid "If the axis label content is too long, use ... hide the middle content."
msgstr ""
superset-frontend\plugins\plugin-chart-echarts\src\Timeseries\transformProps.ts
1. EchartsTimeseriesFormData = { ...DEFAULT_FORM_DATA, ...formData }; 加入‘xAxisLabelEllipsis,’
2.修改xAxis 的逻辑
const axisFormatter = xAxisLabelEllipsis ? getXAxisEllipsisFormatter(xAxisLabelEllipsis) : xAxisFormatterlet xAxis: any = {type: xAxisType,name: xAxisTitle,nameGap: convertInteger(xAxisTitleMargin),nameLocation: 'middle',axisLabel: {hideOverlap: true,// formatter: xAxisFormatter,formatter: axisFormatter,rotate: xAxisLabelRotation,},minInterval:xAxisType === 'time' && timeGrainSqla? TIMEGRAIN_TO_TIMESTAMP[timeGrainSqla]: 0,};效果图
x轴
