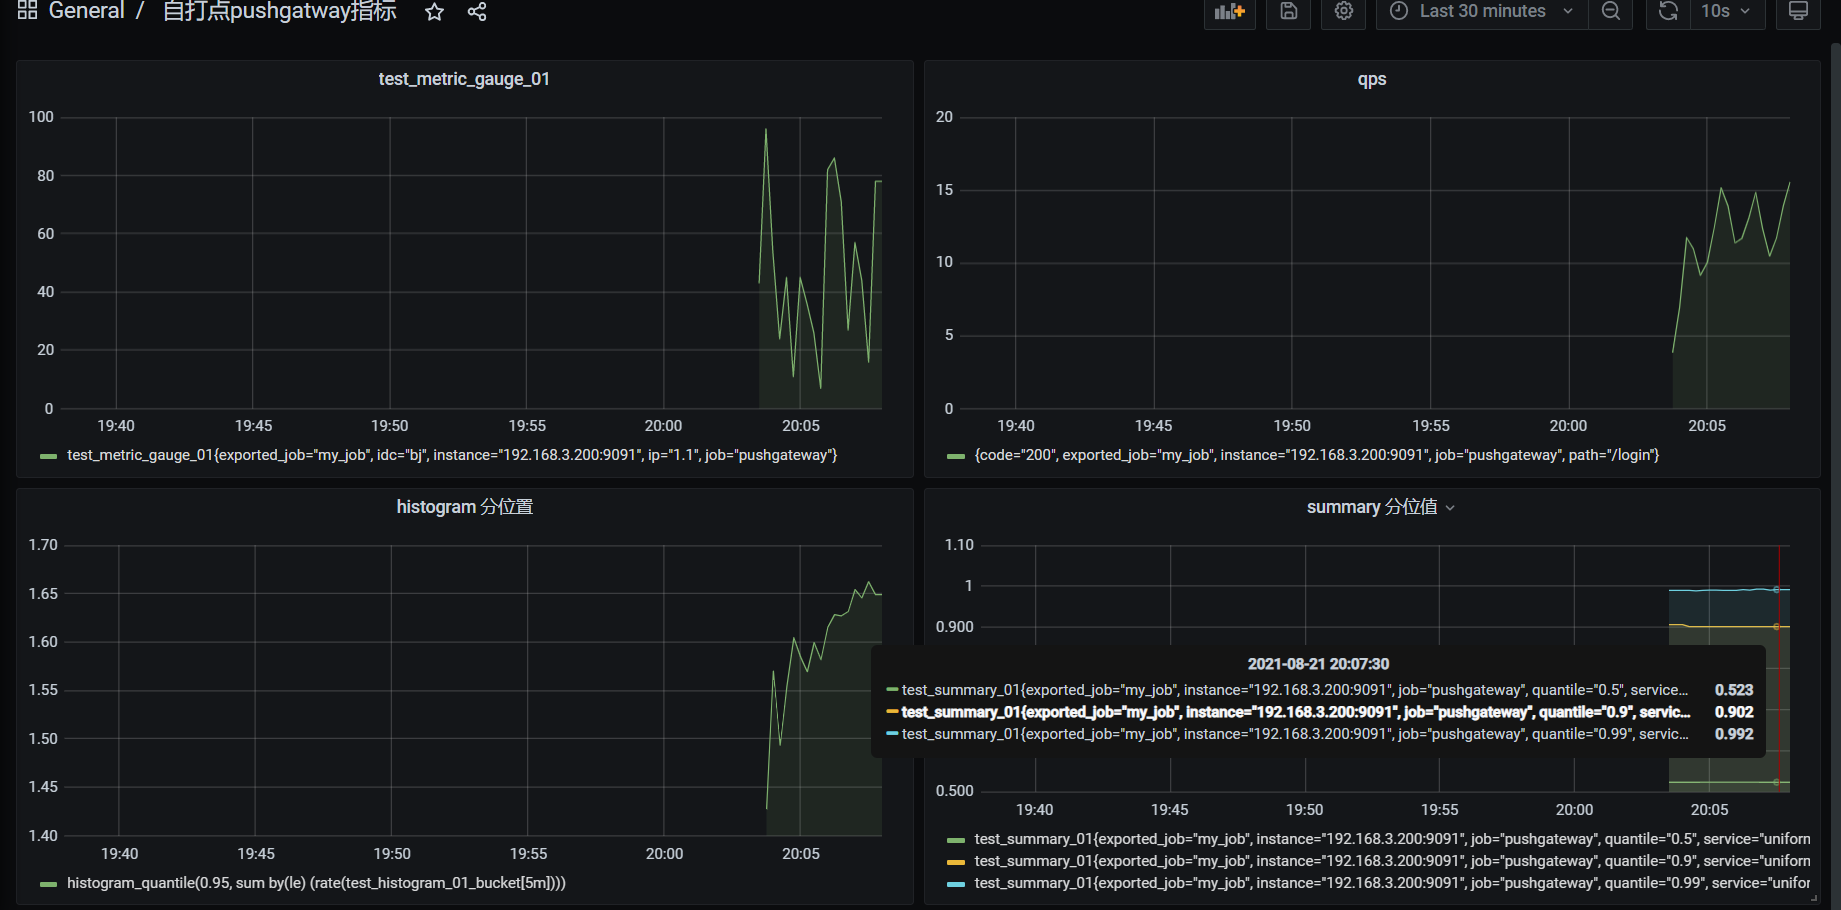
使用golang sdk打prometheus4种指标,推送到pushgateway gauge、counter、histogram、summary的初始化 4种类似的设置值的方法 推送到pushgateway的方法 prometheus配置采集pushgateway,grafana上配大盘 项目地址 https://github.com/prometheus/client_golang import (
"github.com/prometheus/client_golang/prometheus/push"
)
var ( pusher * push. Pusher
)
TestMetricGauge01 = prometheus. NewGaugeVec ( prometheus. GaugeOpts{ Name: "test_metric_gauge_01" , Help: "gauge metic test 01" , } , [ ] string { "idc" , "ip" } ) TestMetricCounter01 = prometheus. NewCounterVec ( prometheus. CounterOpts{ Name: "test_metric_counter_01" , Help: "gauge metic counter 01" , } , [ ] string { "path" , "code" } ) hisStart = 0.1 histWidth = 0.2 TestHistogram01 = prometheus. NewHistogram ( prometheus. HistogramOpts{ Name: "test_histogram_01" , Help: "RPC latency distributions." , Buckets: prometheus. LinearBuckets ( hisStart, histWidth, 20 ) , } ) TestSummary01 = prometheus. NewSummaryVec ( prometheus. SummaryOpts{ Name: "test_summary_01" , Help: "RPC latency distributions." , Objectives: map [ float64 ] float64 { 0.5 : 0.05 , 0.9 : 0.01 , 0.99 : 0.001 } , } , [ ] string { "service" } , )
func Init ( url string , jobName string ) { pusher = push. New ( url, jobName) pusher. Collector ( TestMetricGauge01) pusher. Collector ( TestMetricCounter01) pusher. Collector ( TestHistogram01) pusher. Collector ( TestSummary01) }
func setValueGaugeAndCounter ( ) { for { TestMetricGauge01. With ( prometheus. Labels{ "idc" : "bj" , "ip" : "1.1" } ) . Set ( float64 ( rand. Intn ( 100 ) ) ) TestMetricCounter01. With ( prometheus. Labels{ "path" : "/login" , "code" : "200" } ) . Add ( float64 ( rand. Intn ( 100 ) ) ) time. Sleep ( 5 * time. Second) }
} histogram 使用Observe函数设置bucket的值 func setValueHistogram ( ) { for { v := rand. NormFloat64 ( ) TestHistogram01. Observe ( v) time. Sleep ( 100 * time. Millisecond) }
}
func setValueSummary ( ) { for { v := rand. Float64 ( ) TestSummary01. WithLabelValues ( "uniform" ) . Observe ( v) time. Sleep ( 100 * time. Millisecond) }
} func PushWork ( ) { for { err := pusher. Push ( ) if err != nil { fmt. Println ( "Could not push completion time to Pushgateway:" , err) } time. Sleep ( 5 * time. Second) } }
func main ( ) { rand. Seed ( time. Now ( ) . UnixNano ( ) ) Init ( "http://172.20.70.205:9091/" , "my_job" ) go setValueGaugeAndCounter ( ) go setValueHistogram ( ) go setValueSummary ( ) go PushWork ( ) select { }
} 举例图片 - job_name : 'pushgateway' honor_timestamps : true scrape_interval : 15sscrape_timeout : 10smetrics_path : /metricsscheme : httpstatic_configs : - targets : - 172.20.70.205: 9091 - 172.20.70.215: 9091
histogram histogram_quantile(0.95, sum by(le) (rate(test_histogram_01_bucket[5m]))) summary test_summary_01 counter rate(test_metric_counter_01[1m]) gauge test_metric_gauge_01
{ "annotations" : { "list" : [ { "builtIn" : 1 , "datasource" : "-- Grafana --" , "enable" : true , "hide" : true , "iconColor" : "rgba(0, 211, 255, 1)" , "name" : "Annotations & Alerts" , "type" : "dashboard" } ] } , "editable" : true , "gnetId" : null , "graphTooltip" : 0 , "id" : 11 , "links" : [ ] , "panels" : [ { "aliasColors" : { } , "bars" : false , "dashLength" : 10 , "dashes" : false , "datasource" : null , "fieldConfig" : { "defaults" : { } , "overrides" : [ ] } , "fill" : 1 , "fillGradient" : 0 , "gridPos" : { "h" : 9 , "w" : 12 , "x" : 0 , "y" : 0 } , "hiddenSeries" : false , "id" : 2 , "legend" : { "avg" : false , "current" : false , "max" : false , "min" : false , "show" : true , "total" : false , "values" : false } , "lines" : true , "linewidth" : 1 , "nullPointMode" : "null" , "options" : { "alertThreshold" : true } , "percentage" : false , "pluginVersion" : "7.5.1" , "pointradius" : 2 , "points" : false , "renderer" : "flot" , "seriesOverrides" : [ ] , "spaceLength" : 10 , "stack" : false , "steppedLine" : false , "targets" : [ { "exemplar" : true , "expr" : "test_metric_gauge_01" , "interval" : "" , "legendFormat" : "" , "refId" : "A" } ] , "thresholds" : [ ] , "timeFrom" : null , "timeRegions" : [ ] , "timeShift" : null , "title" : "test_metric_gauge_01" , "tooltip" : { "shared" : true , "sort" : 0 , "value_type" : "individual" } , "type" : "graph" , "xaxis" : { "buckets" : null , "mode" : "time" , "name" : null , "show" : true , "values" : [ ] } , "yaxes" : [ { "format" : "short" , "label" : null , "logBase" : 1 , "max" : null , "min" : null , "show" : true } , { "format" : "short" , "label" : null , "logBase" : 1 , "max" : null , "min" : null , "show" : true } ] , "yaxis" : { "align" : false , "alignLevel" : null } } , { "aliasColors" : { } , "bars" : false , "dashLength" : 10 , "dashes" : false , "datasource" : null , "fieldConfig" : { "defaults" : { } , "overrides" : [ ] } , "fill" : 1 , "fillGradient" : 0 , "gridPos" : { "h" : 9 , "w" : 12 , "x" : 12 , "y" : 0 } , "hiddenSeries" : false , "id" : 3 , "legend" : { "avg" : false , "current" : false , "max" : false , "min" : false , "show" : true , "total" : false , "values" : false } , "lines" : true , "linewidth" : 1 , "nullPointMode" : "null" , "options" : { "alertThreshold" : true } , "percentage" : false , "pluginVersion" : "7.5.1" , "pointradius" : 2 , "points" : false , "renderer" : "flot" , "seriesOverrides" : [ ] , "spaceLength" : 10 , "stack" : false , "steppedLine" : false , "targets" : [ { "exemplar" : true , "expr" : "rate(test_metric_counter_01[1m])" , "interval" : "" , "legendFormat" : "" , "refId" : "A" } ] , "thresholds" : [ ] , "timeFrom" : null , "timeRegions" : [ ] , "timeShift" : null , "title" : "qps" , "tooltip" : { "shared" : true , "sort" : 0 , "value_type" : "individual" } , "type" : "graph" , "xaxis" : { "buckets" : null , "mode" : "time" , "name" : null , "show" : true , "values" : [ ] } , "yaxes" : [ { "format" : "short" , "label" : null , "logBase" : 1 , "max" : null , "min" : null , "show" : true } , { "format" : "short" , "label" : null , "logBase" : 1 , "max" : null , "min" : null , "show" : true } ] , "yaxis" : { "align" : false , "alignLevel" : null } } , { "aliasColors" : { } , "bars" : false , "dashLength" : 10 , "dashes" : false , "datasource" : null , "fieldConfig" : { "defaults" : { } , "overrides" : [ ] } , "fill" : 1 , "fillGradient" : 0 , "gridPos" : { "h" : 9 , "w" : 12 , "x" : 0 , "y" : 9 } , "hiddenSeries" : false , "id" : 4 , "legend" : { "avg" : false , "current" : false , "max" : false , "min" : false , "show" : true , "total" : false , "values" : false } , "lines" : true , "linewidth" : 1 , "nullPointMode" : "null" , "options" : { "alertThreshold" : true } , "percentage" : false , "pluginVersion" : "7.5.1" , "pointradius" : 2 , "points" : false , "renderer" : "flot" , "seriesOverrides" : [ ] , "spaceLength" : 10 , "stack" : false , "steppedLine" : false , "targets" : [ { "exemplar" : true , "expr" : "histogram_quantile(0.95, sum by(le) (rate(test_histogram_01_bucket[5m])))" , "interval" : "" , "legendFormat" : "" , "refId" : "A" } ] , "thresholds" : [ ] , "timeFrom" : null , "timeRegions" : [ ] , "timeShift" : null , "title" : "histogram 分位置" , "tooltip" : { "shared" : true , "sort" : 0 , "value_type" : "individual" } , "type" : "graph" , "xaxis" : { "buckets" : null , "mode" : "time" , "name" : null , "show" : true , "values" : [ ] } , "yaxes" : [ { "format" : "short" , "label" : null , "logBase" : 1 , "max" : null , "min" : null , "show" : true } , { "format" : "short" , "label" : null , "logBase" : 1 , "max" : null , "min" : null , "show" : true } ] , "yaxis" : { "align" : false , "alignLevel" : null } } , { "aliasColors" : { } , "bars" : false , "dashLength" : 10 , "dashes" : false , "datasource" : null , "fieldConfig" : { "defaults" : { } , "overrides" : [ ] } , "fill" : 1 , "fillGradient" : 0 , "gridPos" : { "h" : 9 , "w" : 12 , "x" : 12 , "y" : 9 } , "hiddenSeries" : false , "id" : 5 , "legend" : { "avg" : false , "current" : false , "max" : false , "min" : false , "show" : true , "total" : false , "values" : false } , "lines" : true , "linewidth" : 1 , "nullPointMode" : "null" , "options" : { "alertThreshold" : true } , "percentage" : false , "pluginVersion" : "7.5.1" , "pointradius" : 2 , "points" : false , "renderer" : "flot" , "seriesOverrides" : [ ] , "spaceLength" : 10 , "stack" : false , "steppedLine" : false , "targets" : [ { "exemplar" : true , "expr" : "test_summary_01" , "interval" : "" , "legendFormat" : "" , "refId" : "A" } ] , "thresholds" : [ ] , "timeFrom" : null , "timeRegions" : [ ] , "timeShift" : null , "title" : "summary 分位值" , "tooltip" : { "shared" : true , "sort" : 0 , "value_type" : "individual" } , "type" : "graph" , "xaxis" : { "buckets" : null , "mode" : "time" , "name" : null , "show" : true , "values" : [ ] } , "yaxes" : [ { "format" : "short" , "label" : null , "logBase" : 1 , "max" : null , "min" : null , "show" : true } , { "format" : "short" , "label" : null , "logBase" : 1 , "max" : null , "min" : null , "show" : true } ] , "yaxis" : { "align" : false , "alignLevel" : null } } ] , "refresh" : "10s" , "schemaVersion" : 27 , "style" : "dark" , "tags" : [ ] , "templating" : { "list" : [ ] } , "time" : { "from" : "now-30m" , "to" : "now" } , "timepicker" : { } , "timezone" : "" , "title" : "自打点pushgatway指标" , "uid" : "Kqdgmyn7k" , "version" : 2
}
package mainimport ( "fmt" "github.com/prometheus/client_golang/prometheus" "github.com/prometheus/client_golang/prometheus/push" "math/rand" "time"
) var ( TestMetricGauge01 = prometheus. NewGaugeVec ( prometheus. GaugeOpts{ Name: "test_metric_gauge_01" , Help: "gauge metic test 01" , } , [ ] string { "idc" , "ip" } ) TestMetricCounter01 = prometheus. NewCounterVec ( prometheus. CounterOpts{ Name: "test_metric_counter_01" , Help: "gauge metic counter 01" , } , [ ] string { "path" , "code" } ) hisStart = 0.1 histWidth = 0.2 TestHistogram01 = prometheus. NewHistogram ( prometheus. HistogramOpts{ Name: "test_histogram_01" , Help: "RPC latency distributions." , Buckets: prometheus. LinearBuckets ( hisStart, histWidth, 20 ) , } ) TestSummary01 = prometheus. NewSummaryVec ( prometheus. SummaryOpts{ Name: "test_summary_01" , Help: "RPC latency distributions." , Objectives: map [ float64 ] float64 { 0.5 : 0.05 , 0.9 : 0.01 , 0.99 : 0.001 } , } , [ ] string { "service" } , ) pusher * push. Pusher
) func Init ( url string , jobName string ) { pusher = push. New ( url, jobName) pusher. Collector ( TestMetricGauge01) pusher. Collector ( TestMetricCounter01) pusher. Collector ( TestHistogram01) pusher. Collector ( TestSummary01) }
func setValueSummary ( ) { for { v := rand. Float64 ( ) TestSummary01. WithLabelValues ( "uniform" ) . Observe ( v) time. Sleep ( 100 * time. Millisecond) }
}
func setValueGaugeAndCounter ( ) { for { TestMetricGauge01. With ( prometheus. Labels{ "idc" : "bj" , "ip" : "1.1" } ) . Set ( float64 ( rand. Intn ( 100 ) ) ) TestMetricCounter01. With ( prometheus. Labels{ "path" : "/login" , "code" : "200" } ) . Add ( float64 ( rand. Intn ( 100 ) ) ) time. Sleep ( 5 * time. Second) }
} func setValueHistogram ( ) { for { v := rand. NormFloat64 ( ) TestHistogram01. Observe ( v) time. Sleep ( 100 * time. Millisecond) }
} func PushWork ( ) { for { err := pusher. Push ( ) if err != nil { fmt. Println ( "Could not push completion time to Pushgateway:" , err) } time. Sleep ( 5 * time. Second) } }
func main ( ) { rand. Seed ( time. Now ( ) . UnixNano ( ) ) Init ( "http://172.20.70.205:9091/" , "my_job" ) go setValueGaugeAndCounter ( ) go setValueHistogram ( ) go setValueSummary ( ) go PushWork ( ) select { }
} 使用golang sdk打prometheus4种指标,推送到pushgateway gauge、counter、histogram、summary的初始化 4种类似的设置值的方法 推送到pushgateway的方法 prometheus配置采集pushgateway,grafana上配大盘 


