import numpy as np
import matplotlib. pyplot as plt
from sklearn. datasets import make_blobs
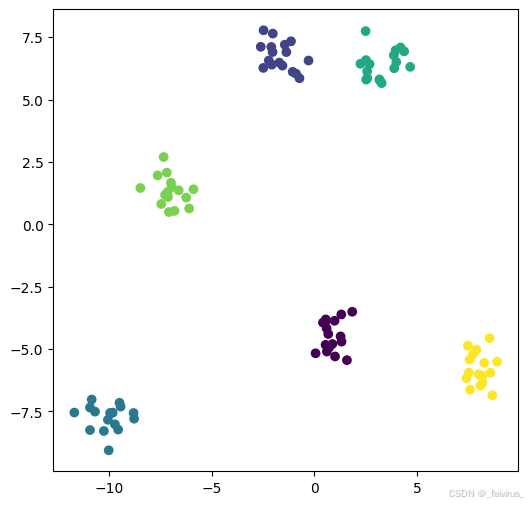
x, y = make_blobs( n_samples= 100 , centers= 6 , random_state= 100 , cluster_std= 0.6 )
plt. figure( figsize= ( 6 , 6 ) )
plt. scatter( x[ : , 0 ] , x[ : , 1 ] , c = y)
plt. show
<function matplotlib.pyplot.show(close=None, block=None)>
from scipy. spatial. distance import cdistclass KMeansModel ( ) : def __init__ ( self, k_cluster= 6 , max_iteration= 100 , centroids= [ ] ) : self. k_cluster = k_clusterself. max_iteration = max_iterationself. centroids = np. array( centroids, dtype = np. float32) def fit ( self, points) : if ( self. centroids. shape== ( 0 , ) ) : self. centroids = points[ np. random. randint( 0 , points. shape[ 0 ] , self. k_cluster) , : ] for i in range ( self. max_iteration) : distances = cdist( points, self. centroids) c_index = np. argmin( distances, axis= 1 ) if ( i == 0 ) : print ( "c shape" , c_index. shape, c_index[ 0 ] ) for i in range ( self. k_cluster) : if i in c_index: self. centroids[ i] = np. mean( points[ c_index == i] , axis= 0 ) def predict ( self, points) : distances = cdist( points, self. centroids) c_index = np. argmin( distances, axis= 1 ) return c_index
def plot_kmeans ( x, y, centroids, subplot) : plt. subplot( subplot) plt. scatter( x[ : , 0 ] , x[ : , 1 ] , c= y) plt. scatter( centroids[ : , 0 ] , centroids[ : , 1 ] , s= 100 , c= 'r' )
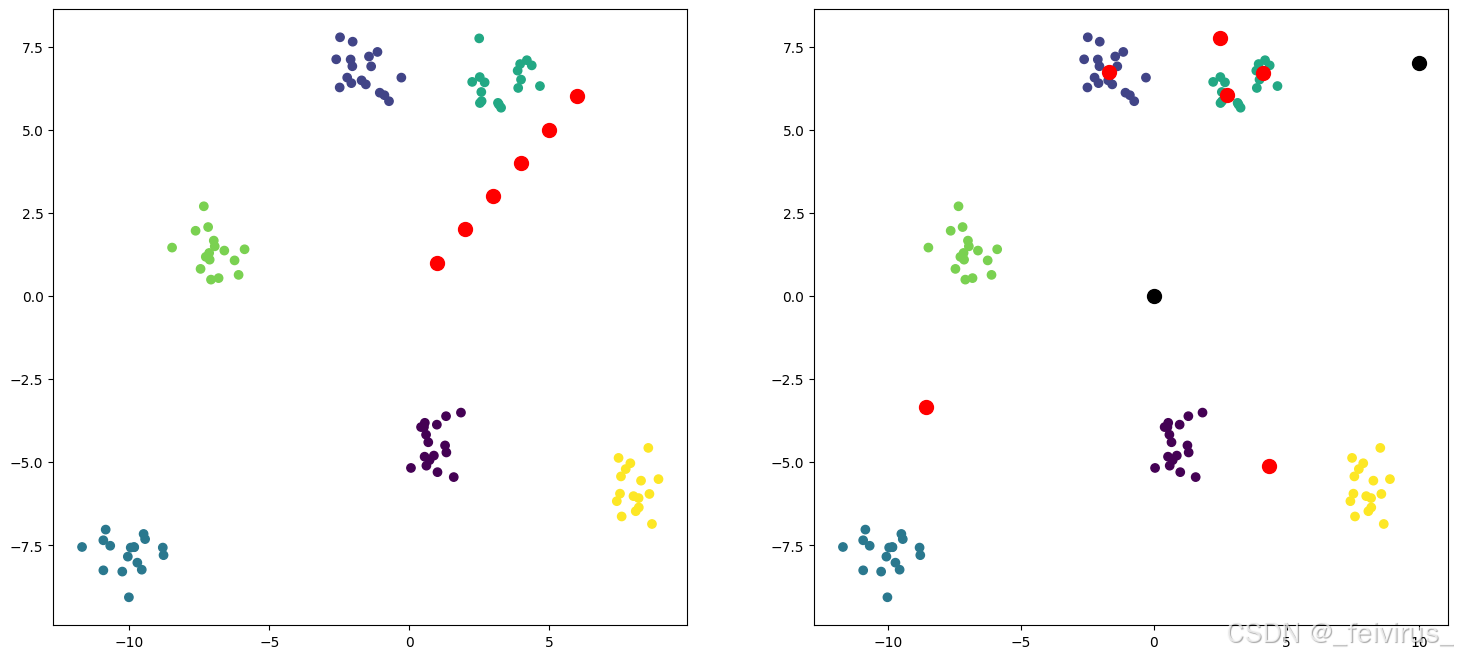
kmean_model = KMeansModel( centroids= np. array( [ [ 1 , 1 ] , [ 2 , 2 ] , [ 3 , 3 ] , [ 4 , 4 ] , [ 5 , 5 ] , [ 6 , 6 ] ] ) )
plt. figure( figsize= ( 18 , 8 ) )
plot_kmeans( x, y, kmean_model. centroids, 121 ) kmean_model. fit( x)
print ( kmean_model. centroids)
plot_kmeans( x, y, kmean_model. centroids, 122 )
x_new = np. array( [ [ 10 , 7 ] , [ 0 , 0 ] ] )
y_predict = kmean_model. predict( x_new)
print ( "predict y " , y_predict)
plt. scatter( x_new[ : , 0 ] , x_new[ : , 1 ] , s= 100 , c= "black" )
c shape (100,) 0
[[ 4.343336  -5.112518 ][-1.6609049  6.7436223][-8.57988   -3.3460388][ 2.7469435  6.05025  ][ 2.490612   7.7450833][ 4.1287684  6.6914167]]
predict y  [5 3]<matplotlib.collections.PathCollection at 0x1576e5a9850>


![[基于 Vue CLI 5 + Vue 3 + Ant Design Vue 4 搭建项目] 01 安装 nodejs 环境](https://i-blog.csdnimg.cn/direct/662a16f0307f452daa8a84a11f9b1cbb.png#pic_center)


