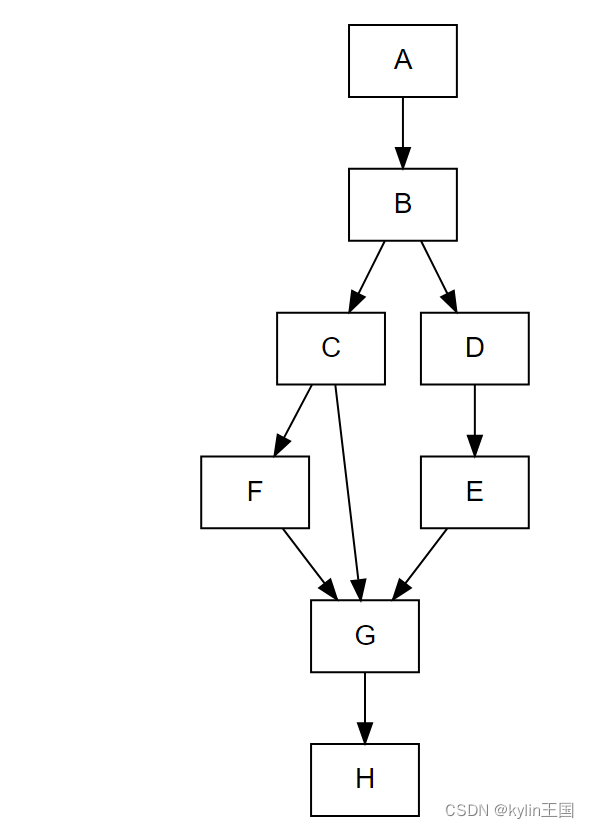
library( DiagrammeR) grViz( "digraph flowchart { node [ fontname = Helvetica, shape = rectangle] tab1 [ label = '@@1' ] tab2 [ label = '@@2' ] tab3 [ label = '@@3' ] tab4 [ label = '@@4' ] tab5 [ label = '@@5' ] tab1 -> tab2 -> tab3 -> tab4 -> tab5; } [ 1 ] : 'Questionnaire sent to n=1000 participants' [ 2 ] : 'Participants responded to questionnaire n=850' [ 3 ] : 'Participants came to clinic for evaluation n=700' [ 4 ] : 'Participants eligible for the study n=600' [ 5 ] : 'Study sample n=600' ") grViz( "digraph flowchart { node [ fontname = Helvetica, shape = rectangle] tab1 [ label = '@@1' ] tab2 [ label = '@@2' ] tab3 [ label = '@@3' ] tab4 [ label = '@@4' ] tab5 [ label = '@@5' ] tab6 [ label = '@@6' ] tab7 [ label = '@@7' ] tab8 [ label = '@@8' ] tab1 -> tab2; tab2 -> tab3 -> tab6 ; tab2 -> tab4 -> tab5; tab6 -> tab7-> tab8; tab5 -> tab7; tab3 -> tab7; } [ 1 ] : 'A' [ 2 ] : 'B' [ 3 ] : 'C' [ 4 ] : 'D' [ 5 ] : 'E' [ 6 ] : 'F' [ 7 ] : 'G' [ 8 ] : 'H' ")
