目录
- 1. 使用 prometheus client SDK 暴露指标
- 1.1. How Go exposition works
- 1.2. Adding your own metrics
- 1.3. Other Go client features
- 2. Golang Application monitoring using Prometheus
- 2.1. Metrics and Labels
- 2.2. Metrics Types
- 2.2.1. Counters:
- 2.2.2. Gauges:
- 2.2.3. Histograms:
- 2.2.4. Summaries
- 2.3. Setting Up Our Go Project
- 2.4. Adding metrics to the application
- 2.5. Dockerizing the application
- 2.6. Visualizing metrics using Grafana
1. 使用 prometheus client SDK 暴露指标
1.1. How Go exposition works
To expose Prometheus metrics in a Go application, you need to provide a /metrics HTTP endpoint. You can use the prometheus/promhttp library’s HTTP Handler as the handler function.
This minimal application, for example, would expose the default metrics for Go applications via http://localhost:2112/metrics:
package mainimport ("net/http""github.com/prometheus/client_golang/prometheus/promhttp"
)func main() {http.Handle("/metrics", promhttp.Handler())http.ListenAndServe(":2112", nil)
}
To start the application:
go run main.go
To access the metrics:
curl http://localhost:2112/metrics
1.2. Adding your own metrics
The application above exposes only the default Go metrics. You can also register your own custom application-specific metrics. This example application exposes a myapp_processed_ops_total counter that counts the number of operations that have been processed thus far. Every 2 seconds, the counter is incremented by one.
package mainimport ("net/http""time""github.com/prometheus/client_golang/prometheus""github.com/prometheus/client_golang/prometheus/promauto""github.com/prometheus/client_golang/prometheus/promhttp"
)func recordMetrics() {go func() {for {opsProcessed.Inc()time.Sleep(2 * time.Second)}}()
}var (opsProcessed = promauto.NewCounter(prometheus.CounterOpts{Name: "myapp_processed_ops_total",Help: "The total number of processed events",})
)func main() {recordMetrics()http.Handle("/metrics", promhttp.Handler())http.ListenAndServe(":2112", nil)
}
In the metrics output, you’ll see the help text, type information, and current value of the myapp_processed_ops_total counter:
# HELP myapp_processed_ops_total The total number of processed events
# TYPE myapp_processed_ops_total counter
myapp_processed_ops_total 5
You can configure a locally running Prometheus instance to scrape metrics from the application. Here’s an example prometheus.yml configuration:
scrape_configs:
- job_name: myappscrape_interval: 10sstatic_configs:- targets:- localhost:2112
1.3. Other Go client features
In this guide we covered just a small handful of features available in the Prometheus Go client libraries. You can also expose other metrics types, such as gauges and histograms, non-global registries, functions for pushing metrics to Prometheus PushGateways, bridging Prometheus and Graphite, and more.
2. Golang Application monitoring using Prometheus
In this article, you will learn the basics of Prometheus including what metrics are, the different types of metrics and when they are used. After that, you will expose metrics of a Golang application and visualize them using Grafana.
To ensure our applications’ quality, some kind of quality monitoring and quality checks need to be executed. These quality checks often compare a given metric captured from the application e.g. throughput or error rate, with some defined value e.g. error rate < 0,1%.
Prometheus is an open source monitoring and alerting tool that helps us to collect and expose these metrics from our application in an easy and reliable way.
In this article, you will learn the basics of Prometheus including what metrics are, the different types of metrics and when they are used. After that, you will expose metrics of a Golang application and visualize them using Grafana.
2.1. Metrics and Labels
Simply put, metrics measure a particular value e.g. the response time of your application over time. Once the metrics are exposed from the application using some kind of instrumented system Prometheus stores them in a time-series database and makes them promptly available using queries.
# Total number of HTTP request
http_requests_total# Response status of HTTP request
response_status# Duration of HTTP requests in seconds
http_response_time_seconds
If you have more than one service for a specific metric you can add a label to specify which service the metric is from. For example, you could add a service label to the http_requests_total metric to differentiate between each service’s request. Another useful metric would be the URL of the different response statuses:
# Total number of HTTP request
http_requests_total{service="builder"}# Response status of HTTP request
response_status{path="/"}
response_status{path="/articles"}
Augmenting metrics with the correct labels will make it easy to query them, especially when you have many different services.
2.2. Metrics Types
Prometheus provides four different metric types each with their advantages and disadvantages that make them useful for different use-cases. In this part of the article we are going to take a close look at all four of them.
2.2.1. Counters:
Counters are a simple metric type that can only be incremented or be reset to zero on restart. It is often used to count primitive data like the total number of requests to a services or number of tasks completed. Most counters are therefore named using the _total suffix e.g. http_requests_total.
# Total number of HTTP request
http_requests_total# Total number of completed jobs
jobs_completed_total
The absolute value of these counters is often irrelevant and does not give you much information about the applications state. The real information can be gathered by their evolution over time which can be obtained using the rate() function.
2.2.2. Gauges:
Gauges also represent a single numerical value but different to counters the value can go up as well as down. Therefore gauges are often used for measured values like temperature, humidy or current memory usage.
Unlike with counters the current value of a gauge is meaningful and can be directly used in graphs and tests.
2.2.3. Histograms:
Histograms are used to measure the frequency of value observations that fall into specific predefined buckets. This means that they will provide information about the distribution of a metric like response time and signal outliers.
By default Prometheus provides the following buckets: .005, .01, .025, .05, .075, .1, .25, .5, .75, 1, 2.5, 5, 7.5, 10. These buckets are not suitable for every measurement and can therefore easily be changed.
2.2.4. Summaries
Summaries are very similar to Histograms because they both expose the distribution of a given data set. The one major difference is that a Histogram estimate quantiles on the Prometheus server while Summaries are calculated on the client side.
Summaries are more accurate for some pre-defined quantiles but can be a lot more resource expensive because of the client-side calculations. That is why it is recommended to use Histograms for most use-cases.
2.3. Setting Up Our Go Project
Before we can use Prometheus, we first need to build a simple application to expose some basic metrics. For this, we will build a simple Golang HTTP server that serves a static HTML and CSS file when accessing localhost:9000.
Let’s start by creating the files needed for the project. This can be done using the following commands:
mkdir static
touch main.go Dockerfile static/index.html
The HTTP server is written using Mux and will serve the static directory containing the HTML and CSS file you created above.
package mainimport ("fmt""github.com/gorilla/mux""log""net/http"
)func main() {router := mux.NewRouter()// Serving static filesrouter.PathPrefix("/").Handler(http.FileServer(http.Dir("./static/")))fmt.Println("Serving requests on port 9000")err := http.ListenAndServe(":9000", router)log.Fatal(err)
}
The HTML file will only contain an H1 tag with “Hello World!” as its content and import a CSS file.
<html>
<head><title>Hello server</title><link rel="stylesheet" href="style.css"/>
</head>
<body>
<div><h1>Hello World!</h1>
</div>
</body>
</html>
2.4. Adding metrics to the application
Now that the application’s basic functionality is finished, we can start exposing metrics that Prometheus will later scrape. The official Golang Prometheus library automatically exposes some build-in metrics and simply needs to be imported and added to the HTTP server.
package mainimport ("fmt""github.com/gorilla/mux""log""net/http""github.com/prometheus/client_golang/prometheus/promhttp"
)func main() {router := mux.NewRouter()// Serving static filesrouter.PathPrefix("/").Handler(http.FileServer(http.Dir("./static/")))// Prometheus endpointrouter.Path("/prometheus").Handler(promhttp.Handler())fmt.Println("Serving requests on port 9000")err := http.ListenAndServe(":9000", router)log.Fatal(err)
}
Now that we have added the Prometheus library and exposed the handler on /prometheus we can see the metrics by starting the application and navigating to localhost:9000/prometheus. The output should look similar to this:
# HELP go_gc_duration_seconds A summary of the pause duration of garbage collection cycles.
# TYPE go_gc_duration_seconds summary
go_gc_duration_seconds{quantile="0"} 2.07e-05
go_gc_duration_seconds{quantile="0.25"} 7.89e-05
go_gc_duration_seconds{quantile="0.5"} 0.000137
go_gc_duration_seconds{quantile="0.75"} 0.0001781
go_gc_duration_seconds{quantile="1"} 0.0002197
go_gc_duration_seconds_sum 0.0071928
go_gc_duration_seconds_count 56
# HELP go_goroutines Number of goroutines that currently exist.
# TYPE go_goroutines gauge
go_goroutines 8
# HELP go_info Information about the Go environment.
# TYPE go_info gauge
go_info{version="go1.15"} 1
# HELP go_memstats_alloc_bytes Number of bytes allocated and still in use.
# TYPE go_memstats_alloc_bytes gauge
go_memstats_alloc_bytes 4.266136e+06
# HELP go_memstats_alloc_bytes_total Total number of bytes allocated, even if freed.
# TYPE go_memstats_alloc_bytes_total counter
go_memstats_alloc_bytes_total 1.17390144e+08
# HELP go_memstats_buck_hash_sys_bytes Number of bytes used by the profiling bucket hash table.
# TYPE go_memstats_buck_hash_sys_bytes gauge
go_memstats_buck_hash_sys_bytes 1.456289e+06
# HELP go_memstats_frees_total Total number of frees.
# TYPE go_memstats_frees_total counter
go_memstats_frees_total 435596
# HELP go_memstats_gc_cpu_fraction The fraction of this program's available CPU time used by the GC since the program started.
# TYPE go_memstats_gc_cpu_fraction gauge
go_memstats_gc_cpu_fraction 1.5705717722141224e-06
# HELP go_memstats_gc_sys_bytes Number of bytes used for garbage collection system metadata.
# TYPE go_memstats_gc_sys_bytes gauge
go_memstats_gc_sys_bytes 4.903096e+06
# HELP go_memstats_heap_alloc_bytes Number of heap bytes allocated and still in use.
# TYPE go_memstats_heap_alloc_bytes gauge
go_memstats_heap_alloc_bytes 4.266136e+06
# HELP go_memstats_heap_idle_bytes Number of heap bytes waiting to be used.
# TYPE go_memstats_heap_idle_bytes gauge
go_memstats_heap_idle_bytes 6.1046784e+07
# HELP go_memstats_heap_inuse_bytes Number of heap bytes that are in use.
# TYPE go_memstats_heap_inuse_bytes gauge
go_memstats_heap_inuse_bytes 5.210112e+06
# HELP go_memstats_heap_objects Number of allocated objects.
# TYPE go_memstats_heap_objects gauge
go_memstats_heap_objects 17572
# HELP go_memstats_heap_released_bytes Number of heap bytes released to OS.
# TYPE go_memstats_heap_released_bytes gauge
go_memstats_heap_released_bytes 6.0588032e+07
# HELP go_memstats_heap_sys_bytes Number of heap bytes obtained from system.
# TYPE go_memstats_heap_sys_bytes gauge
go_memstats_heap_sys_bytes 6.6256896e+07
# HELP go_memstats_last_gc_time_seconds Number of seconds since 1970 of last garbage collection.
# TYPE go_memstats_last_gc_time_seconds gauge
go_memstats_last_gc_time_seconds 1.61550102568985e+09
# HELP go_memstats_lookups_total Total number of pointer lookups.
# TYPE go_memstats_lookups_total counter
go_memstats_lookups_total 0
# HELP go_memstats_mallocs_total Total number of mallocs.
# TYPE go_memstats_mallocs_total counter
go_memstats_mallocs_total 453168
# HELP go_memstats_mcache_inuse_bytes Number of bytes in use by mcache structures.
# TYPE go_memstats_mcache_inuse_bytes gauge
go_memstats_mcache_inuse_bytes 27776
# HELP go_memstats_mcache_sys_bytes Number of bytes used for mcache structures obtained from system.
# TYPE go_memstats_mcache_sys_bytes gauge
go_memstats_mcache_sys_bytes 32768
# HELP go_memstats_mspan_inuse_bytes Number of bytes in use by mspan structures.
# TYPE go_memstats_mspan_inuse_bytes gauge
go_memstats_mspan_inuse_bytes 141576
# HELP go_memstats_mspan_sys_bytes Number of bytes used for mspan structures obtained from system.
# TYPE go_memstats_mspan_sys_bytes gauge
go_memstats_mspan_sys_bytes 147456
# HELP go_memstats_next_gc_bytes Number of heap bytes when next garbage collection will take place.
# TYPE go_memstats_next_gc_bytes gauge
go_memstats_next_gc_bytes 6.42088e+06
# HELP go_memstats_other_sys_bytes Number of bytes used for other system allocations.
# TYPE go_memstats_other_sys_bytes gauge
go_memstats_other_sys_bytes 1.931943e+06
# HELP go_memstats_stack_inuse_bytes Number of bytes in use by the stack allocator.
# TYPE go_memstats_stack_inuse_bytes gauge
go_memstats_stack_inuse_bytes 851968
# HELP go_memstats_stack_sys_bytes Number of bytes obtained from system for stack allocator.
# TYPE go_memstats_stack_sys_bytes gauge
go_memstats_stack_sys_bytes 851968
# HELP go_memstats_sys_bytes Number of bytes obtained from system.
# TYPE go_memstats_sys_bytes gauge
go_memstats_sys_bytes 7.5580416e+07
# HELP go_threads Number of OS threads created.
# TYPE go_threads gauge
go_threads 13
# HELP process_cpu_seconds_total Total user and system CPU time spent in seconds.
# TYPE process_cpu_seconds_total counter
process_cpu_seconds_total 1.83
# HELP process_max_fds Maximum number of open file descriptors.
# TYPE process_max_fds gauge
process_max_fds 1.048576e+06
# HELP process_open_fds Number of open file descriptors.
# TYPE process_open_fds gauge
process_open_fds 10
# HELP process_resident_memory_bytes Resident memory size in bytes.
# TYPE process_resident_memory_bytes gauge
process_resident_memory_bytes 2.8770304e+07
# HELP process_start_time_seconds Start time of the process since unix epoch in seconds.
# TYPE process_start_time_seconds gauge
process_start_time_seconds 1.61549436213e+09
# HELP process_virtual_memory_bytes Virtual memory size in bytes.
# TYPE process_virtual_memory_bytes gauge
process_virtual_memory_bytes 1.564209152e+09
# HELP process_virtual_memory_max_bytes Maximum amount of virtual memory available in bytes.
# TYPE process_virtual_memory_max_bytes gauge
process_virtual_memory_max_bytes -1
# HELP promhttp_metric_handler_requests_in_flight Current number of scrapes being served.
# TYPE promhttp_metric_handler_requests_in_flight gauge
promhttp_metric_handler_requests_in_flight 1
# HELP promhttp_metric_handler_requests_total Total number of scrapes by HTTP status code.
# TYPE promhttp_metric_handler_requests_total counter
promhttp_metric_handler_requests_total{code="200"} 447
promhttp_metric_handler_requests_total{code="500"} 0
promhttp_metric_handler_requests_total{code="503"} 0
These metrics are great, but they are not very useful most of the time. Instead of low-level metrics, we now want to expose custom metrics that will expose our application’s internal information that we can later visualize or use in tests or health checks.
Let’s start with a rather basic metric: the total number of HTTP requests made to the server represented in a counter.
package mainimport ("fmt""github.com/gorilla/mux""github.com/prometheus/client_golang/prometheus""github.com/prometheus/client_golang/prometheus/promauto""github.com/prometheus/client_golang/prometheus/promhttp""log""net/http""strconv"
)var totalRequests = prometheus.NewCounterVec(prometheus.CounterOpts{Name: "http_requests_total",Help: "Number of get requests.",},[]string{"path"},
)func prometheusMiddleware(next http.Handler) http.Handler {return http.HandlerFunc(func(w http.ResponseWriter, r *http.Request) {rw := NewResponseWriter(w)next.ServeHTTP(rw, r)totalRequests.WithLabelValues(path).Inc()})
}func init() {prometheus.Register(totalRequests)
}func main() {router := mux.NewRouter()router.Use(prometheusMiddleware)// Prometheus endpointrouter.Path("/prometheus").Handler(promhttp.Handler())// Serving static filesrouter.PathPrefix("/").Handler(http.FileServer(http.Dir("./static/")))fmt.Println("Serving requests on port 9000")err := http.ListenAndServe(":9000", router)log.Fatal(err)
}
Let’s break the code changes down for better understanding:
- The metric needs to be created using the prometheus package. The NewCounterVec() method is used to create a new counter metric.
- To expose the created metric in the HTTP handler we must register the metric to Prometheus using the register() method.
- Lastly, we need to implement the functionality of the metric in our code. Here we created and registered a new HTTP middleware that runs every time the server receives an HTTP request and increases the metric counter using the Inc() method.
The following code block contains two more metrics with different metric types: response_status and response_time perspectively.
package mainimport ("fmt""github.com/gorilla/mux""github.com/prometheus/client_golang/prometheus""github.com/prometheus/client_golang/prometheus/promauto""github.com/prometheus/client_golang/prometheus/promhttp""log""net/http""strconv"
)type responseWriter struct {http.ResponseWriterstatusCode int
}func NewResponseWriter(w http.ResponseWriter) *responseWriter {return &responseWriter{w, http.StatusOK}
}func (rw *responseWriter) WriteHeader(code int) {rw.statusCode = coderw.ResponseWriter.WriteHeader(code)
}var totalRequests = prometheus.NewCounterVec(prometheus.CounterOpts{Name: "http_requests_total",Help: "Number of get requests.",},[]string{"path"},
)var responseStatus = prometheus.NewCounterVec(prometheus.CounterOpts{Name: "response_status",Help: "Status of HTTP response",},[]string{"status"},
)var httpDuration = promauto.NewHistogramVec(prometheus.HistogramOpts{Name: "http_response_time_seconds",Help: "Duration of HTTP requests.",
}, []string{"path"})func prometheusMiddleware(next http.Handler) http.Handler {return http.HandlerFunc(func(w http.ResponseWriter, r *http.Request) {route := mux.CurrentRoute(r)path, _ := route.GetPathTemplate()timer := prometheus.NewTimer(httpDuration.WithLabelValues(path))rw := NewResponseWriter(w)next.ServeHTTP(rw, r)statusCode := rw.statusCoderesponseStatus.WithLabelValues(strconv.Itoa(statusCode)).Inc()totalRequests.WithLabelValues(path).Inc()timer.ObserveDuration()})
}func init() {prometheus.Register(totalRequests)prometheus.Register(responseStatus)prometheus.Register(httpDuration)
}func main() {router := mux.NewRouter()router.Use(prometheusMiddleware)// Prometheus endpointrouter.Path("/prometheus").Handler(promhttp.Handler())// Serving static filesrouter.PathPrefix("/").Handler(http.FileServer(http.Dir("./static/")))fmt.Println("Serving requests on port 9000")err := http.ListenAndServe(":9000", router)log.Fatal(err)
}
2.5. Dockerizing the application
Now that the metrics are implemented in the application we can Dockerize the application to make running it with Prometheus easier.
FROM golang:1.15.0# Set the Current Working Directory inside the container
WORKDIR /appRUN export GO111MODULE=on# Copy go mod and sum files
COPY go.mod go.sum ./# Download all dependencies. Dependencies will be cached if the go.mod and go.sum files are not changed
RUN go mod downloadCOPY . .# Build the application
RUN go build -o main .# Expose port 9000 to the outside world
EXPOSE 9000# Command to run the executable
CMD ["./main"]
The Dockerfile will download the dependencies, copy all files and build the application. After completing the Dockerfile, we can put the container and Prometheus into a Docker-Compose file.
version: '3.1'services:golang:build:context: ./dockerfile: Dockerfilecontainer_name: golangrestart: alwaysports:- '9000:9000'prometheus:image: prom/prometheus:v2.24.0volumes:- ./prometheus/:/etc/prometheus/- prometheus_data:/prometheuscommand:- '--config.file=/etc/prometheus/prometheus.yml'- '--storage.tsdb.path=/prometheus'- '--web.console.libraries=/usr/share/prometheus/console_libraries'- '--web.console.templates=/usr/share/prometheus/consoles'ports:- 9090:9090restart: alwaysvolumes:prometheus_data:
The only thing that we need to do now before starting the applications is configuring the Prometheus endpoint. For that, we are going to create a configuration file:
mkdir prometheus
touch prometheus/prometheus.yml
Here we define the URL of the page that Prometheus should scrape the data from, which equals to ContainerIP:Port/prometheus for our application.
global:scrape_interval: 15sevaluation_interval: 15sscrape_configs:- job_name: prometheusstatic_configs:- targets: ['localhost:9090']- job_name: golang metrics_path: /prometheusstatic_configs:- targets:- golang:9000
After adding the configuration we can start the application using docker-compose:
docker-compose up -d
Now we can access Prometheus by visiting localhost:9090 in our browser.

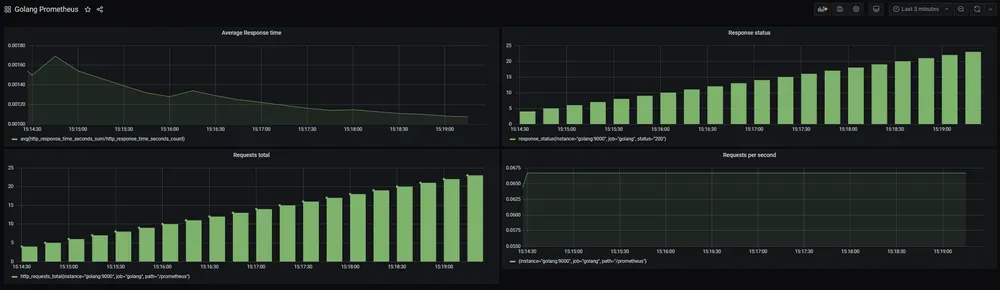
2.6. Visualizing metrics using Grafana
Now that Prometheus successfully collects the metrics, you’ll continue by visualizing the data using Grafana. For that, you’ll need to first start it by adding a Grafana container to your docker-compose file.
version: '3.1'services:grafana:image: grafana/grafana:latestcontainer_name: grafanaports:- "3000:3000"volumes:- grafana-storage:/var/lib/grafanagolang:build:context: ./dockerfile: Dockerfilecontainer_name: golangrestart: alwaysports:- '9000:9000'prometheus:image: prom/prometheus:v2.24.0volumes:- ./prometheus/:/etc/prometheus/- prometheus_data:/prometheuscommand:- '--config.file=/etc/prometheus/prometheus.yml'- '--storage.tsdb.path=/prometheus'- '--web.console.libraries=/usr/share/prometheus/console_libraries'- '--web.console.templates=/usr/share/prometheus/consoles'ports:- 9090:9090restart: alwaysvolumes:grafana-storage:prometheus_data:
After adding the Grafana container and a volume that will save the Grafana configurations and data you can restart docker-compose.
docker-compose up -d
Now that Grafana is started you can access it by visiting http://localhost:3000 in your browser. It will ask you to enter user credentials which defaults are admin as a username and password.

After logging in, you can create a new data source by navigating to Configuration>Data Source and clicking “Add data source”. After that, select Prometheus and then fill in the necessary information.

Once the data source has been successfully added, you can continue by creating a new dashboard to visualize your metrics.

The dashboard consists of panels that let you visualize metrics, so click “Add panel” to start.

Now you can select a metric by specifying it in the metric field: e.g. http_requests_total.

Your dashboard might not display as much data as mine since you have not accessed the application that often. The best way to get more data for testing is using a load testing tool.
I enjoy using the hey load testing tool, an open-source CLI application for load generation, but you can also use other tools. Once you downloaded hey you can generate traffic using the following command.
hey -z 5m -q 5 -m GET -H "Accept: text/html" http://127.0.0.1:9000
You can now experiment with the dashboard by adding other panels with metrics and customize it to your liking. If you want an example dashboard that visualizes all the metrics we have implemented, you can download it from Github and then import it.