我在第一篇可视化地图中,有一些基础介绍,本篇文章就是多展示一些效果,大家可以按需获取。
先直接上效果图
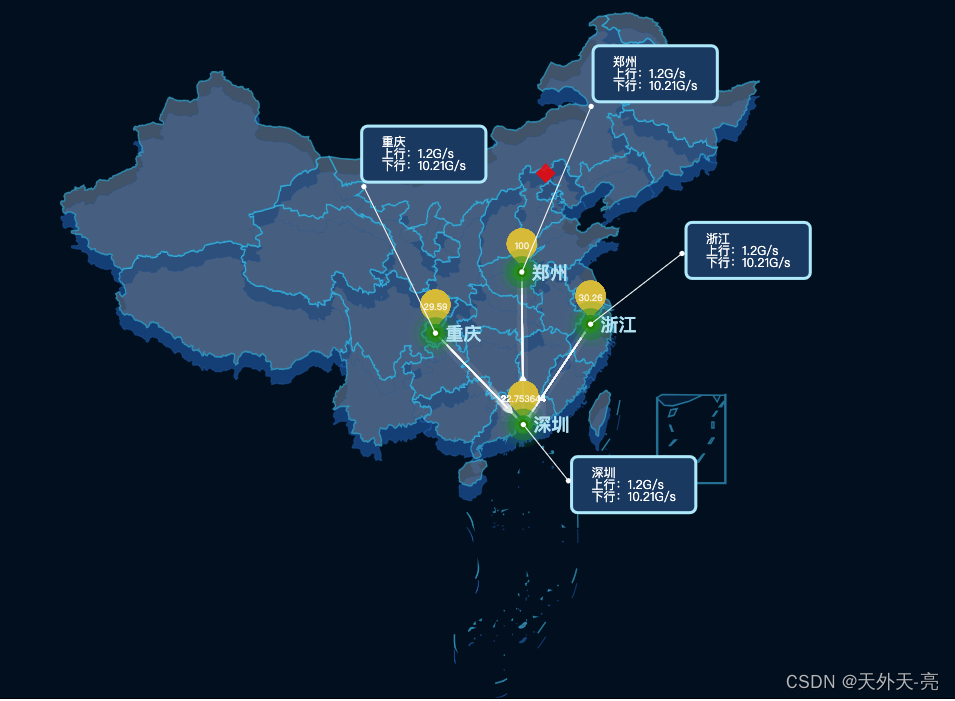
这里的配置项有用到
1、通过geo展示多层地图,这样可以像上图所示,通过错位有了一些3D效果;
2、北京的特殊图标展示通过scatter类型实现;
3、区域散点图effectScatter类型;
4、有方向流动的线,lines类型;
5、也是通过scatter实现了黄色icon的效果;
6、series最后一组类型lines,实现文本框;
let box = document.querySelector('.box');$.get('./chinas.json', function (chinaJson) {echarts.registerMap('china', chinaJson);let e = echarts.init(box);let data = [{name: "郑州",value: [114.14, 34.16, 100]},{name: "深圳",value: [114.271522, 22.753644]},{name: "重庆",value: [106.54, 29.59]},{name: "浙江",value: [120.19, 30.26]}];let LableData = [{name: "郑州",coords: [[114.14, 34.16],[120.24, 46.55]], // 线条位置[开始位置,结束位置]value: [10.21, 1.20]},{name: "深圳",coords: [[114.271522, 22.753644],[118.24, 18.55]], // 线条位置[开始位置,结束位置]value: [10.21, 1.20]},{name: "重庆",coords: [[106.54, 29.59],[100.24, 40.55]], // 线条位置[开始位置,结束位置]value: [10.21, 1.20]},{name: "浙江",coords: [[120.19, 30.26],[128.24, 35.55]], // 线条位置[开始位置,结束位置]value: [10.21, 1.20]},];let option = {backgroundColor: '#000f1e',geo: {map: 'china',aspectScale: 0.85,layoutCenter: ["50%", "50%"], //地图位置layoutSize: '100%',itemStyle: {normal: {shadowColor: '#276fce',shadowOffsetX: 0,shadowOffsetY: 15,opacity: 0.5,},emphasis: {areaColor: '#276fce'}},regions: [{name: '南海诸岛',itemStyle: {areaColor: 'rgba(0, 10, 52, 1)',borderColor: 'rgba(0, 10, 52, 1)',normal: {opacity: 0,label: {show: false,color: "#009cc9",}}},label: {show: false,color: '#FFFFFF',fontSize: 12,}}]},series: [// 常规地图{type: 'map',mapType: 'china',aspectScale: 0.85,layoutCenter: ["50%", "50%"], //地图位置layoutSize: '100%',zoom: 1, //当前视角的缩放比例// roam: true, //是否开启平游或缩放scaleLimit: { //滚轮缩放的极限控制min: 1,max: 2},itemStyle: {normal: {areaColor: '#0c274b',borderColor: '#1cccff',borderWidth: 1.5},emphasis: {areaColor: '#02102b',label: {color: "#fff"}}}},{ //首都星图标name: '首都',type: 'scatter',coordinateSystem: 'geo',data: [{name: '首都',value: [116.24, 41.55, 100],},],symbol: 'diamond',symbolSize: 20,itemStyle: {color: "#f00"},label: {normal: {show: false,color: "#f00"},emphasis: {show: false}}},// 区域散点图{type: 'effectScatter',coordinateSystem: 'geo',zlevel: 2,symbolSize: 10,rippleEffect: { //坐标点动画period: 3,scale: 5,brushType: 'fill'},label: {normal: {show: true,position: 'right',formatter: '{b}',color: '#b3e2f2',fontWeight: "bold",fontSize: 18}},data: data,itemStyle: { //坐标点颜色normal: {show: true,color: 'green',shadowBlur: 20,shadowColor: '#fff'},emphasis: {areaColor: '#f00'}},},// 线 和 点{type: 'lines',zlevel: 1, //设置这个才会有轨迹线的小尾巴polyline: true,effect: {show: true,period: 10,trailLength: 0.7,color: '#fff', //流动点颜色symbol: 'arrow',symbolSize: 6},lineStyle: {normal: {color: '#fff', //线条颜色width: 1.5,curveness: 0.2,shadowColor: '#fff',}},data: [{fromName: "深圳",toName: "郑州",coords: [[114.271522, 22.753644],[114.14, 34.16],[114.271522, 22.753644]]},{fromName: "深圳",toName: "浙江",coords: [[114.271522, 22.753644],[120.19, 30.26],[114.271522, 22.753644]]},{fromName: "深圳",toName: "重庆",coords: [[114.271522, 22.753644],[106.54, 29.59],[114.271522, 22.753644]]}],},// 黄色icon{name: 'lable',type: 'scatter',coordinateSystem: 'geo',symbol: 'pin',symbolSize: [50, 50],label: {normal: {show: true,textStyle: {color: '#fff',fontSize: 9,},formatter(value) {return value.data.value[2]}}},itemStyle: {normal: {color: '#D8BC37', //标志颜色}},data: data,showEffectOn: 'render',rippleEffect: {brushType: 'stroke'},hoverAnimation: true,zlevel: 1},// 文本框,白色圆点{type: 'lines',zlevel: 3,symbol: 'circle',symbolSize: [5, 5],color: '#ff8003',opacity: 1,label: {show: true,padding: [10, 20],color: '#fff',backgroundColor: "#1a3961",borderColor: '#aee9fb',borderWidth: 3,borderRadius: 6,formatter(params) let arr = [params.name, "上行:" + params.value[1] + "G/s", "下行:" + params.value[0] + "G/s"];return arr.join("\n")},textStyle: {align: 'left',lineHeight: 20}/* normal: {textStyle: {color: '#fff',fontSize: 9,},formatter (value){return value.data.value[2]},}*/},lineStyle: {type: 'solid',color: '#fff',width: 1,opacity: 1,},data: LableData,},]};e.setOption(option);});
