二分类问题
- 1. 数据导入
- 2. RF模型构建
- 2.1 调参:mtry和ntree
- 2.2 运行模型
- 3. 模型测试
- 4.绘制混淆矩阵
- 5.绘制ROC曲线
- 6. 参考
1. 数据导入
library(dplyr) #数据处理使用
library(data.table) #数据读取使用
library(randomForest) #RF模型使用
library(caret) # 调参和计算模型评价参数使用
library(pROC) #绘图使用
library(ggplot2) #绘图使用
library(ggpubr) #绘图使用
library(ggprism) #绘图使用
library(skimr) #查看数据分布
library(caTools) #训练集和测试集划分
setwd("D:/BaiduNetdiskDownload")
# 读取数据
data <- fread("data.txt",data.table = F)  # 替换为你的数据文件名或路径
as.data.frame(data)
skim(data)#数据鸟瞰
colnames(data)
hist(data$feature7, breaks = 50) # 查看数据分布data <- data[1:1000, ] # 选择前1000个样本进行计算

数据一共包含了35723个样本,214个特征,选择其中前1000个样本进行模型构建(数据太大,这样更快一些)。

查看一下数据分布情况,是不是符合一定的规律,如正态性之类的。
2. RF模型构建
数据集分割为训练集和测试集
# 分割数据为训练集和测试集
set.seed(123)  # 设置随机种子,保证结果可复现
split <- sample.split(data$type, SplitRatio = 0.8)  # 将数据按照指定比例分割
train_data <- subset(data, split == TRUE)  # 训练集
test_data <- subset(data, split == FALSE)  # 测试集# 定义训练集特征和目标变量
X_train <- train_data[, -1]
y_train <- as.factor(train_data[, 1]) #将第一列的标签转换为因子变量
2.1 调参:mtry和ntree
mtry:随机选择特征数目
# 2.1 mtry的取值是平方根(对于分类问题)或总特征数的三分之一(对于回归问题)
# mtry: 表示每棵决策树在进行节点分裂时考虑的特征数量
# 创建训练控制对象
ctrl <- trainControl(method = "cv", number = 10) # 选择10折交叉验证。
# 定义参数网格
grid <- expand.grid(mtry = c(2: 6))  # 每棵树中用于分裂的特征数量,这里只是随便给的测试,主要为了介绍如何调参,并非最优选择。# 使用caret包进行调参
rf_model <- train(x = X_train, y = y_train,method = "rf",trControl = ctrl,tuneGrid = grid)# 输出最佳模型和参数
print(rf_model)
结果:
Random Forest 800 samples
213 predictors2 classes: 'malignant', 'normal' No pre-processing
Resampling: Cross-Validated (10 fold)
Summary of sample sizes: 720, 720, 720, 721, 720, 719, ...
Resampling results across tuning parameters:mtry  Accuracy   Kappa    2     0.9650768  0.90602323     0.9663268  0.90982194     0.9650768  0.90654335     0.9675768  0.91384086     0.9675768  0.9141520Accuracy was used to select the optimal model using the largest value.
The final value used for the model was mtry = 5.
选择mtry=5即可
ntree:
# 调整Caret没有提供的参数
# 如果我们想调整的参数Caret没有提供,可以用下面的方式自己手动调参。
# 用刚刚调参的最佳mtry值固定mtry
grid <- expand.grid(mtry = c(5))  # 每棵树中用于分裂的特征数量# 定义模型列表,存储每一个模型评估结果
modellist <- list()# 调整的参数是决策树的数量
for (ntree in c(50, 70, 90)) {set.seed(123)fit <- train(x = X_train, y = y_train, method="rf", metric="Accuracy", tuneGrid=grid, trControl=ctrl, ntree=ntree)key <- toString(ntree)modellist[[key]] <- fitprint(ntree)
}# compare results
results <- resamples(modellist)
# 输出最佳模型和参数
summary(results)
结果:
Call:
summary.resamples(object = results)Models: 50, 70, 90
Number of resamples: 10 Accuracy Min.  1st Qu.    Median      Mean 3rd Qu.      Max. NA's
50 0.9500 0.962500 0.9748418 0.9687492   0.975 0.9875000    0
70 0.9375 0.953125 0.9688233 0.9637647   0.975 0.9750000    0
90 0.9375 0.962500 0.9748418 0.9674838   0.975 0.9876543    0Kappa Min.   1st Qu.    Median      Mean   3rd Qu.      Max. NA's
50 0.8624248 0.9016393 0.9330971 0.9177543 0.9354318 0.9682035    0
70 0.8360656 0.8754931 0.9164091 0.9043374 0.9354318 0.9373532    0
90 0.8360656 0.8992677 0.9330971 0.9144723 0.9354318 0.9673519    0
选择ntree为90即可
2.2 运行模型
# 使用最佳参数训练最终模型
final_model <- randomForest(x = X_train, y = y_train,mtry = 5,ntree = 90)
# 输出最终模型
print(final_model)
结果:
Call:randomForest(x = X_train, y = y_train, ntree = 90, mtry = 5) Type of random forest: classificationNumber of trees: 90
No. of variables tried at each split: 5OOB estimate of  error rate: 2.38%
Confusion matrix:malignant normal class.error
malignant       586      5 0.008460237
normal           14    195 0.066985646
3. 模型测试
# 在测试集上进行预测
X_test <- test_data[, -1]
y_test <- as.factor(test_data[, 1])
test_predictions <- predict(final_model, newdata = test_data)# 计算模型指标
confusion_matrix <- confusionMatrix(test_predictions, y_test)
accuracy <- confusion_matrix$overall["Accuracy"]
precision <- confusion_matrix$byClass["Pos Pred Value"]
recall <- confusion_matrix$byClass["Sensitivity"]
f1_score <- confusion_matrix$byClass["F1"]# 输出模型指标
print(confusion_matrix)
print(paste("Accuracy:", accuracy))
print(paste("Precision:", precision))
print(paste("Recall:", recall)) # sensitivity
print(paste("F1 Score:", f1_score))
结果:
> print(confusion_matrix)
Confusion Matrix and StatisticsReference
Prediction  malignant normalmalignant       146      3normal            2     49Accuracy : 0.975           95% CI : (0.9426, 0.9918)No Information Rate : 0.74            P-Value [Acc > NIR] : <2e-16          Kappa : 0.9346          Mcnemar's Test P-Value : 1               Sensitivity : 0.9865          Specificity : 0.9423          Pos Pred Value : 0.9799          Neg Pred Value : 0.9608          Prevalence : 0.7400          Detection Rate : 0.7300          Detection Prevalence : 0.7450          Balanced Accuracy : 0.9644          'Positive' Class : malignant       > print(paste("Accuracy:", accuracy))
[1] "Accuracy: 0.975"
> print(paste("Precision:", precision))
[1] "Precision: 0.979865771812081"
> print(paste("Recall:", recall)) # sensitivity
[1] "Recall: 0.986486486486487"
> print(paste("F1 Score:", f1_score))
[1] "F1 Score: 0.983164983164983"
4.绘制混淆矩阵
# 绘制混淆矩阵热图
# 将混淆矩阵转换为数据框
confusion_matrix_df <- as.data.frame.matrix(confusion_matrix$table)
colnames(confusion_matrix_df) <- c("cluster1","cluster2")
rownames(confusion_matrix_df) <- c("cluster1","cluster2")
draw_data <- round(confusion_matrix_df / rowSums(confusion_matrix_df),2)
draw_data$real <- rownames(draw_data)
draw_data <- melt(draw_data)ggplot(draw_data, aes(real,variable, fill = value)) +geom_tile() +geom_text(aes(label = scales::percent(value))) +scale_fill_gradient(low = "#F0F0F0", high = "#3575b5") +labs(x = "True", y = "Guess", title = "Confusion matrix") +theme_prism(border = T)+theme(panel.border = element_blank(),axis.ticks.y = element_blank(),axis.ticks.x = element_blank(),legend.position="none")

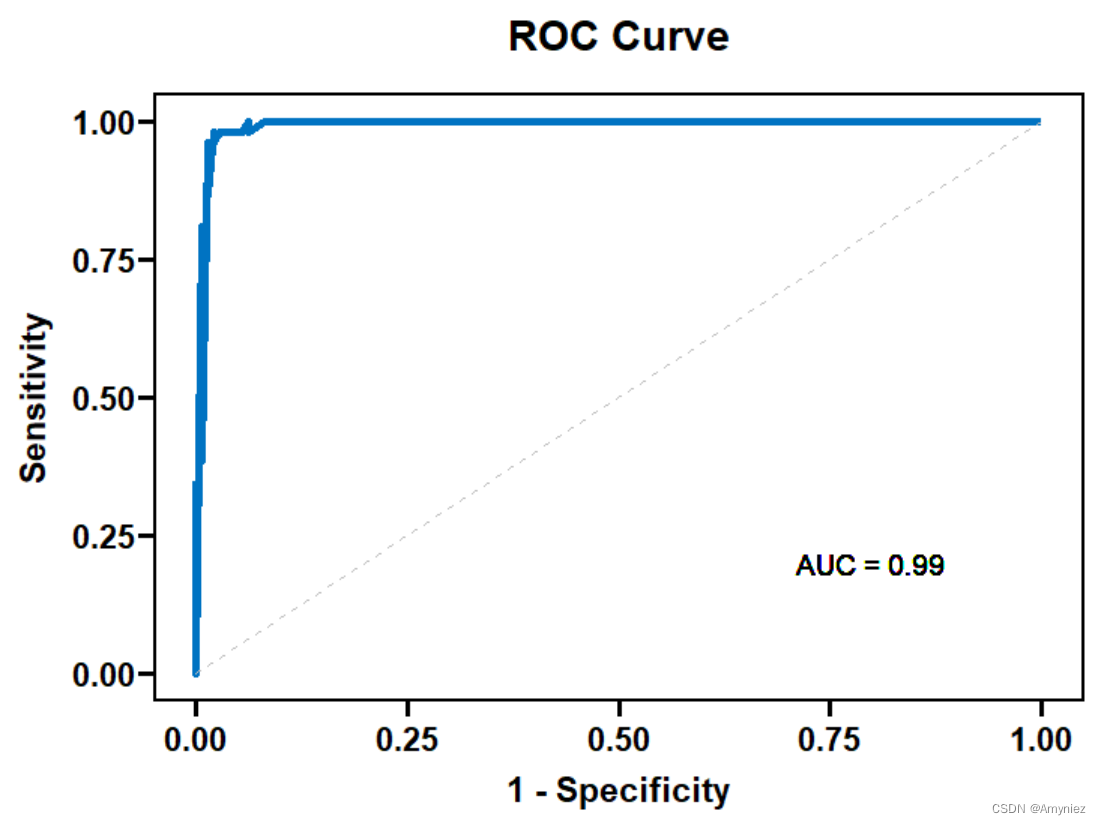
5.绘制ROC曲线
# 绘制ROC曲线需要将预测结果以概率的形式输出
test_predictions <- predict(final_model, newdata = test_data,type = "prob")# 计算ROC曲线的参数
roc_obj <- roc(response = y_test, predictor = test_predictions[, 2])
roc_auc <- auc(roc_obj)# 将ROC对象转换为数据框
roc_data <- data.frame(1 - roc_obj$specificities, roc_obj$sensitivities)# 绘制ROC曲线
ggplot(roc_data, aes(x = 1 - roc_obj$specificities, y = roc_obj$sensitivities)) +geom_line(color = "#0073C2FF", size = 1.5) +geom_segment(aes(x = 0, y = 0, xend = 1, yend = 1), linetype = "dashed", color = "gray") +geom_text(aes(x = 0.8, y = 0.2, label = paste("AUC =", round(roc_auc, 2))), size = 4, color = "black") +coord_cartesian(xlim = c(0, 1), ylim = c(0, 1)) +theme_pubr() +labs(x = "1 - Specificity", y = "Sensitivity") +ggtitle("ROC Curve") +theme(plot.title = element_text(size = 14, face = "bold"))+theme_prism(border = T)
6. 参考
- 机器学习之分类器性能指标之ROC曲线、AUC值


