vue2 echarts饼状图,柱状图,折线图,简单封装以及使用
1. 直接上代码(复制可直接用,请根据自己的文件修改引用地址,图表只是简单封装,可根据自身功能,进行进一步配置。)
2. 安装echarts npm install echarts --save
3. 安装 npm install element-resize-detector --save(注:该配置在博客最底部 用于 echarts 宽高计算等)
4. 柱状图简单封装
-
先上菜单目录
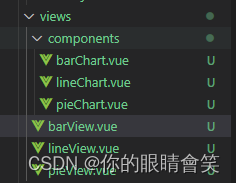](https://img-blog.csdnimg.cn/direct/409d8b3fafee4dc4a12c730441d2a1bf.png)
-
新建 barChart.vue
// barChart.vue<template><div :style="{ height: height, width: width }" />
</template><script>
import * as echarts from "echarts";
import resize from "@/echarts/mixins/resize";
export default {mixins: [resize],props: {width: {type: String,default: "100%",},height: {type: String,default: "280px",},chartData: {type: Object,required: true,},},data() {return {chart: null,};},watch: {// 监听表数据变化,重新初始化图表chartData: {deep: true,handler(val) {if (this.chart) {this.$nextTick(() => {this.initChart();});}},},},mounted() {// 初始化图表this.initChart();},beforeDestroy() {// 页面销毁时 销毁图表if (!this.chart) {return;}this.chart.dispose();this.chart = null;},methods: {initChart() {this.chart = echarts.init(this.$el);this.setOptions(this.chartData);},// 图表配置项setOptions(chartData) {const { data = [], color = [], yLabel = "" } = chartData;const names = data.map((item) => item.name);const values = data.map((item) => {if (color.length) {return {value: item.value,itemStyle: {color: new echarts.graphic.LinearGradient(0, 0, 0, 1, [{ offset: 0, color: color[0][1] },{ offset: 1, color: color[0][2] },]),},};} else {return {value: item.value,itemStyle: {// 此处设置柱状图的渐变color: new echarts.graphic.LinearGradient(0, 0, 0, 1, [{ offset: 0, color: "rgba(19, 179, 228, 0.2)" },{ offset: 1, color: "rgba(19, 179, 228, 1)" },]),},};}});const valuesDefaultItem = data.map((item) => {if (color.length) {// 此处判断 是否使用传入的颜色return {value: 0,itemStyle: {color: color[0][3],},emphasis: {itemStyle: {color: color[0][3],},},};} else {return {value: 0,itemStyle: {  // 柱状图顶部颜色color: 'rgb(19, 179, 228)',},emphasis: {itemStyle: {color: '#333',  // 柱状图顶部hover时的颜色},},};}});const valuesMax = data.map((item) => item.value / 5);const options = {grid: {top: 50,left: 20,right: 20,bottom: 0,containLabel: true,},tooltip: {trigger: "axis",formatter: `{b}<br />{c}${yLabel}`,axisPointer: {// 坐标轴指示器,坐标轴触发有效type: "shadow", // 默认为直线,可选为:'line' | 'shadow'shadowStyle: {color: "#e7baba61", // 鼠标移入时的背景色},},borderColor: "rgb(19, 179, 228)", // 鼠标移入时 悬浮框border样式backgroundColor: "rgba(6,167,205,.9)",  // 鼠标移入时 悬浮框背景样式padding: 10, // 鼠标移入时 悬浮框paddingtextStyle: { // 鼠标移入时 悬浮框内容样式fontSize: 14,fontWeight: 400,color: "yellow",},},xAxis: {data: names,nameLocation: "center",axisLabel: {rotate: 0,interval: 0,align: "center",// X轴  字体样式textStyle: {color: "#333333",fontSize: 12,fontWeight: 500,},// 此处设置 X轴  多出3个字符就进行换行(可自定义设置)// formatter: function (params) {//   let newParamsName = ""; // 拼接后的新字符串//   let paramsNameNumber = params.length; // 实际标签数//   let provideNumber = 3; // 每行显示的字数//   let rowNumber = Math.ceil(paramsNameNumber / provideNumber); // 如需换回,算出要显示的行数//   if (paramsNameNumber > provideNumber) {//     /** 循环每一行,p表示行 *///     for (let i = 0; i < rowNumber; i++) {//       let tempStr = ""; // 每次截取的字符串//       let start = i * provideNumber; // 截取位置开始//       let end = start + provideNumber; // 截取位置结束//       // 最后一行的需要单独处理//       if (i == rowNumber - 1) {//         tempStr = params.substring(start, paramsNameNumber);//       } else {//         tempStr = params.substring(start, end) + "\n";//       }//       newParamsName += tempStr;//     }//   } else {//     newParamsName = params;//   }//   return newParamsName;// },},axisTick: {show: false,},axisLine: {show: false,},z: 10,},dataZoom: [{type: "inside",start: 20, //数据窗口范围的起始百分比。范围是:0 ~ 100。表示 0% ~ 100%。end: 100,xAxisIndex: 0, //设置控制xAxis// yAxisIndex: 0, //设置控制yAxiszoomOnMouseWheel: true, //设置鼠标滚轮不能触发缩放。},],yAxis: {name: yLabel, // Y周单位nameTextStyle: { // 单位样式color: "#333",align: "center",},// y轴刻度样式axisLabel: {textStyle: {color: "#333333",fontSize: 12,fontWeight: 400,},},// y轴刻度横线样式splitLine: {lineStyle: {color: "#dddddd",},},// 是否显示y轴axisLine: {show: true,},},series: [{type: "bar",barMaxWidth: 36,label: {show: true,position: "top",distance: 4,color: "#fff",fontSize: 13,fontWeight: 400,formatter: `{c}`,},data: values,stack: "one",},// 设置柱状图顶部的样式{type: "bar",barMaxWidth: 60,stack: "one",barMinHeight: 3,barMaxHeight: 3,cursor: "default",data: valuesDefaultItem,},{type: "bar", //占位barMaxWidth: 36, // 设置柱状图宽度stack: "one",barMinHeight: 3,barMaxHeight: 3,cursor: "default",emphasis: {itemStyle: {color: "transparent",},},itemStyle: {color: "transparent",},data: valuesMax,},],};console.log(options);this.chart.setOption(options);},},
};
</script>
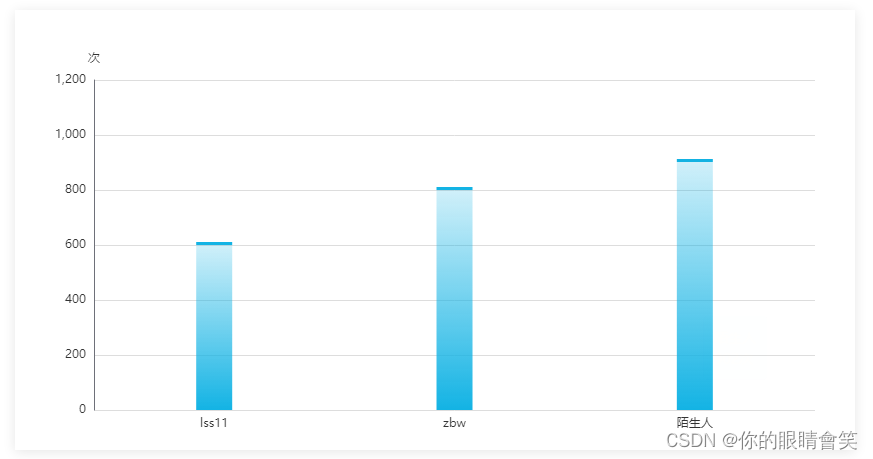
5. 柱状图组件使用
<template><div class="about"><div class="box-card"><div style="width:100%;height:100%"><barChart :chartData="chartData" height="100%"></barChart></div></div></div>
</template>
<script>
import barChart from "./components/barChart.vue"; // 柱状图
export default {components: {barChart,},data() {return {chartData: {yLabel: "次",color: [],data: [],},};},mounted(){// 调用接口this.getFaceData()},methods: {getFaceData() {// 此处应该调用接口// 暂时使用假数据this.chartData.data = [{name: "admin11",value: 505,},{name: "lss11",value: 600,},{name: "zbw",value: 800,},{name: "陌生人",value: 902,},];},},
};
</script>
<style lang="scss">
.box-card {width: 800px;height: 400px;box-shadow: 0 2px 12px 0 rgba(0, 0, 0, 0.1);padding: 20px;margin: 20px;
}
</style>
6. 饼状图简单封装
- 新建 pieChart.vue
//pieChart.vue<template><div :style="{ height: height, width: width }" />
</template>
<script>
import * as echarts from "echarts";
import resize from "@/echarts/mixins/resize";
export default {mixins: [resize],props: {width: {type: String,default: "100%",},height: {type: String,default: "280px",},chartData: {type: Object,required: true,},},data() {return {chart: null,};},watch: {// 监听表数据变化,重新初始化图表chartData: {deep: true,handler(val) {if (this.chart) {this.$nextTick(() => {this.initChart();});}},},},mounted() {// 初始化图表this.initChart();},beforeDestroy() {// 页面销毁时 销毁图表if (!this.chart) {return;}this.chart.dispose();this.chart = null;},methods: {initChart() {this.chart = echarts.init(this.$el);this.setOptions(this.chartData);},// 图表配置项setOptions(chartData) {// 图表数据const data = chartData.data;// 计算图标中心的数据总值let sum = data.reduce((pre, cur, index, arr) => {return pre + cur.value;}, 0);// 图表中心显示的名称let name = chartData.name;const options = {// 自定义设置图表颜色color: ["rgb(53, 136, 229)","rgb(13, 235, 251)","rgb(227, 59, 90)","rgb(255, 147, 38)","rgb(176, 210, 231)","rgb(62, 255, 194)","rgb(138, 92, 247)","rgb(25, 120, 162)","rgb(67, 207, 124)","rgb(255, 195, 0)",],// 鼠标hover时显示的浮窗tooltip: {trigger: "item",formatter: "{b}: {c} ({d}%)",borderColor: "transparent",backgroundColor: "rgba(6,167,205,.9)",padding: 10,textStyle: {fontSize: 14,fontWeight: 400,color: "#fffafa",},},legend: {type: "scroll", //这里添加scroll就可以分页了orient: "vertical",  //图例列表的布局朝向 horizontal (默认顶部)vertical(默认右边)right: "0%",// 'circle'(圆形),'rect(矩形)','roundRect(矩形边角为圆弧)'// 'triangle(三角形)','diamond(矩形)','pin(形状类似于锤子的尾部)','arrow(飞机形状)','none'icon: "circle",top: "10%",bottom: "30%",// 设置图例文字的样式formatter: function (name) {console.log(name, 99999999);let arr = ["{b|" + name + "}"];return arr.join(",");},textStyle: {//样式rich: {a: {fontSize: 10,color: "yellow",},// 设置图例的颜色和文字大小b: {// 图例文字大小fontSize: 10,// 图例文字颜色color: "red",},},},},series: [{minShowLabelAngle: 30,type: "pie",startAngle: 30,radius: ["50%", "70%"],center: ["40%", "50%"], // 设置图表的位置avoidLabelOverlap: false,itemStyle: {// 图表块周围的红色边// borderColor: "red",// 图表块周围的红色边宽度// borderWidth: 1,},// 引导线名称样式label: {formatter: "{b}  {c}",color: "#333",},// 引导线样式labelLine: {lineStyle: {color: "#dddddd",},},data: data,},{minShowLabelAngle: 5,type: "pie",center: ["40%", "50%"], // 设置图表的位置radius: ["40%", "40%"],hoverAnimation: false,label: {normal: {show: true,position: "center",color: "#333",formatter: "{total|" + sum + "}" + "\n\r" + `{active|${name}}`,// 总数字样式rich: {total: {fontSize: 26,fontWeight: 600,color: "yellow",},// 名称样式active: {fontSize: 14,fontWeight: 400,color: "#f73f62",lineHeight: 30,},},},emphasis: {//中间文字显示show: true,},},lableLine: {normal: {show: false,},emphasis: {show: true,},tooltip: {show: false,},},// 内部圈样式itemStyle: {color: "green",borderColor: "green",borderWidth: 1,},tooltip: {show: false,},cursor: "default",data: [{ value: 1, name: "1" }],},],};this.chart.setOption(options);},},
};
</script>
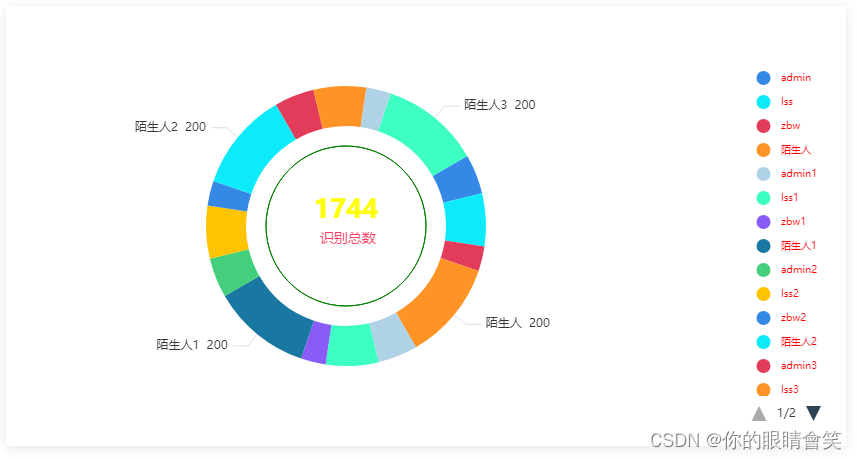
7. 饼状图组件使用
<template><div class="about"><div class="box-card"><div style="width:100%;height:100%"><pieChart :chartData="chartData" height="100%"></pieChart></div></div></div>
</template>
<script>
// 引入饼图组件
import pieChart from "./components/pieChart.vue";  // 饼状图
export default {components: {pieChart, // 饼图组件},data() {return {chartData: {name: "识别总数", // 表名data: [], // 表数据},};},mounted(){// 调用接口this.getFaceData()},methods: {getFaceData() {// 此处应该调用接口// 暂时使用假数据this.chartData.data = [{name: "admin",value: 80,},{name: "lss",value: 106,},{name: "zbw",value: 50,},{name: "陌生人",value: 200,},{name: "admin1",value: 80,},{name: "lss1",value: 106,},{name: "zbw1",value: 50,},{name: "陌生人1",value: 200,},{name: "admin2",value: 80,},{name: "lss2",value: 106,},{name: "zbw2",value: 50,},{name: "陌生人2",value: 200,},{name: "admin3",value: 80,},{name: "lss3",value: 106,},{name: "zbw3",value: 50,},{name: "陌生人3",value: 200,},];},},
};
</script>
<style lang="scss">
.box-card {width: 800px;height: 400px;box-shadow: 0 2px 12px 0 rgba(0, 0, 0, 0.1);padding: 20px;margin: 20px;
}
</style>
8. 折线图简单封装
- 新建 lineChart.vue
// lineChart.vue<template><div :style="{ height: height, width: width }" />
</template><script>
import * as echarts from "echarts";
import resize from "@/echarts/mixins/resize";
export default {mixins: [resize],props: {width: {type: String,default: "100%",},height: {type: String,default: "280px",},chartData: {type: Object,required: true,},echartsName: {type: String,default: "",},echartsUnit: {type: String,default: "",},},data() {return {chart: null,color: ["rgb(62, 255, 194)","rgb(255, 195, 0)","rgb(53, 136, 229)","rgb(13, 235, 251)","rgb(227, 59, 90)","rgb(255, 147, 38)","rgb(176, 210, 231)","rgb(138, 92, 247)","rgb(25, 120, 162)","rgb(67, 207, 124)",],};},watch: {// 监听表数据变化,重新初始化图表chartData: {deep: true,handler(val) {if (this.chart) {this.$nextTick(() => {this.initChart();});}},},},mounted() {// 初始化图表this.initChart();},beforeDestroy() {// 页面销毁时 销毁图表if (!this.chart) {return;}this.chart.dispose();this.chart = null;},methods: {initChart() {this.chart = echarts.init(this.$el);this.setOptions(this.chartData);},// 图表配置项setOptions(chartData) {let that = this;const name = chartData.name;const label = chartData.label;let series = [];let arr = Object.keys(chartData.data);arr.forEach((v, index) => {series.push({name: name[index],type: "line",symbol: "circle",symbolSize: 6,showSymbol: false,// 此处是折线图的颜色itemStyle: {color: that.color[index],},lineStyle: {color: that.color[index],},// 折线图内部区域的颜色areaStyle: {color: new echarts.graphic.LinearGradient(0, 0, 0, 1, [{ offset: 1, color: "rgba(0, 206, 218, 0.08)" },{ offset: 0, color: that.color[index] },]),},data: chartData.data[v],});});const options = {// 图例位置grid: {top: 50,left: 50,right: 60,bottom: 20,containLabel: true,},legend: {top: 8,data: name,textStyle: {color: "#333",fontSize: 12,lineHeight: 20,},},//  此处判断是否使用自定义 浮框tooltip: that.echartsName? {trigger: "axis",axisPointer: {type: "line",lineStyle: {color: "rgba(0, 206, 218, 1)",},},borderColor: "transparent",backgroundColor: "rgba(6,167,205,.9)",padding: 10,textStyle: {fontSize: 14,fontWeight: 400,color: "#fffafa",},// 自定义tipformatter: function (params) {var htmlStr = "<div>动环信息" + "<br/>";htmlStr += "名称:" + that.echartsName + "<br/>";htmlStr += "数值:" + params[0].value + "<br/>";htmlStr += "时间:" + params[0].name + "<br/>";htmlStr += "</div>";return htmlStr;},}: {// 默认tiptrigger: "axis",axisPointer: {type: "line",lineStyle: {color: "rgba(0, 206, 218, 1)",},},borderColor: "transparent",backgroundColor: "rgba(6,167,205,.9)",padding: 10,textStyle: {fontSize: 14,fontWeight: 400,color: "#fffafa",},},dataZoom: [{type: "inside",start: 20, //数据窗口范围的起始百分比。范围是:0 ~ 100。表示 0% ~ 100%。end: 100,xAxisIndex: 0, //设置控制xAxis// yAxisIndex: 0, //设置控制yAxiszoomOnMouseWheel: true, //设置鼠标滚轮不能触发缩放。},],xAxis: [{type: "category",boundaryGap: false,showMinLabel: true,showMaxLabel: true,data: label,axisLabel: {// X 轴刻度样式textStyle: {color: "#333",fontSize: 12,fontWeight: 500,},},axisTick: {show: false,},axisLine: {show: false,},},],yAxis: [{type: "value",minInterval: 1,//  Y轴刻度颜色axisLabel: {textStyle: {color: "#333",fontSize: 12,fontWeight: 400,},},// Y 轴刻度线splitLine: {lineStyle: {color: "#dddddd",},},axisLine: {show: false,},axisTick: {show: false,},name: this.echartsUnit, // Y轴显示 单位nameTextStyle: {color: "#dddddd",padding: [0, 0, 12, 0],},},],series: series,};this.chart.setOption(options);},},
};
</script>
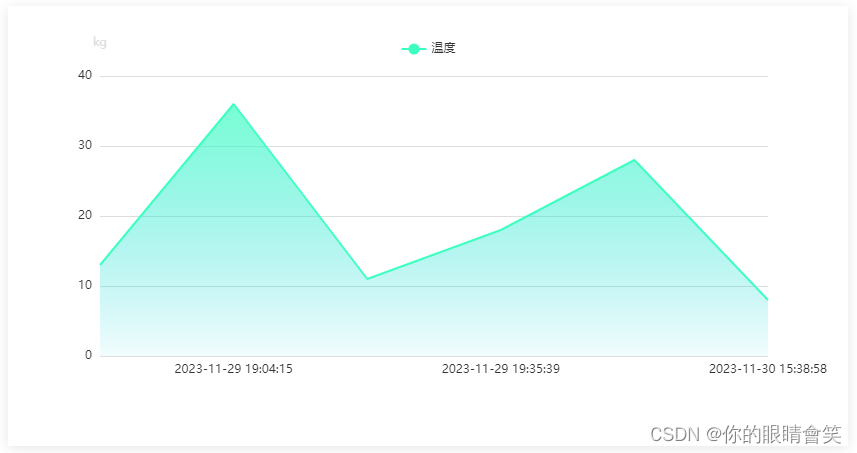
9. 折线图组件使用
<template><div class="about"><div class="box-card"><lineChart:chartData="chartData":echartsName="echartsName":echartsUnit="echartsUnit":height="'calc(100% - 30px)'"></lineChart></div></div>
</template><script>
import lineChart from "./components/lineChart.vue"; // 折线图
export default {components: { lineChart },data() {return {chartData: {name: [],label:[],data:{value:[],value1:[],// ..........}},echartsName: "", // 自定义名称echartsUnit: "", // 单位};},mounted() {// 调用接口this.getFaceData();},methods: {getFaceData() {// 一条线// 此处应该调用接口// 暂时使用假数据this.chartData.name = ['温度']this.echartsUnit = 'kg'  // 单位this.chartData.label = ["2023-11-29 16:00:37","2023-11-29 18:11:36","2023-11-29 19:04:15","2023-11-29 19:21:09","2023-11-29 19:35:39","2023-11-29 19:49:32","2023-11-30 15:38:58"]this.chartData.data.value = [24,13,36,11,18,28,8]// 多条线// this.chartData.name = ['温度','湿度']// this.chartData.data.value1 = [11,18,13,25,9,22,10]},},
};
</script>
<style lang="scss">
.box-card {width: 800px;height: 400px;box-shadow: 0 2px 12px 0 rgba(0, 0, 0, 0.1);padding: 20px;margin: 20px;
}
</style>
10. 配置 element-resize-detector 公共方法
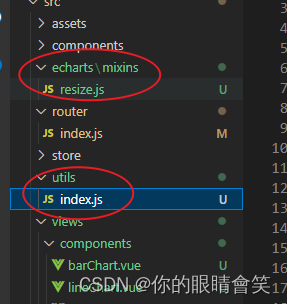
- 在echarts 文件夹下面新建 mixins 文件夹 然后 新建 resize.js
- resize.js 代码(可复制直接用)
// resize.js
import elementResizeDetectorMaker from "element-resize-detector";
import { debounce } from '@/utils/index'
export default {data() {return {$_sidebarElm: null,$_resizeHandler: null};},mounted() {var erd = elementResizeDetectorMaker();setTimeout(() => {if (this.chart) {erd.listenTo(this.chart._dom, ele => {debounce(() => {if(typeof this.getDomSizeFn === "function"){this.getDomSizeFn(ele);}if (this.chart && this.chart.resize) {this.chart.resize();}}, 100)();});}});this.$_resizeHandler = debounce(() => {if (this.chart && this.chart.resize) {this.chart.resize();}}, 100);this.$_initResizeEvent();this.$_initSidebarResizeEvent();},beforeDestroy() {this.$_destroyResizeEvent();this.$_destroySidebarResizeEvent();},// to fixed bug when cached by keep-alive// https://github.com/PanJiaChen/vue-element-admin/issues/2116activated() {this.$_initResizeEvent();this.$_initSidebarResizeEvent();},deactivated() {this.$_destroyResizeEvent();this.$_destroySidebarResizeEvent();},methods: {// use $_ for mixins properties// https://vuejs.org/v2/style-guide/index.html#Private-property-names-essential$_initResizeEvent() {window.addEventListener("resize", this.$_resizeHandler);},$_destroyResizeEvent() {window.removeEventListener("resize", this.$_resizeHandler);},$_sidebarResizeHandler(e) {if (e.propertyName === "width") {this.$_resizeHandler();}},$_initSidebarResizeEvent() {this.$_sidebarElm = document.getElementsByClassName("sidebar-container")[0];this.$_sidebarElm &&this.$_sidebarElm.addEventListener("transitionend",this.$_sidebarResizeHandler);},$_destroySidebarResizeEvent() {this.$_sidebarElm &&this.$_sidebarElm.removeEventListener("transitionend",this.$_sidebarResizeHandler);}}
};- 在 utils 新建 index.js (可复制直接用)
// index.js/*** @param {Function} func* @param {number} wait* @param {boolean} immediate* @return {*}*/
export function debounce (func, wait, immediate) {let timeout, args, context, timestamp, resultconst later = function () {// 据上一次触发时间间隔const last = +new Date() - timestamp// 上次被包装函数被调用时间间隔 last 小于设定时间间隔 waitif (last < wait && last > 0) {timeout = setTimeout(later, wait - last)} else {timeout = null// 如果设定为immediate===true,因为开始边界已经调用过了此处无需调用if (!immediate) {result = func.apply(context, args)if (!timeout) context = args = null}}}return function (...args) {context = thistimestamp = +new Date()const callNow = immediate && !timeout// 如果延时不存在,重新设定延时if (!timeout) timeout = setTimeout(later, wait)if (callNow) {result = func.apply(context, args)context = args = null}return result}}
- 以上为全部代码,请根据自身需求进行修改配置,完!