本文为转载
原文链接:
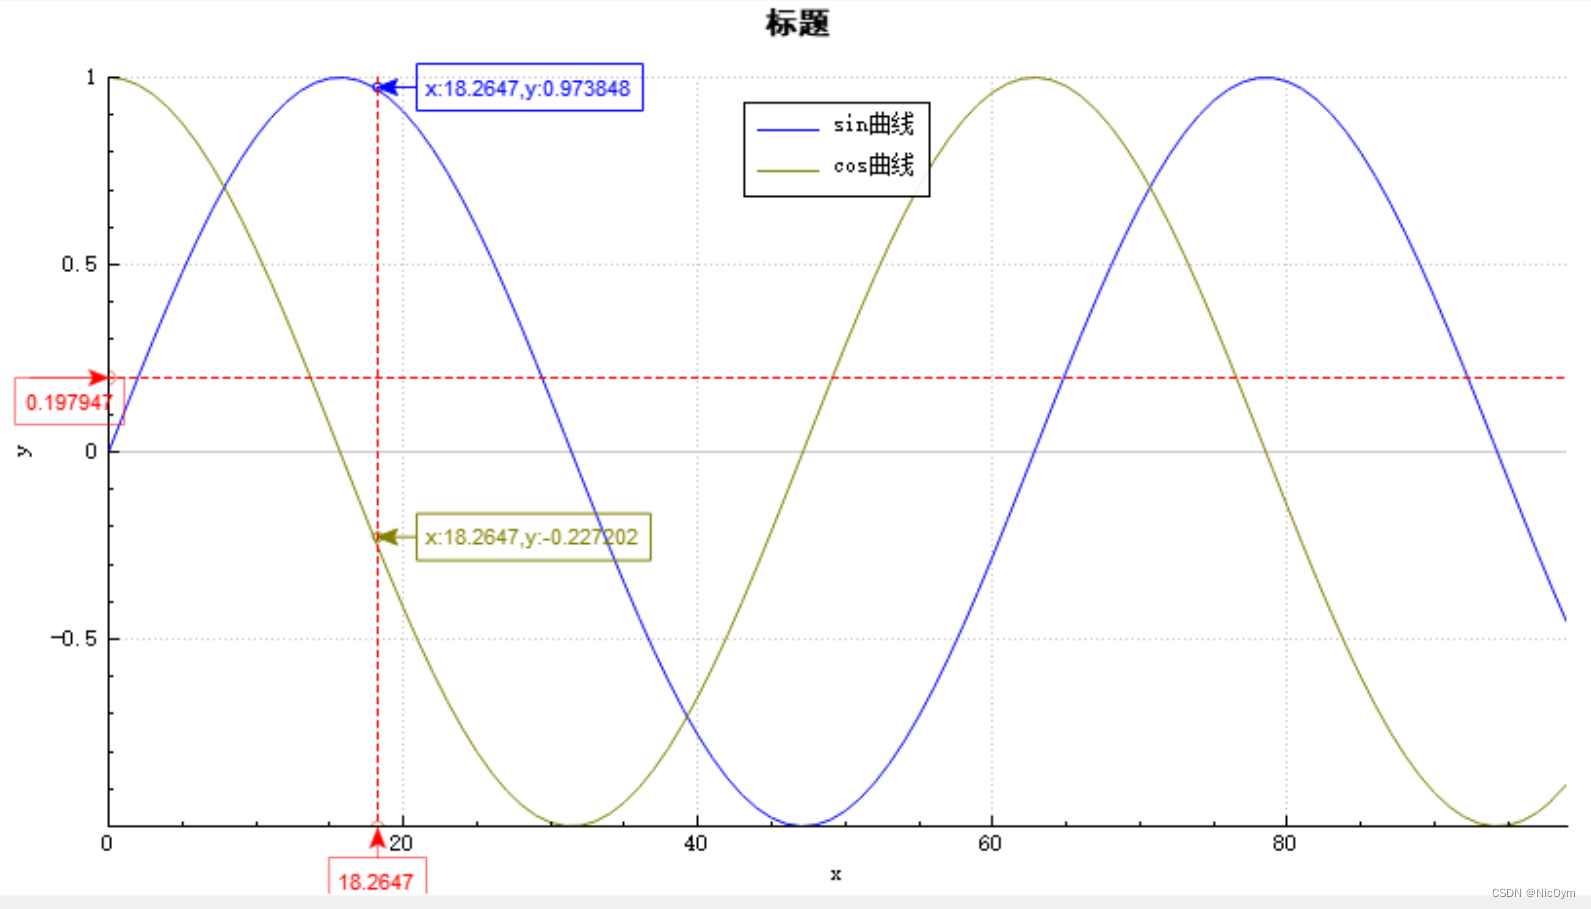
采用Qt快速绘制多条曲线(折线),跟随鼠标动态显示线上点的值(基于Qt的开源绘图控件QCustomPlot进行二次开发)
内容如下
QCustomPlot是一个开源的基于Qt的第三方绘图库,能够绘制漂亮的2D图形。
QCustomPlot的官方网址:Qt Plotting Widget QCustomPlot - Introduction
从官网下载QCustomPlot的源文件,包括qcustomplot.h和qcustomplot.cpp。
本程序的源码下载地址: https://github.com/xiongxw/XCustomPlot.git
1 自定义鼠标显示跟随类XxwTracer和XxwTraceLine:
XxwTracer用于在图表中显示鼠标所在位置的x,y值
XxwTraceLine用于在图中显示水平或垂直的虚线
头文件XxwTracer.h
#ifndef MYTRACER_H
#define MYTRACER_H#include <QObject>
#include "qcustomplot.h"///
/// \brief The XxwTracer class:在图表中显示鼠标所在位置的x,y值的追踪显示器
///
class XxwTracer : public QObject
{
Q_OBJECTpublic:
enum TracerType
{XAxisTracer,//依附在x轴上显示x值YAxisTracer,//依附在y轴上显示y值DataTracer//在图中显示x,y值
};explicit XxwTracer(QCustomPlot *_plot, TracerType _type, QObject *parent = Q_NULLPTR);~XxwTracer();
void setPen(const QPen &pen);
void setBrush(const QBrush &brush);
void setText(const QString &text);
void setLabelPen(const QPen &pen);
void updatePosition(double xValue, double yValue);void setVisible(bool m_visible);protected:bool m_visible;//是否可见TracerType m_type;//类型QCustomPlot *m_plot;//图表QCPItemTracer *m_tracer;//跟踪的点QCPItemText *m_label;//显示的数值QCPItemLine *m_arrow;//箭头
};///
/// \brief The XxwCrossLine class:用于显示鼠标移动过程中的鼠标位置的直线
///
class XxwTraceLine : public QObject
{
public:enum LineType{VerticalLine,//垂直线HorizonLine, //水平线Both//同时显示水平和垂直线};explicit XxwTraceLine(QCustomPlot *_plot, LineType _type = VerticalLine, QObject *parent = Q_NULLPTR);~XxwTraceLine();void initLine();void updatePosition(double xValue, double yValue);void setVisible(bool vis){if(m_lineV)m_lineV->setVisible(vis);if(m_lineH)m_lineH->setVisible(vis);}protected:bool m_visible;//是否可见LineType m_type;//类型QCustomPlot *m_plot;//图表QCPItemStraightLine *m_lineV; //垂直线QCPItemStraightLine *m_lineH; //水平线
};#endif // MYTRACER_H
源文件MyTracer.cpp
#include "MyTracer.h"XxwTracer::XxwTracer(QCustomPlot *_plot, TracerType _type, QObject *parent): QObject(parent),m_plot(_plot),m_type(_type)
{m_visible = true;m_tracer = Q_NULLPTR;// 跟踪的点m_label = Q_NULLPTR;// 显示的数值m_arrow = Q_NULLPTR;// 箭头if (m_plot){QColor clrDefault(Qt::red);QBrush brushDefault(Qt::NoBrush);QPen penDefault(clrDefault);//        penDefault.setBrush(brushDefault);penDefault.setWidthF(0.5);m_tracer = new QCPItemTracer(m_plot);m_tracer->setStyle(QCPItemTracer::tsCircle);m_tracer->setPen(penDefault);m_tracer->setBrush(brushDefault);m_label = new QCPItemText(m_plot);m_label->setLayer("overlay");m_label->setClipToAxisRect(false);m_label->setPadding(QMargins(5, 5, 5, 5));m_label->setBrush(brushDefault);m_label->setPen(penDefault);m_label->position->setParentAnchor(m_tracer->position);
//        m_label->setFont(QFont("宋体", 8));m_label->setFont(QFont("Arial", 8));m_label->setColor(clrDefault);m_label->setText("");m_arrow = new QCPItemLine(m_plot);QPen  arrowPen(clrDefault, 1);m_arrow->setPen(penDefault);m_arrow->setLayer("overlay");m_arrow->setClipToAxisRect(false);m_arrow->setHead(QCPLineEnding::esSpikeArrow);//设置头部为箭头形状switch (m_type){case XAxisTracer:{m_tracer->position->setTypeX(QCPItemPosition::ptPlotCoords);m_tracer->position->setTypeY(QCPItemPosition::ptAxisRectRatio);m_tracer->setSize(7);m_label->setPositionAlignment(Qt::AlignTop | Qt::AlignHCenter);m_arrow->end->setParentAnchor(m_tracer->position);m_arrow->start->setParentAnchor(m_arrow->end);m_arrow->start->setCoords(0, 20);//偏移量break;}case YAxisTracer:{m_tracer->position->setTypeX(QCPItemPosition::ptAxisRectRatio);m_tracer->position->setTypeY(QCPItemPosition::ptPlotCoords);m_tracer->setSize(7);m_label->setPositionAlignment(Qt::AlignRight | Qt::AlignHCenter);m_arrow->end->setParentAnchor(m_tracer->position);m_arrow->start->setParentAnchor(m_label->position);m_arrow->start->setCoords(-20, 0);//偏移量break;}case DataTracer:{m_tracer->position->setTypeX(QCPItemPosition::ptPlotCoords);m_tracer->position->setTypeY(QCPItemPosition::ptPlotCoords);m_tracer->setSize(5);m_label->setPositionAlignment(Qt::AlignLeft | Qt::AlignVCenter);m_arrow->end->setParentAnchor(m_tracer->position);m_arrow->start->setParentAnchor(m_arrow->end);m_arrow->start->setCoords(20, 0);break;}default:break;}setVisible(false);}
}XxwTracer::~XxwTracer()
{if(m_plot){if (m_tracer)m_plot->removeItem(m_tracer);if (m_label)m_plot->removeItem(m_label);if (m_arrow)m_plot->removeItem(m_arrow);}
}void XxwTracer::setPen(const QPen &pen)
{if(m_tracer)m_tracer->setPen(pen);if(m_arrow)m_arrow->setPen(pen);
}void XxwTracer::setBrush(const QBrush &brush)
{if(m_tracer)m_tracer->setBrush(brush);
}void XxwTracer::setLabelPen(const QPen &pen)
{if(m_label){m_label->setPen(pen);m_label->setBrush(Qt::NoBrush);m_label->setColor(pen.color());}
}void XxwTracer::setText(const QString &text)
{if(m_label)m_label->setText(text);
}void XxwTracer::setVisible(bool vis)
{m_visible = vis;if(m_tracer)m_tracer->setVisible(m_visible);if(m_label)m_label->setVisible(m_visible);if(m_arrow)m_arrow->setVisible(m_visible);
}void XxwTracer::updatePosition(double xValue, double yValue)
{if (!m_visible){setVisible(true);m_visible = true;}if (yValue > m_plot->yAxis->range().upper)yValue = m_plot->yAxis->range().upper;switch (m_type){case XAxisTracer:{m_tracer->position->setCoords(xValue, 1);m_label->position->setCoords(0, 15);m_arrow->start->setCoords(0, 15);m_arrow->end->setCoords(0, 0);setText(QString::number(xValue));break;}case YAxisTracer:{m_tracer->position->setCoords(0, yValue);m_label->position->setCoords(-20, 0);
//        m_arrow->start->setCoords(20, 0);
//        m_arrow->end->setCoords(0, 0);setText(QString::number(yValue));break;}case DataTracer:{m_tracer->position->setCoords(xValue, yValue);m_label->position->setCoords(20, 0);setText(QString("x:%1,y:%2").arg(xValue).arg(yValue));break;}default:break;}
}XxwTraceLine::XxwTraceLine(QCustomPlot *_plot, LineType _type, QObject *parent): QObject(parent),m_type(_type),m_plot(_plot)
{m_lineV = Q_NULLPTR;m_lineH = Q_NULLPTR;initLine();
}XxwTraceLine::~XxwTraceLine()
{if(m_plot){if (m_lineV)m_plot->removeItem(m_lineV);if (m_lineH)m_plot->removeItem(m_lineH);}
}void XxwTraceLine::initLine()
{if(m_plot){QPen linesPen(Qt::red, 1, Qt::DashLine);if(VerticalLine == m_type || Both == m_type){m_lineV = new QCPItemStraightLine(m_plot);//垂直线m_lineV->setLayer("overlay");m_lineV->setPen(linesPen);m_lineV->setClipToAxisRect(true);m_lineV->point1->setCoords(0, 0);m_lineV->point2->setCoords(0, 0);}if(HorizonLine == m_type || Both == m_type){m_lineH = new QCPItemStraightLine(m_plot);//水平线m_lineH->setLayer("overlay");m_lineH->setPen(linesPen);m_lineH->setClipToAxisRect(true);m_lineH->point1->setCoords(0, 0);m_lineH->point2->setCoords(0, 0);}}
}void XxwTraceLine::updatePosition(double xValue, double yValue)
{if(VerticalLine == m_type || Both == m_type){if(m_lineV){m_lineV->point1->setCoords(xValue, m_plot->yAxis->range().lower);m_lineV->point2->setCoords(xValue, m_plot->yAxis->range().upper);}}if(HorizonLine == m_type || Both == m_type){if(m_lineH){m_lineH->point1->setCoords(m_plot->xAxis->range().lower, yValue);m_lineH->point2->setCoords(m_plot->xAxis->range().upper, yValue);}}
}
2 自定义的图表类XCustomPlot
XCustomPlot是基于QCustomPlot二次开发的图表类,在鼠标移动过程中动态显示曲线上点的值。
头文件XCustomPlot.h
#ifndef XCUSTOMPLOT_H
#define XCUSTOMPLOT_H#include "XxwTracer.h"
#include "qcustomplot.h"
#include <QObject>
#include <QList>class XxwCustomPlot:public QCustomPlot
{Q_OBJECTpublic:XxwCustomPlot(QWidget *parent = 0);protected:virtual void mouseMoveEvent(QMouseEvent *event);public:////// \brief 设置是否显示鼠标追踪器/// \param show:是否显示///void showTracer(bool show){m_isShowTracer = show;if(m_xTracer)m_xTracer->setVisible(m_isShowTracer);foreach (XxwTracer *tracer, m_dataTracers){if(tracer)tracer->setVisible(m_isShowTracer);}if(m_lineTracer)m_lineTracer->setVisible(m_isShowTracer);}////// \brief 是否显示鼠标追踪器/// \return///bool isShowTracer(){return m_isShowTracer;};private:bool m_isShowTracer;//是否显示追踪器(鼠标在图中移动,显示对应的值)XxwTracer *m_xTracer;//x轴XxwTracer *m_yTracer;//y轴QList<XxwTracer *> m_dataTracers;//XxwTraceLine  *m_lineTracer;//直线
};#endif // XCUSTOMPLOT_H
源文件XCustomPlot.h
#include "XxwCustomPlot.h"XxwCustomPlot::XxwCustomPlot(QWidget *parent):QCustomPlot(parent),m_isShowTracer(false),m_xTracer(Q_NULLPTR),m_yTracer(Q_NULLPTR),m_dataTracers(QList<XxwTracer *>()),m_lineTracer(Q_NULLPTR)
{
}void XxwCustomPlot::mouseMoveEvent(QMouseEvent *event)
{QCustomPlot::mouseMoveEvent(event);if(m_isShowTracer){//当前鼠标位置(像素坐标)int x_pos = event->pos().x();int y_pos = event->pos().y();//像素坐标转成实际的x,y轴的坐标float x_val = this->xAxis->pixelToCoord(x_pos);float y_val = this->yAxis->pixelToCoord(y_pos);if(Q_NULLPTR == m_xTracer)m_xTracer = new XxwTracer(this, XxwTracer::XAxisTracer);//x轴m_xTracer->updatePosition(x_val, y_val);if(Q_NULLPTR == m_yTracer)m_yTracer = new XxwTracer(this, XxwTracer::YAxisTracer);//y轴m_yTracer->updatePosition(x_val, y_val);int nTracerCount = m_dataTracers.count();int nGraphCount = graphCount();if(nTracerCount < nGraphCount){for(int i = nTracerCount; i < nGraphCount; ++i){XxwTracer *tracer = new XxwTracer(this, XxwTracer::DataTracer);m_dataTracers.append(tracer);}}else if(nTracerCount > nGraphCount){for(int i = nGraphCount; i < nTracerCount; ++i){XxwTracer *tracer = m_dataTracers[i];if(tracer){tracer->setVisible(false);}}}for (int i = 0; i < nGraphCount; ++i){XxwTracer *tracer = m_dataTracers[i];if(!tracer)tracer = new XxwTracer(this, XxwTracer::DataTracer);tracer->setVisible(true);tracer->setPen(this->graph(i)->pen());tracer->setBrush(Qt::NoBrush);tracer->setLabelPen(this->graph(i)->pen());auto iter = this->graph(i)->data()->findBegin(x_val);double value = iter->mainValue();
//            double value = this->graph(i)->data()->findBegin(x_val)->value;tracer->updatePosition(x_val, value);}if(Q_NULLPTR == m_lineTracer)m_lineTracer = new XxwTraceLine(this,XxwTraceLine::Both);//直线m_lineTracer->updatePosition(x_val, y_val);this->replot();//曲线重绘}
}
3 使用自定义图表类XCustomPlot
在需要绘图的地方使用,代码如下:
  m_customPlot = new XxwCustomPlot();m_customPlot->showTracer(true);// add title layout element:m_customPlot->plotLayout()->insertRow(0);m_customPlot->plotLayout()->addElement(0, 0, new QCPTextElement(m_customPlot, "标题", QFont("黑体", 12, QFont::Bold)));m_customPlot->legend->setVisible(true);QFont legendFont = font();  // start out with MainWindow's font..legendFont.setPointSize(9); // and make a bit smaller for legendm_customPlot->legend->setFont(legendFont);m_customPlot->legend->setBrush(QBrush(QColor(255,255,255,230)));// by default, the legend is in the inset layout of the main axis rect. So this is how we access it to change legend placement:m_customPlot->axisRect()->insetLayout()->setInsetAlignment(0, Qt::AlignTop|Qt::AlignCenter);// make left and bottom axes always transfer their ranges to right and top axes:connect(m_customPlot->xAxis, SIGNAL(rangeChanged(QCPRange)), m_customPlot->xAxis2, SLOT(setRange(QCPRange)));connect(m_customPlot->yAxis, SIGNAL(rangeChanged(QCPRange)), m_customPlot->yAxis2, SLOT(setRange(QCPRange)));// Allow user to drag axis ranges with mouse, zoom with mouse wheel and select graphs by clicking:m_customPlot->setInteractions(QCP::iRangeDrag | QCP::iRangeZoom | QCP::iSelectPlottables);// generate some data:int nCount = 100;QVector<double> x(nCount), y0(nCount), y1(nCount); // initialize with entries 0..100for (int i = 0; i < nCount; ++i){x[i] = i; // x goes from -1 to 1y0[i] = qSin(i * 10.0f / nCount); //siny1[i] = qCos(i * 10.0f / nCount); //cos}// create graph and assign data to it:QPen pen;int i = 1;QCPGraph *pGraph = m_customPlot->addGraph();//        m_customPlot->graph(0)->setData(x, y0);pGraph->setName("sin曲线");pGraph->setData(x,y0);pGraph->setPen(QPen(Qt::blue));pGraph = m_customPlot->addGraph();//        m_customPlot->graph(0)->setData(x, y0);pGraph->setName("cos曲线");pGraph->setData(x,y1);pGraph->setPen(QPen(Qt::darkYellow));// give the axes some labels:m_customPlot->xAxis->setLabel("x");m_customPlot->yAxis->setLabel("y");// set axes ranges, so we see all data:
//    m_customPlot->xAxis->setRange(-1, 1);
//    m_customPlot->yAxis->setRange(0, 1);m_customPlot->rescaleAxes(true);m_customPlot->replot();