一、现象
order by 排序加了limit后更慢了?
test=# explain analyze  select userid from dba_users where  username like '%aaaaaaaaaaaaaaaaaa%' order by userid ;QUERY PLAN
----------------------------------------------------------------------------------------------------------------------------------------------Sort  (cost=2327.46..2328.96 rows=600 width=4) (actual time=109.316..109.318 rows=0 loops=1)Sort Key: useridSort Method: quicksort  Memory: 25kB->  Bitmap Heap Scan on dba_users  (cost=61.47..2299.78 rows=600 width=4) (actual time=109.311..109.312 rows=0 loops=1)Recheck Cond: ((username)::text ~~ '%aaaaaaaaaaaaaaaaaa%'::text)Rows Removed by Index Recheck: 40904Heap Blocks: exact=31502->  Bitmap Index Scan on dba_users_username_idx  (cost=0.00..61.32 rows=600 width=0) (actual time=22.520..22.520 rows=40904 loops=1)Index Cond: ((username)::text ~~ '%aaaaaaaaaaaaaaaaaa%'::text)Planning Time: 0.149 msExecution Time: 109.350 ms
(11 rows)test=#
test=# explain analyze  select userid from dba_users where  username like '%aaaaaaaaaaaaaaaaaa%'    order by userid   limit 1 ;                                                                                                         QUERY PLAN
---------------------------------------------------------------------------------------------------------------------------------------------Limit  (cost=0.43..408.59 rows=1 width=4) (actual time=3558.960..3558.961 rows=0 loops=1)->  Index Scan using dba_users_pkey on dba_users  (cost=0.43..244895.74 rows=600 width=4) (actual time=3558.958..3558.959 rows=0 loops=1)Filter: ((username)::text ~~ '%aaaaaaaaaaaaaaaaaa%'::text)Rows Removed by Filter: 6000000Planning Time: 0.171 msExecution Time: 3558.983 ms
(6 rows)test=#
dba_users有600w条数据,username符合检索条件的0行, order by userid limit 1 耗时3558.983 ms,order by userid 耗时109.350 ms。
limit 1是匹配到第一条数据后就返回,这里却更慢了? 看起来不符合预期。
表结构如下:
test=# \d+ dba_usersTable "public.dba_users"Column  |         Type          | Collation | Nullable | Default | Storage  | Compression | Stats target | Description
----------+-----------------------+-----------+----------+---------+----------+-------------+--------------+-------------userid   | integer               |           | not null |         | plain    |             |              | username | character varying(64) |           |          |         | extended |             |              | password | character varying(64) |           |          |         | extended |             |              |
Indexes:"dba_users_pkey" PRIMARY KEY, btree (userid)"dba_users_password_idx" btree (password)"dba_users_username_idx" gin (username gin_trgm_ops)
Access method: heaptest=#通常我们可以给order by字段做运算或者类型转换来矫正优化器走实际更优的执行计划。
test=# explain analyze select userid from dba_users where  username like '%aaaaaaaaaaaaaaaaaa%' order by userid + 0 limit 1;QUERY PLAN
----------------------------------------------------------------------------------------------------------------------------------------------------Limit  (cost=2302.78..2304.28 rows=1 width=4) (actual time=109.117..109.119 rows=0 loops=1)->  Sort  (cost=2302.78..2304.28 rows=600 width=4) (actual time=109.116..109.117 rows=0 loops=1)Sort Key: ((userid + 0))Sort Method: quicksort  Memory: 25kB->  Bitmap Heap Scan on dba_users  (cost=61.47..2299.78 rows=600 width=4) (actual time=109.110..109.111 rows=0 loops=1)Recheck Cond: ((username)::text ~~ '%aaaaaaaaaaaaaaaaaa%'::text)Rows Removed by Index Recheck: 40904Heap Blocks: exact=31502->  Bitmap Index Scan on dba_users_username_idx  (cost=0.00..61.32 rows=600 width=0) (actual time=20.856..20.856 rows=40904 loops=1)Index Cond: ((username)::text ~~ '%aaaaaaaaaaaaaaaaaa%'::text)Planning Time: 0.156 msExecution Time: 109.149 ms
(12 rows)test=#
或者order by字段和where字段建个组合索引? 多列统计信息?这些都是一些规避的方法,优化器自身为什么选择了不优的计划?
二、分析
这个问题一直被诟病,不少文章分析过很多场景,统计信息不准?索引损坏?数据分布问题?我们一起深入探索其中的奥秘。
PostgreSQL的优化器是自底向上生成执行计划,当查询小于12个表,使用的是动态规划算法,在每个计划节点执行各种可能的path和检索方法,然后计算出最小代价path作为最优解,也就是最终的执行计划。
DEBUG跟踪这个过程。
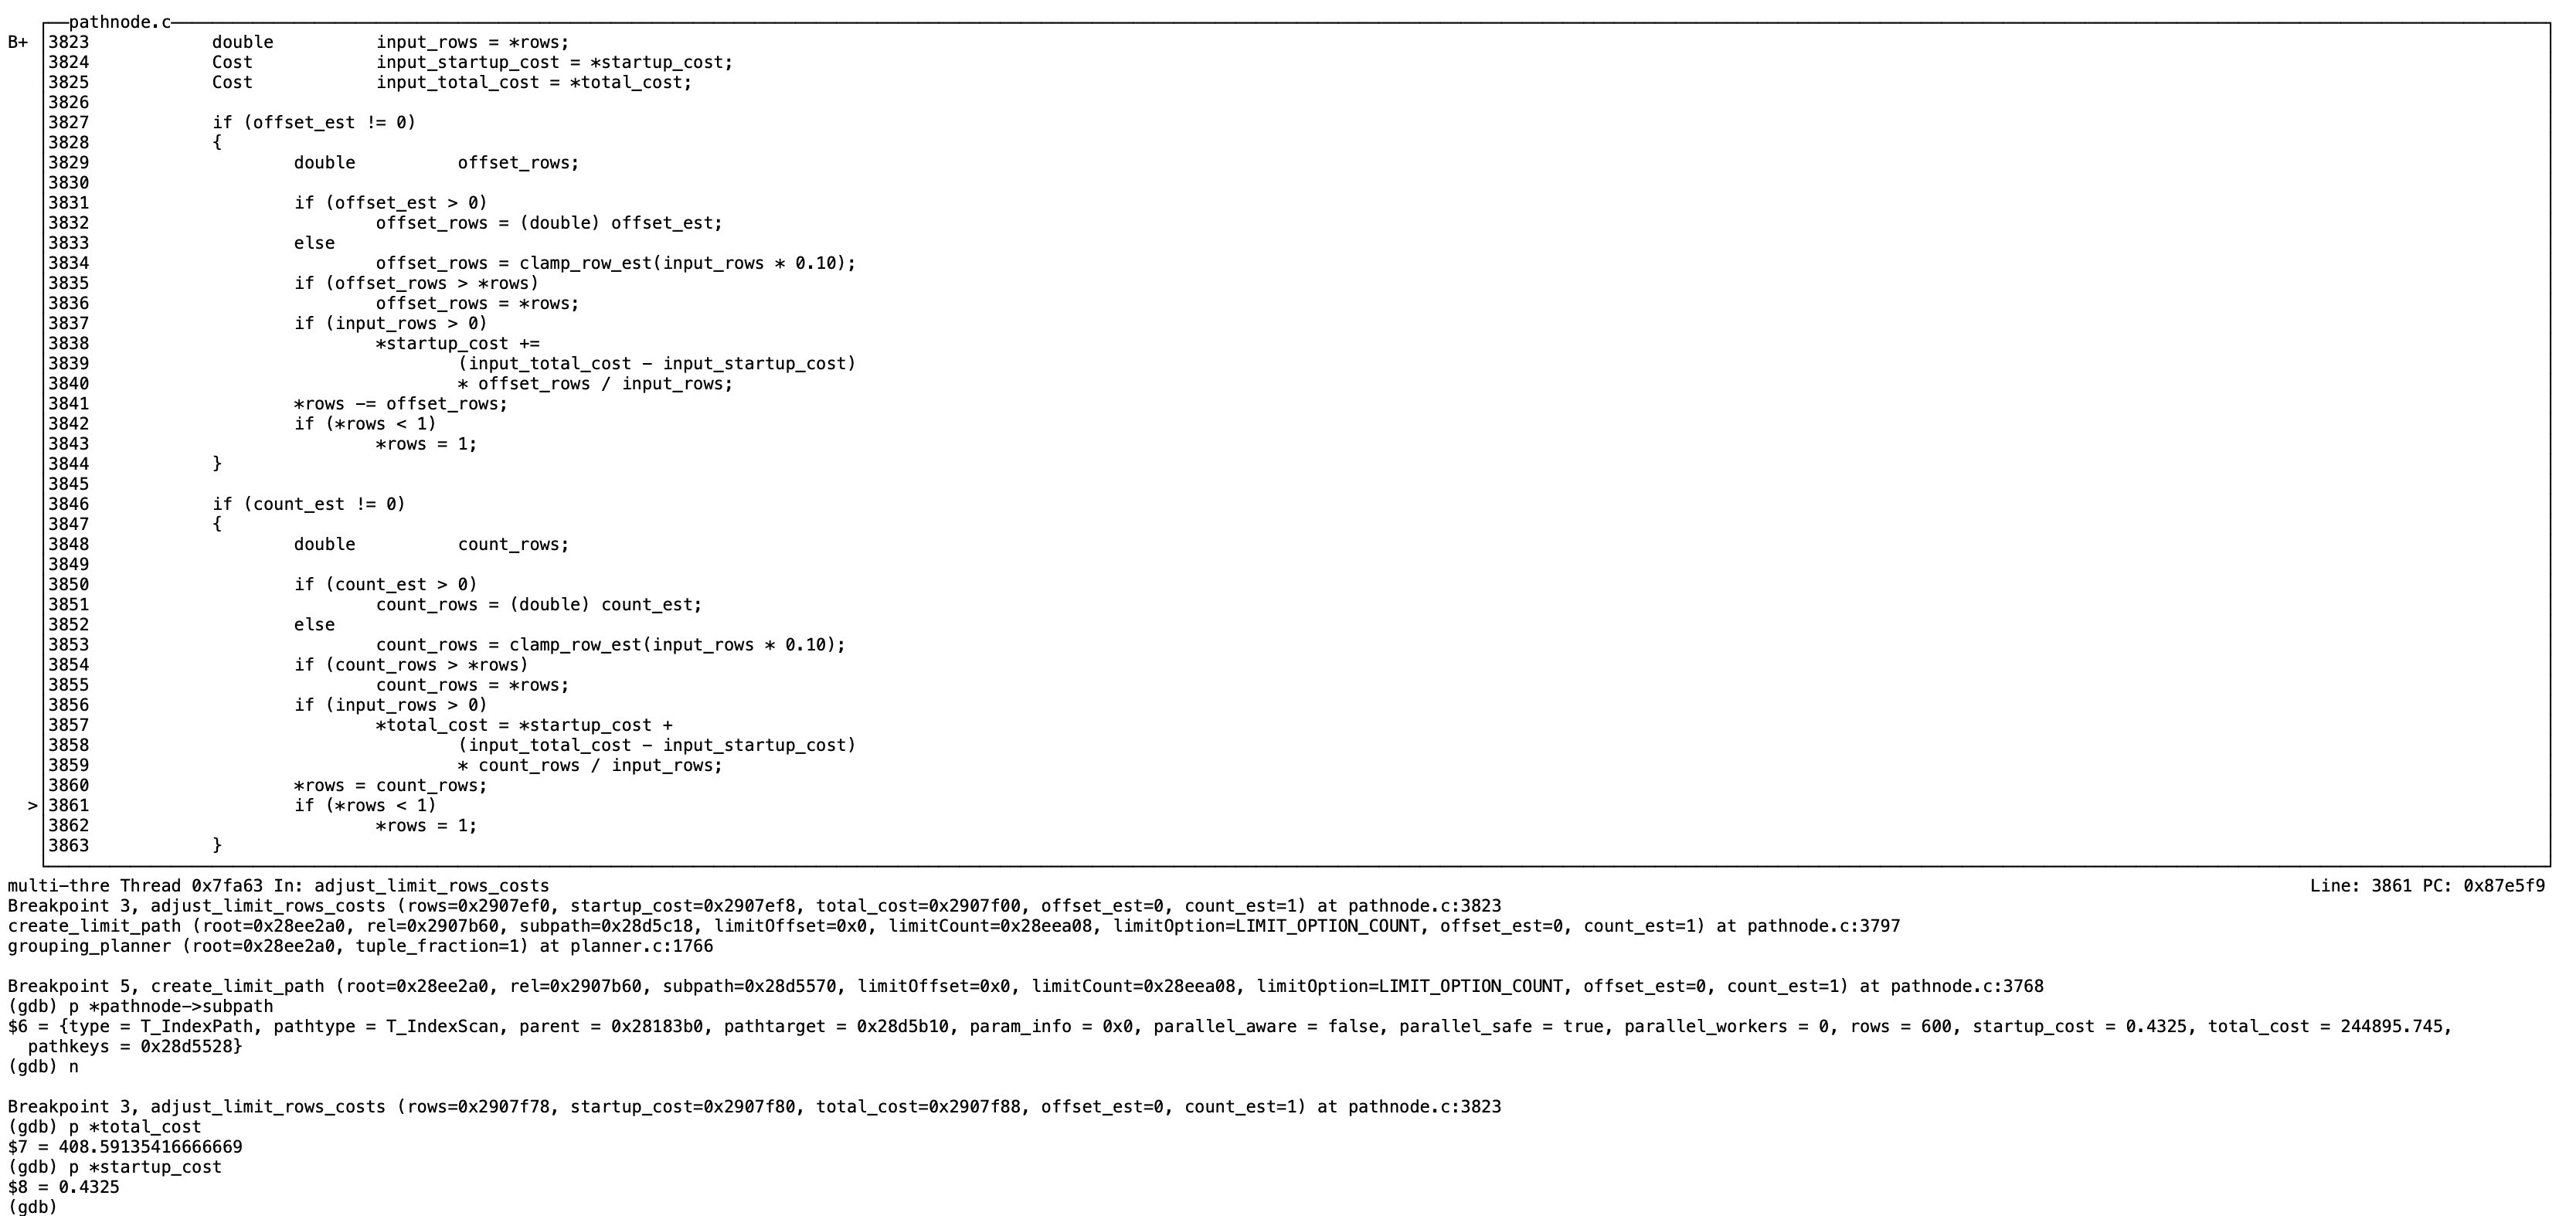
limit 的cost计算是在adjust_limit_rows_costs函数里进行的,根据上一节点subpath的startup_cost和total_cost计算出limit count后对应的cost
如下subpath是T_IndexPath, startup_cost=0.4325 total_cost=244895.745
limit 1对应的startup_cost=0.4325 total_cost= startup_cost + (input_total_cost - input_startup_cost) count_rows / input_rows;
= 0.4325 + (244895.745 - 0.4325 ) * 1/600
= 408.5913541666666667
这个对应的是order by userid limit 1执行计划的cost:Limit (cost=0.43…408.59 rows=1 width=4)
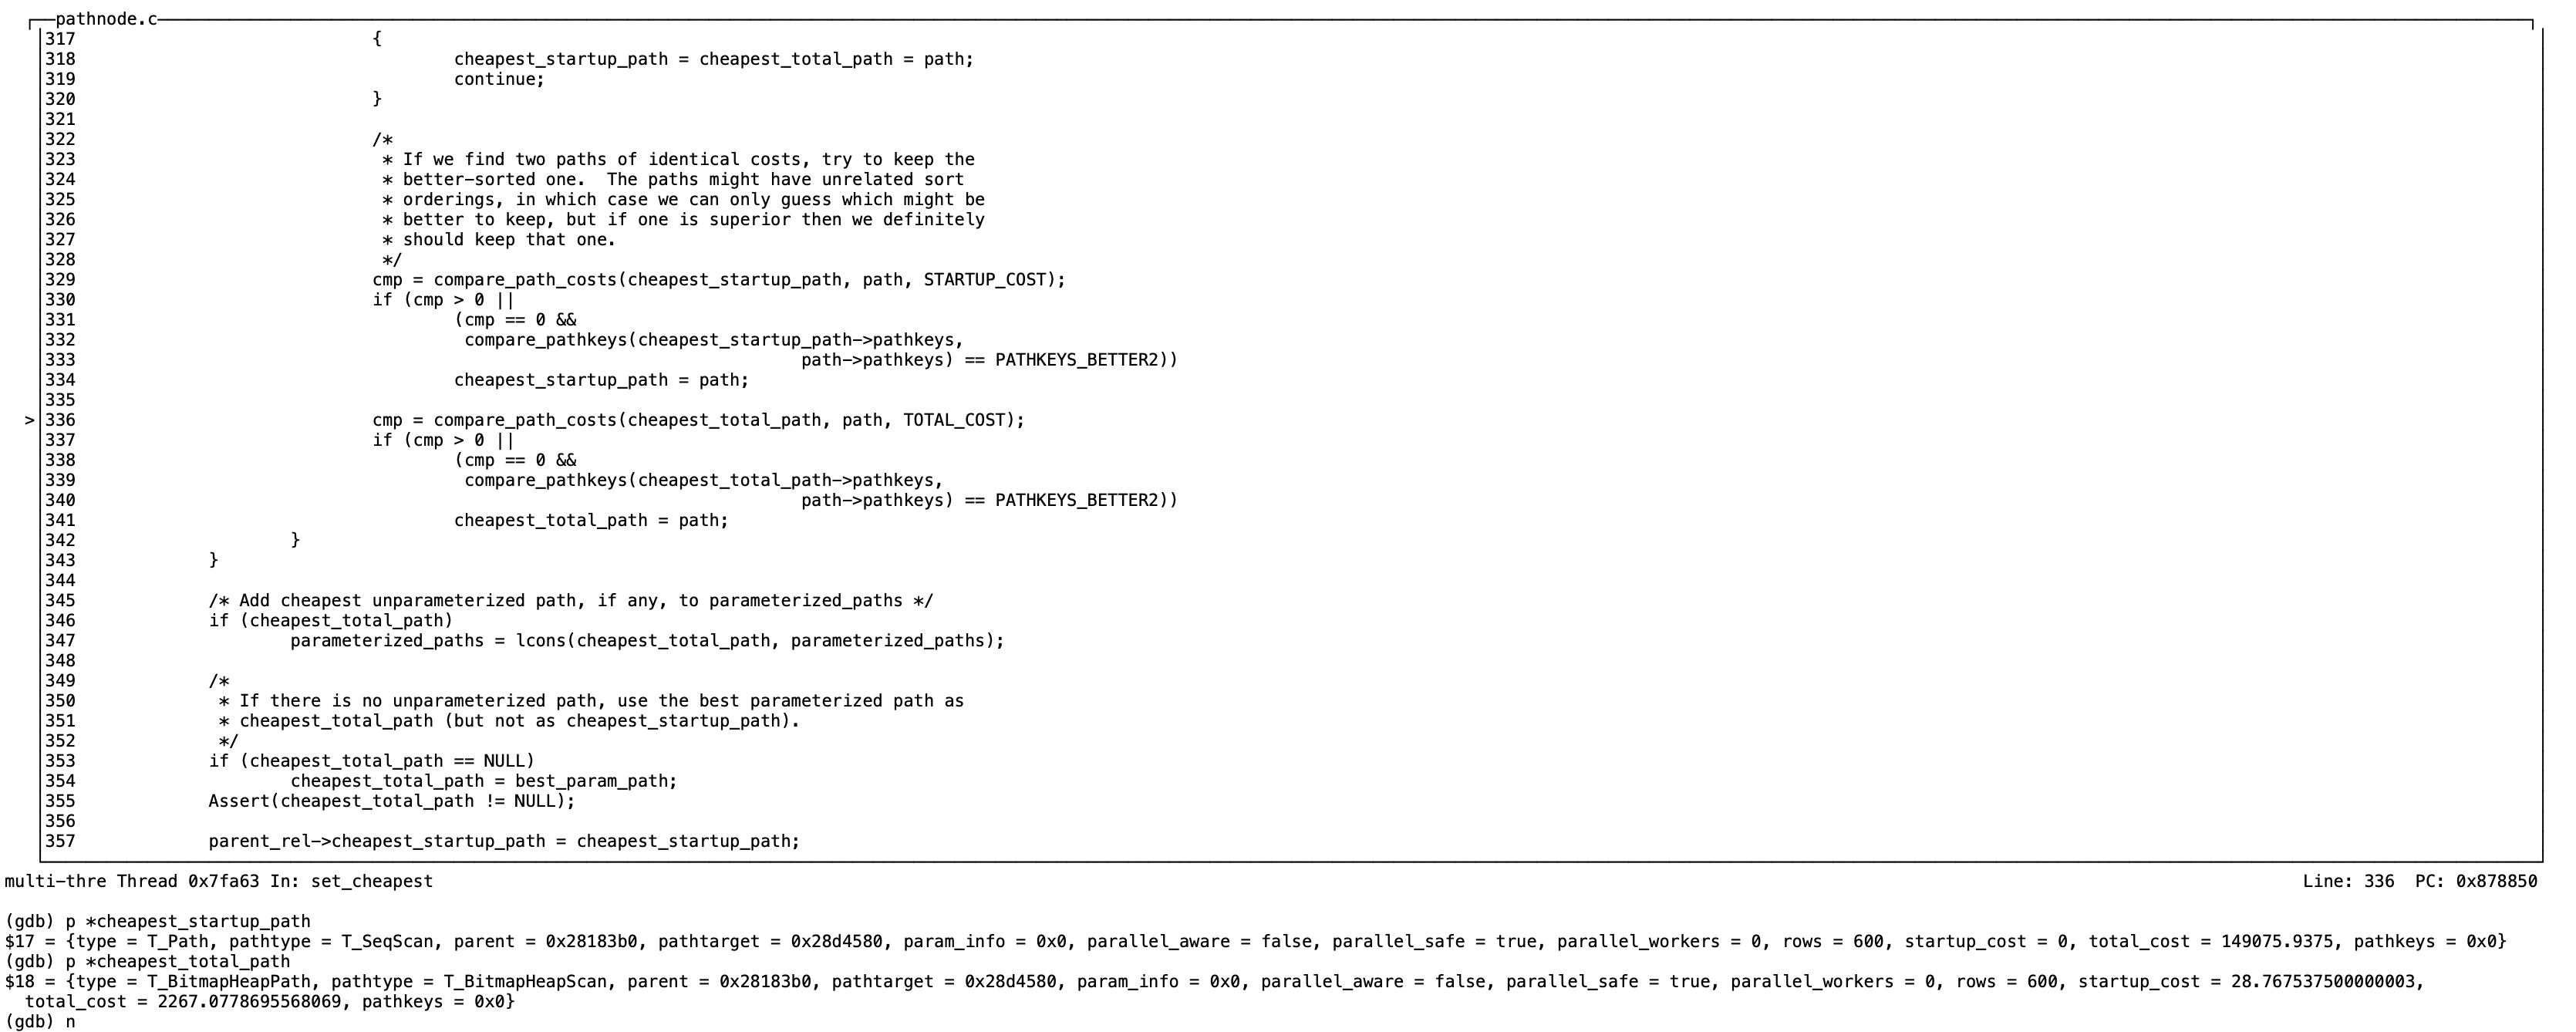
在set_cheapest里比较表扫描的最优方式,循环比较pathlist的每个节点的startup_cost和total_cost,
以下最优total_cost是T_BitmapHeapPath,最优startup_cost是T_seqScan
最终set_cheapest函数里一直角逐出Limit节点最优的startup_cost是0.4325,total_cost是408.59135416666669,这个对应到了order by userid Limit 1 这个plan的total_cost:Limit (cost=0.43…408.59 rows=1 width=4)
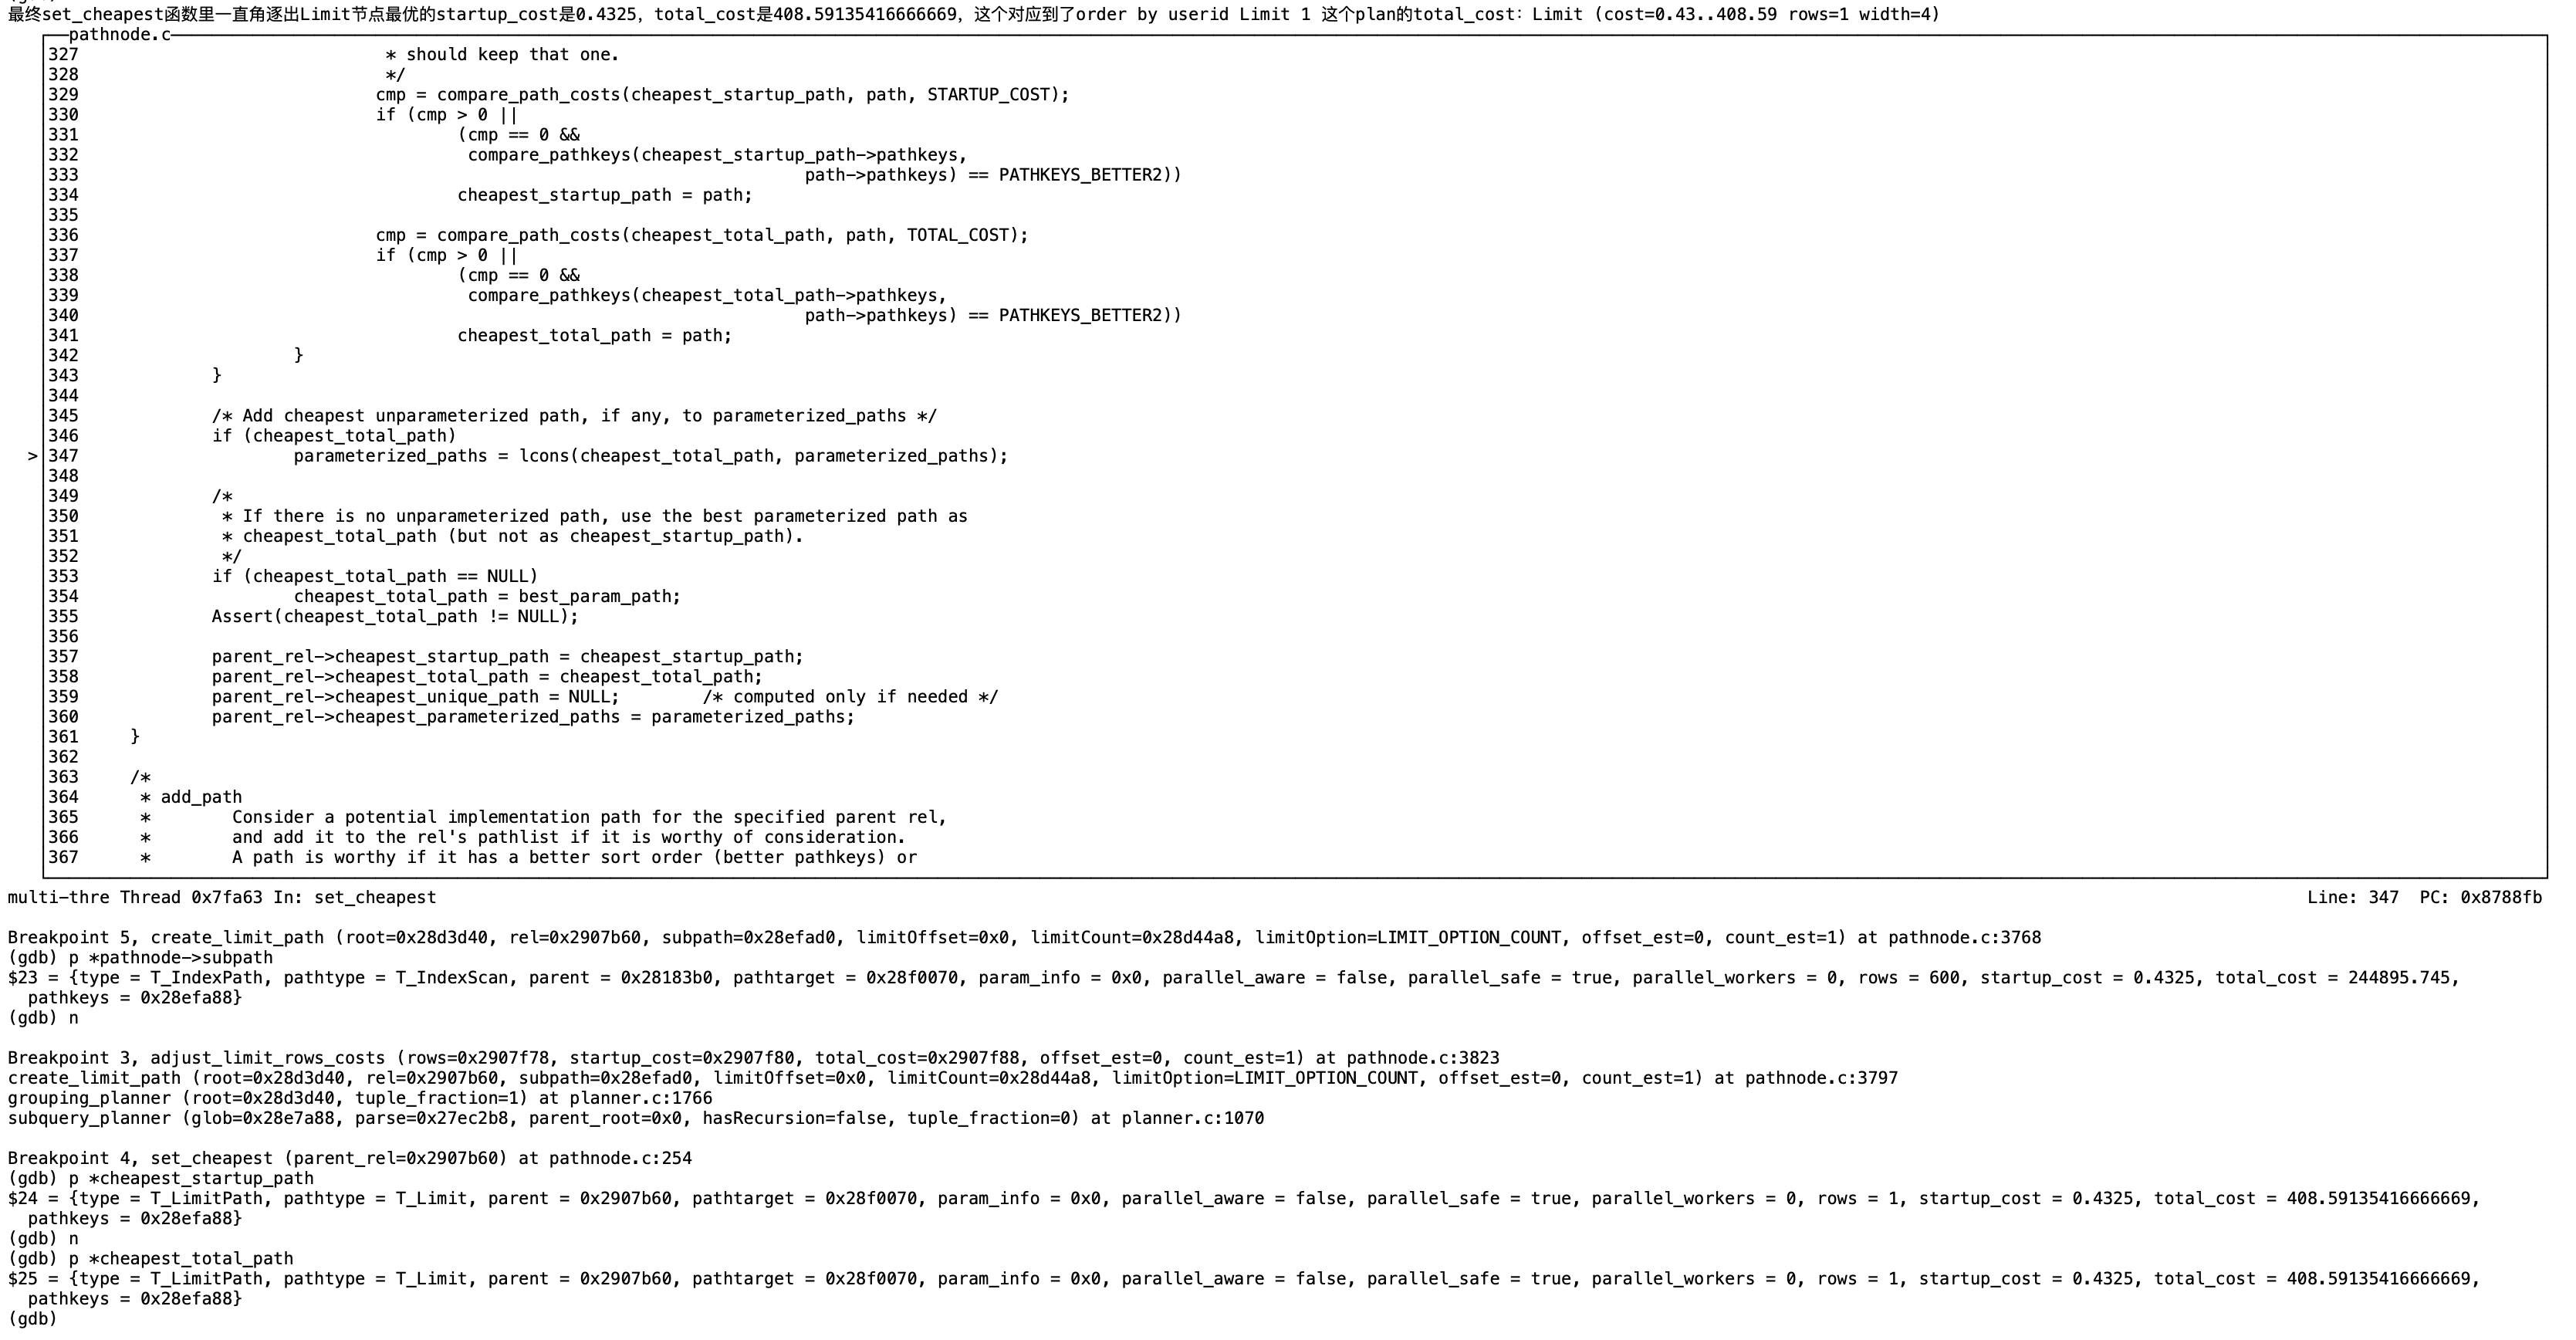
在get_cheapest_fractional_path函数里返回best_path 也就是以上total_cost=408.59135416666669的path,即order by userid Limit 1的plan。
并以此创建执行计划,最终执行器执行。
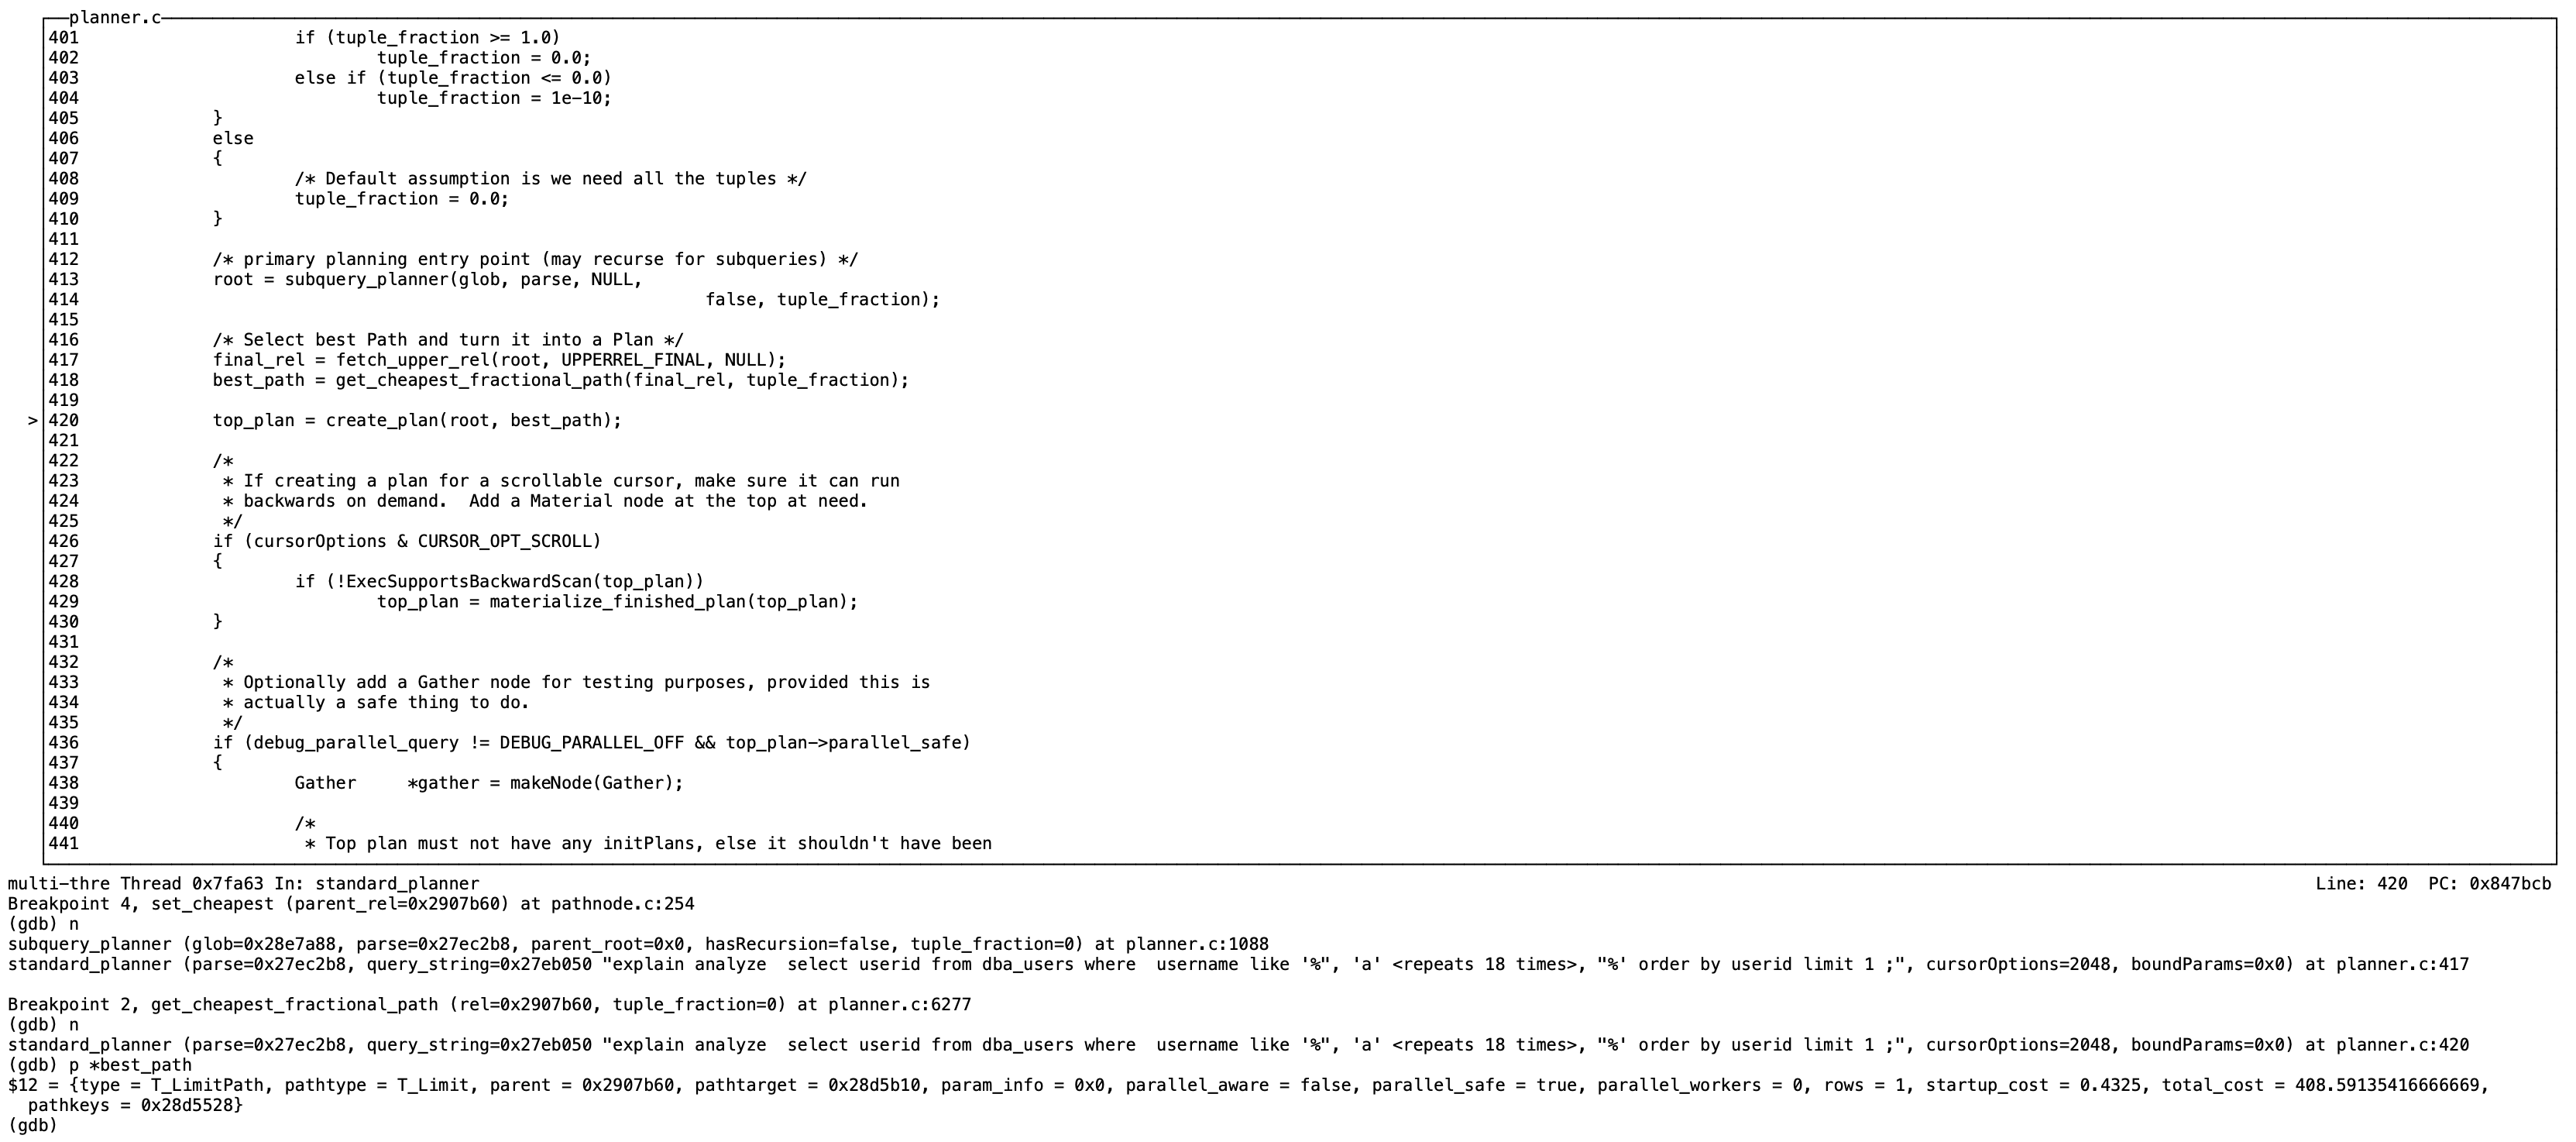
那么从整个过程来看,我们需要关注的是整个计划最终节点的startup_cost和total_cost,优化器会选择最优total_cost的path作为best_path。
代价预估order by userid limit 1时,total_cost为:408.59(实际执行的total_time为:3558.961 ms)
预估order by userid + 0 limit 1时,total_cost为:2304.28(实际执行的total_time为:109.119 ms)
显而易见优化器选择了total_cost更小的408.59所在的path作为执行计划。
很明显代价预估有问题,我们开始就跟踪了order by userid limit 1的cost计算,计算的数值本身没有问题。
是优化器的缺陷?再把执行计划拉出来遛遛。
test=# explain analyze  select userid from dba_users where  username like '%aaaaaaaaaaaaaaaaaa%'    order by userid   limit 1 ;                                                                                                         QUERY PLAN
---------------------------------------------------------------------------------------------------------------------------------------------Limit  (cost=0.43..408.59 rows=1 width=4) (actual time=3558.960..3558.961 rows=0 loops=1)->  Index Scan using dba_users_pkey on dba_users  (cost=0.43..244895.74 rows=600 width=4) (actual time=3558.958..3558.959 rows=0 loops=1)Filter: ((username)::text ~~ '%aaaaaaaaaaaaaaaaaa%'::text)Rows Removed by Filter: 6000000Planning Time: 0.171 msExecution Time: 3558.983 ms
(6 rows)test=#
cost我们之前已经计算过了,但是从actual time来看,代价预估偏差还是比较大的,
cost:Index Scan startup_cost=0.43 total_cost=244895.74 , limit startup_cost=0.43 total_cost=408.59
从预估来看因为没有offset 所以startup_cost都是0.43,根据公式计算的 limit 的total_cost=408.59,比244895.74小了很多。
actual: Index Scan startup_time=3558.958 total_time=3558.959,limit startup_time=3558.960 total_time=3558.961
从实际执行来看Index startup_time=3558.958 total_time=3558.959,索引扫描startup_time启动代价3558.958ms?
startup_time可以理解为扫描到第一条数据的时间,这里可以虽然走了userid的pkey索引,但是根据username like ‘%aaaaaaaaaaaaaaaaaa%’ filter了600w行,就是说回表匹配了一遍所有行,因此耗时主要是在这里。
再看下limit 节点total_cost计算代价公式
*total_cost=startup_cost + (input_total_cost - input_startup_cost) count_rows / input_rows
总代价 = 父节点启动代价 + (总代价 - 启动代价)即父节点运行代价 * limit 行数/ 预估输出的总行数
这里在where 条件不含排序字段走排序字段索引情况下,有可能通过索引匹配到第一条符合条件的数据会比较久,就是说要考虑索引扫描的整体代价作为limit的启动代价(当前默认逻辑是通过索引很快找到第一条数据,然后输出limit n行,因此整体cost在这个场景下是偏小的),最极端的场景很可能是先扫描了整个索引并且回表去匹配数据,这个cost要预估进去。
因此这里的startup_cost 需要替换为total_cost, 计算公式可以调整为:
*total_cost=total_cost + (input_total_cost - input_startup_cost) count_rows / input_rows
三、方案
当where 条件不含order by字段走order by字段索引不进行sort的情况下,flag(limit_total_cost)会置为true,这个时候就走新的计算逻辑。
        if (count_est != 0){double          count_rows;if (count_est > 0) count_rows = (double) count_est;elsecount_rows = clamp_row_est(input_rows * 0.10);if (count_rows > *rows)count_rows = *rows;if (input_rows > 0){if (limit_total_cost){*total_cost = *total_cost + (input_total_cost - input_startup_cost)* count_rows / input_rows;}else*total_cost = *startup_cost +(input_total_cost - input_startup_cost)* count_rows / input_rows;}*rows = count_rows;if (*rows < 1)*rows = 1;}
}
四、验证
执行计划显示order by userid limit 1和之前order by userid +0 limit 1的执行计划相同,sql耗时符合预期。
test=# explain analyze  select userid from dba_users where  username like '%aaaaaaaaaaaaaaaaaa%' order by userid limit 1 ;QUERY PLAN
----------------------------------------------------------------------------------------------------------------------------------------------------Limit  (cost=2302.78..2304.28 rows=1 width=4) (actual time=140.581..140.585 rows=0 loops=1)->  Sort  (cost=2302.78..2304.28 rows=600 width=4) (actual time=140.576..140.579 rows=0 loops=1)Sort Key: useridSort Method: quicksort  Memory: 25kB->  Bitmap Heap Scan on dba_users  (cost=61.47..2299.78 rows=600 width=4) (actual time=140.534..140.536 rows=0 loops=1)Recheck Cond: ((username)::text ~~ '%aaaaaaaaaaaaaaaaaa%'::text)Rows Removed by Index Recheck: 40904Heap Blocks: exact=31502->  Bitmap Index Scan on dba_users_username_idx  (cost=0.00..61.32 rows=600 width=0) (actual time=22.800..22.802 rows=40904 loops=1)Index Cond: ((username)::text ~~ '%aaaaaaaaaaaaaaaaaa%'::text)Planning Time: 1.413 msExecution Time: 141.032 ms
(12 rows)test=#
再验证一个稍微复杂一点的场景。
修改前:
test=# explain analyze  select userid from dba_users where  username like '%aaaaaaaaaaaaaaaaaa%'   and userid in (select city_id from measurement where logdate > '2023-02-01' and logdate < '2023-05-01' and name like '%Nickyoung%' order by city_id   limit 5) ;QUERY PLAN
----------------------------------------------------------------------------------------------------------------------------------------------------------------------------------------------------------Nested Loop  (cost=2143.01..2185.00 rows=1 width=4) (actual time=8153.711..8153.717 rows=0 loops=1)->  HashAggregate  (cost=2142.57..2142.62 rows=5 width=4) (actual time=8153.710..8153.713 rows=0 loops=1)Group Key: measurement.city_idBatches: 1  Memory Usage: 24kB->  Limit  (cost=1.32..2142.56 rows=5 width=4) (actual time=8153.707..8153.710 rows=0 loops=1)->  Merge Append  (cost=1.32..582419.24 rows=1360 width=4) (actual time=8153.705..8153.708 rows=0 loops=1)Sort Key: measurement.city_id->  Index Scan using measurement_y2023m02_city_id_idx on measurement_y2023m02 measurement_1  (cost=0.43..59989.39 rows=140 width=4) (actual time=855.005..855.005 rows=0 loops=1)Filter: ((logdate > '2023-02-01'::date) AND (logdate < '2023-05-01'::date) AND ((name)::text ~~ '%Nickyoung%'::text))Rows Removed by Filter: 1399554->  Index Scan using measurement_y2023m03_city_id_idx on measurement_y2023m03 measurement_2  (cost=0.43..265374.77 rows=620 width=4) (actual time=3747.483..3747.483 rows=0 loops=1)Filter: ((logdate > '2023-02-01'::date) AND (logdate < '2023-05-01'::date) AND ((name)::text ~~ '%Nickyoung%'::text))Rows Removed by Filter: 6197829->  Index Scan using measurement_y2023m04_city_id_idx on measurement_y2023m04 measurement_3  (cost=0.43..257037.48 rows=600 width=4) (actual time=3551.214..3551.214 rows=0 loops=1)Filter: ((logdate > '2023-02-01'::date) AND (logdate < '2023-05-01'::date) AND ((name)::text ~~ '%Nickyoung%'::text))Rows Removed by Filter: 6001729->  Memoize  (cost=0.44..8.46 rows=1 width=4) (never executed)Cache Key: measurement.city_idCache Mode: logical->  Index Scan using dba_users_pkey on dba_users  (cost=0.43..8.45 rows=1 width=4) (never executed)Index Cond: (userid = measurement.city_id)Filter: ((username)::text ~~ '%aaaaaaaaaaaaaaaaaa%'::text)Planning Time: 3.282 msExecution Time: 8153.877 ms
(24 rows)test=#
修改后:
test=# explain analyze  select userid from dba_users where  username like '%aaaaaaaaaaaaaaaaaa%'   and userid in (select city_id from measurement where logdate > '2023-02-01' and logdate < '2023-05-01' and name like '%Nickyoung%' order by city_id   limit 5) ;QUERY PLAN
-------------------------------------------------------------------------------------------------------------------------------------------------------------------------Nested Loop  (cost=5982.58..6024.57 rows=1 width=4) (actual time=0.129..0.131 rows=0 loops=1)->  HashAggregate  (cost=5982.13..5982.18 rows=5 width=4) (actual time=0.128..0.130 rows=0 loops=1)Group Key: measurement.city_idBatches: 1  Memory Usage: 24kB->  Limit  (cost=5982.11..5982.12 rows=5 width=4) (actual time=0.126..0.127 rows=0 loops=1)->  Sort  (cost=5982.11..5985.51 rows=1360 width=4) (actual time=0.124..0.126 rows=0 loops=1)Sort Key: measurement.city_idSort Method: quicksort  Memory: 25kB->  Append  (cost=177.08..5959.52 rows=1360 width=4) (actual time=0.109..0.110 rows=0 loops=1)->  Bitmap Heap Scan on measurement_y2023m02 measurement_1  (cost=177.08..696.08 rows=140 width=4) (actual time=0.041..0.041 rows=0 loops=1)Recheck Cond: ((name)::text ~~ '%Nickyoung%'::text)Filter: ((logdate > '2023-02-01'::date) AND (logdate < '2023-05-01'::date))->  Bitmap Index Scan on measurement_y2023m02_name_idx  (cost=0.00..177.05 rows=140 width=0) (actual time=0.039..0.039 rows=0 loops=1)Index Cond: ((name)::text ~~ '%Nickyoung%'::text)->  Bitmap Heap Scan on measurement_y2023m03 measurement_2  (cost=377.60..2665.41 rows=620 width=4) (actual time=0.031..0.031 rows=0 loops=1)Recheck Cond: ((name)::text ~~ '%Nickyoung%'::text)Filter: ((logdate > '2023-02-01'::date) AND (logdate < '2023-05-01'::date))->  Bitmap Index Scan on measurement_y2023m03_name_idx  (cost=0.00..377.45 rows=620 width=0) (actual time=0.031..0.031 rows=0 loops=1)Index Cond: ((name)::text ~~ '%Nickyoung%'::text)->  Bitmap Heap Scan on measurement_y2023m04 measurement_3  (cost=377.50..2591.23 rows=600 width=4) (actual time=0.036..0.036 rows=0 loops=1)Recheck Cond: ((name)::text ~~ '%Nickyoung%'::text)Filter: ((logdate > '2023-02-01'::date) AND (logdate < '2023-05-01'::date))->  Bitmap Index Scan on measurement_y2023m04_name_idx  (cost=0.00..377.35 rows=600 width=0) (actual time=0.036..0.036 rows=0 loops=1)Index Cond: ((name)::text ~~ '%Nickyoung%'::text)->  Memoize  (cost=0.44..8.46 rows=1 width=4) (never executed)Cache Key: measurement.city_idCache Mode: logical->  Index Scan using dba_users_pkey on dba_users  (cost=0.43..8.45 rows=1 width=4) (never executed)Index Cond: (userid = measurement.city_id)Filter: ((username)::text ~~ '%aaaaaaaaaaaaaaaaaa%'::text)Planning Time: 2.047 msExecution Time: 0.254 ms
(32 rows)test=#
五、小结
也算牛刀小试修正了下limit的cost预估。不过这种修改方式看起来是不优雅不专业的,内核中可能有很多特例,我们不可能只是一股脑堆if else switch case逻辑。就像Linus说的,排除特例完美覆盖所有情况才是好的代码。
针对这个case,我认为优化器目前limit节点的cost计算逻辑需要加强,计算公式可能需要更复杂的关系因子,或者使用更合理的数学表达式。鄙人不才,还需持续学习积累。
代价预估在一些特定场景下难免会有偏差,其中统计信息不准导致的场景可能会多一些,可以参考这篇了解下统计信息的原理<深入浅出统计信息内核原理(上):Compressed Histogram>。