你好,我是郭震
AI数据可视化 第三集:美化柱状图,完整视频如下所示:
美化后效果前后对比,前:

后: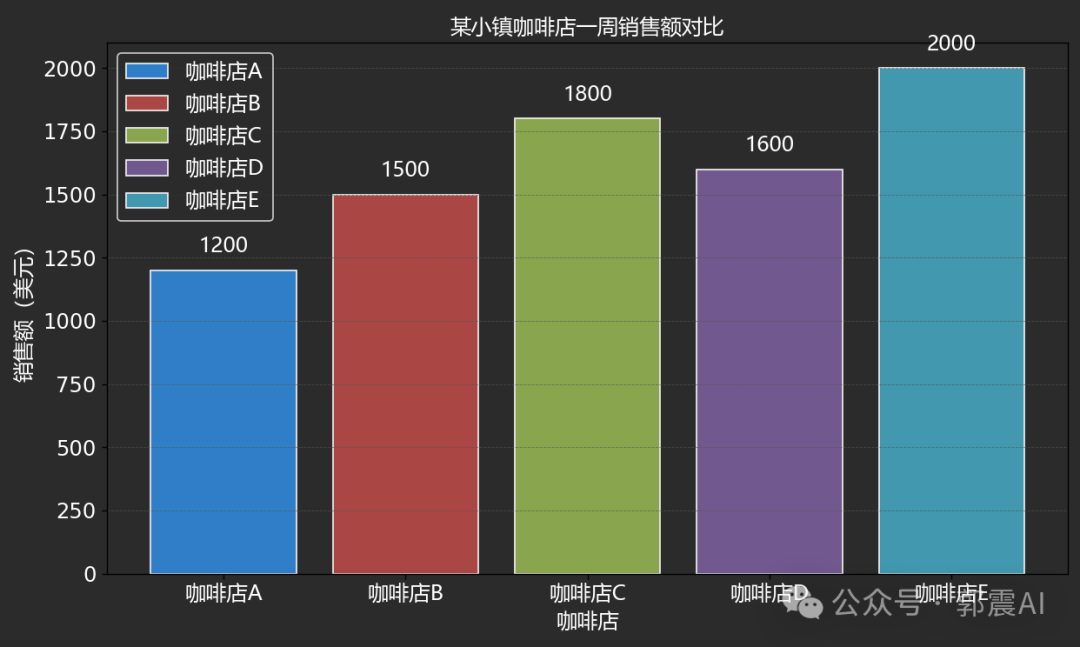
附完整案例源码:
util.py文件
import platformdef get_os():os_name = platform.system()if os_name == 'Windows':return "Windows"elif os_name == 'Darwin':return "macOS"else:return "Unknown OS"优化后的柱状图,完整源码:
import matplotlib.pyplot as plt
from matplotlib.font_manager import FontProperties# 根据操作系统设置字体
from util import get_ossystem_type = get_os()
if system_type == 'Windows':font = FontProperties(fname="C:\\Windows\\Fonts\\msyh.ttc", size=14)  # 注意路径分隔符的转义
elif system_type == 'macOS':font = FontProperties(fname="/System/Library/Fonts/PingFang.ttc", size=14)# 咖啡店及其销售额数据
coffee_shops = ['咖啡店A', '咖啡店B', '咖啡店C', '咖啡店D', '咖啡店E']
sales = [1200, 1500, 1800, 1600, 2000]# 自定义颜色列表
colors = ['#307EC7', '#AA4643', '#89A54E', '#71588F', '#4198AF']plt.figure(figsize=(10, 6))# 设置图表背景为科技黑
plt.gca().set_facecolor('#2B2B2B')
plt.gcf().set_facecolor('#2B2B2B')bars = plt.bar(coffee_shops, sales, color=colors, edgecolor='#EEEEEE')  # 设置柱子边框为亮色# 在柱子顶部添加数据标签
for bar in bars:yval = bar.get_height()plt.text(bar.get_x() + bar.get_width()/2, yval + 50, yval, ha='center', va='bottom', color='#FFFFFF', fontproperties=font)  # 数据标签颜色改为白色# 设置网格线样式
plt.grid(color='#555555', linestyle='--', linewidth=0.5, axis='y', zorder=0, alpha=0.7)# 设置标签和标题颜色为亮色
plt.xticks(ticks=range(len(coffee_shops)), labels=coffee_shops, fontproperties=font, color='#FFFFFF')
plt.xlabel('咖啡店', fontproperties=font, color='#FFFFFF')
plt.ylabel('销售额(美元)', fontproperties=font, color='#FFFFFF')
plt.title('某小镇咖啡店一周销售额对比', fontproperties=font, color='#FFFFFF')
plt.yticks(fontsize=14, color='#FFFFFF')# 设置图例,调整图例的背景和文字颜色
legend = plt.legend(bars, coffee_shops, prop=font)
frame = legend.get_frame()
frame.set_color('#2B2B2B')  # 图例背景色
frame.set_edgecolor('#EEEEEE')  # 图例边框色
plt.setp(legend.get_texts(), color='#FFFFFF')  # 图例文字颜色plt.tight_layout()
plt.show()

![B3657 [语言月赛202209] 公园门票](https://img-blog.csdnimg.cn/img_convert/a012806fb5d1528ee1d6d36d66cd541f.png)

