背景
为避免再次出现因Prometheus宕机导致业务无法查看历史数据受到影响,准备将Prometheus架构从单节点方式升级为高可用集群方式并将后端存储由本地存储改为远端分布式时序数据库存储。分布式时序数据库采用国产数据库TDengine。
架构

解释:虚线代表Prometheus master节点的Prometheus服务故障之后的线路。
| IP地址 | 主机名 | 操作系统 | 软件 | 网卡名 |
|---|---|---|---|---|
| 10.0.0.10 | grafana | Ubuntu 20.04.4 LTS arm64架构 | grafana_10.3.1 | ens160 |
| 10.0.0.11 | prometheus01 | Ubuntu 20.04.4 LTS arm64架构 | node_exporter-1.7.0, prometheus 2.45.3, keepalived | ens160 |
| 10.0.0.12 | TDengine01 | Ubuntu 20.04.4 LTS arm64架构 | TDengine-server-3.0.3.0 | ens160 |
| 10.0.0.13 | prometheus02 | Ubuntu 20.04.4 LTS arm64架构 | node_exporter-1.7.0, prometheus 2.45.3, keepalived | ens160 |
| 10.0.0.14 | TDengine02 | Ubuntu 20.04.4 LTS arm64架构 | TDengine-server-3.0.3.0 | ens160 |
| 10.0.0.15 | TDengine03 | Ubuntu 20.04.4 LTS arm64架构 | TDengine-server-3.0.3.0 | ens160 |
| 10.0.0.16 | TDengine04 | Ubuntu 20.04.4 LTS arm64架构 | TDengine-server-3.0.3.0 | ens160 |
解释:
在10.0.0.11和10.0.0.13上分别部署node_exporter-1.7.0, prometheus 2.45.3, keepalived,并且将Prometheus01的权重调高,Prometheus02处于stop状态;
Grafana连接Prometheus的VIP地址;
Prometheus01 读写设置为TDengine01节点;
Prometheus02 读写设置为TDengine02节点;
编写Keepalived脚本 实现当Prometheus01故障时 自动开启Prometheus02;
TDengine是集群方式
操作步骤
1.修改主机名
hostnamectl set-hostname grafana
hostnamectl set-hostname prometheus01
hostnamectl set-hostname prometheus02
hostnamectl set-hostname TDengine01
hostnamectl set-hostname TDengine02
hostnamectl set-hostname TDengine03
hostnamectl set-hostname TDengine04
2.设置时区以及时间同步
全部都要机器都要操作
# 设置时区
timedatectl set-timezone Asia/Shanghai
# 安装基础软件
apt install -y lrzsz net-tools ntpdate
# 同步时间
/usr/sbin/ntpdate ntp1.aliyun.com
crontab -l > crontab_conf ; echo "*/5 * * * * /usr/sbin/ntpdate ntp1.aliyun.com >/dev/null 2>&1" >> crontab_conf && crontab crontab_conf && rm -f crontab_conf
timedatectl set-local-rtc 1
3.配置/etc/hosts
TDengine机器需要操作
vim /etc/hosts
10.0.0.12 TDengine01
10.0.0.14 TDengine02
10.0.0.15 TDengine03
10.0.0.16 TDengine04
4.安装Prometheus
只是安装Prometheus暂时不要启动,后面对配置文件更改后再启动prometheus01,02不启动;
wget https://github.com/prometheus/prometheus/releases/download/v2.45.3/prometheus-2.45.3.linux-arm64.tar.gzmv prometheus-2.45.3.linux-arm64.tar.gz /etc/
cd /etc
tar -zxvf prometheus-2.45.3.linux-arm64.tar.gz
mv prometheus-2.45.3.linux-arm64 prometheus
rm -rf prometheus-2.45.3.linux-arm64.tar.gz
cd prometheus
mkdir data
mv prometheus promtool  /usr/local/bin/cat > /etc/systemd/system/prometheus.service << EOF
[Unit]
Description=Prometheus
Documentation=https://prometheus.io/
After=network.target
[Service]
ExecStart=/usr/local/bin/prometheus --config.file=/etc/prometheus/prometheus.yml --storage.tsdb.path=/etc/prometheus/data --web.listen-address=0.0.0.0:9090
WorkingDirectory=/etc/prometheus/
Restart=on-failure
[Install]
WantedBy=multi-user.target
EOF
5.安装node_export
wget https://github.com/prometheus/node_exporter/releases/download/v1.7.0/node_exporter-1.7.0.linux-arm64.tar.gz
tar -xvzf node_exporter-1.7.0.linux-arm64.tar.gz
cp node_exporter-1.7.0.linux-arm64/node_exporter /usr/local/bin/node_exporter
rm -rf  node_exporter-1.7.0.linux-arm64*
cat > /etc/systemd/system/node_exporter.service << EOF
[Unit]
Description=node_exporter
Documentation=https://prometheus.io/
After=network.target[Service]
ExecStart=/usr/local/bin/node_exporter
Restart=on-failure
RestartSec=20[Install]
WantedBy=multi-user.target
EOFsystemctl daemon-reload
systemctl restart node_exporter
systemctl enable node_exporter
systemctl status node_exporter
6.安装keepalived
prometheus01和prometheus02都需要进行安装并配置
apt -y install keepalived ipvsadm
systemctl enable keepalived
prometheus01机器Keepalived配置文件
vim /etc/keepalived/keepalived.conf
! Configuration File for keepalived
global_defs {router_id 1
}
vrrp_script check_prome {script "/etc/keepalived/check_prome.sh"interval 1weight -50
}
vrrp_instance VI_1 {state MASTERinterface ens160virtual_router_id 1mcast_src_ip 10.0.0.11priority 90advert_int 1authentication {auth_type PASSauth_pass 123456}track_script {check_prome}virtual_ipaddress {10.0.0.20}notify_master "/etc/keepalived/notify.sh master"notify_backup "/etc/keepalived/notify.sh backup"notify_fault "/etc/keepalived/notify.sh fault"
}
prometheus02机器Keepalived配置文件
vim /etc/keepalived/keepalived.conf
! Configuration File for keepalived
global_defs {router_id 2
}vrrp_instance VI_1 {state BACKUPinterface ens160virtual_router_id 1mcast_src_ip 10.0.0.13priority 80advert_int 1authentication {auth_type PASSauth_pass 123456}virtual_ipaddress {10.0.0.20}notify_master "/etc/keepalived/notify.sh master"notify_backup "/etc/keepalived/notify.sh backup"notify_fault "/etc/keepalived/notify.sh fault"
}
注释
notify_master 当前节点成为主节点时触发脚本
notify_backup 当前节点成为备节点时触发脚本
notify_fault 当前节点转为"失败"状态时触发的脚本
7.设置Keepalived脚本
prometheus_check.sh脚本
只需要在Prometheus01机器上设置
vim /etc/keepalived/check_prome.sh
chmod +x /etc/keepalived/check_prome.sh
记得创建脚本后赋予执行权限
#!/bin/bash
processes_num=$(ps -ef |grep [p]rometheus|wc -l)
if [ $processes_num = 0 ]
thenexit 1
elseexit 0
fi
prometheus01 prometheus02机器都需要设置,内容一致。
notify.sh脚本
vim /etc/keepalived/notify.sh
chmod +x /etc/keepalived/notify.sh
记得创建脚本后赋予执行权限
#!/bin/bash
case $1 inmaster)systemctl start prometheus;;backup)systemctl stop prometheus;;fault)systemctl stop prometheus;;*)echo "不支持该参数,请检查输入的参数是否正确"
esac
8.安装TDengine集群
wget https://www.taosdata.com/assets-download/3.0/TDengine-server-3.0.3.0-Linux-arm64.tar.gztar -zxvf TDengine-server-3.0.3.0-Linux-arm64.tar.gz
cd TDengine-server-3.0.3.0
./install.sh
修改TDengine集群配置文件
各节点配置文件中的firstEp 配置保持一致
vim /etc/taos/taos.cfg
firstEp                   TDengine01:6030
fqdn                      TDengine01
serverPort                6030# 暂时保留 可能没用
monitor 1
monitorFQDN TDengine01
audit 1
启动TDengine服务
systemctl enable taosd
systemctl enable taosadapter
systemctl restart taosd
systemctl restart taosadapter
systemctl status taosd
systemctl status taosadaptertaos
show dnodes;CREATE DNODE "TDengine02:6030";
CREATE DNODE "TDengine03:6030";
CREATE DNODE "TDengine04:6030";
show dnodes;# 保留时间为1天
CREATE DATABASE prometheus KEEP 1 DURATION 1;
use prometheus;
show stables;
select * from metrics limit 10\G;
修改默认密码
# 修改root密码
SHOW USERS;
ALTER USER root PASS 'NUma@numa1';
9.配置Prometheus01
vim /etc/prometheus/prometheus.yml
global:scrape_interval: 15s evaluation_interval: 15s
scrape_configs:- job_name: "prometheus"static_configs:- targets: ["10.0.0.11:9100", "10.0.0.13:9100"]
remote_write:- url: "http://10.0.0.12:6041/prometheus/v1/remote_write/prometheus"basic_auth:username: rootpassword: NUma@numa1remote_timeout: 30squeue_config:capacity: 100000max_shards: 1000max_samples_per_send: 1000batch_send_deadline: 5smin_backoff: 30msmax_backoff: 100ms
remote_read:- url: "http://10.0.0.12:6041/prometheus/v1/remote_read/prometheus"basic_auth:username: rootpassword: NUma@numa1remote_timeout: 10sread_recent: true
10.配置Prometheus02
Prometheus 设置从TDengine04节点写入读取数据
vim /etc/prometheus/prometheus.yml
global:scrape_interval: 15s evaluation_interval: 15s
scrape_configs:- job_name: "prometheus"static_configs:- targets: ["10.0.0.11:9100", "10.0.0.13:9100"]
remote_write:- url: "http://10.0.0.16:6041/prometheus/v1/remote_write/prometheus"basic_auth:username: rootpassword: NUma@numa1remote_timeout: 30squeue_config:capacity: 100000max_shards: 1000max_samples_per_send: 1000batch_send_deadline: 5smin_backoff: 30msmax_backoff: 100ms
remote_read:- url: "http://10.0.0.16:6041/prometheus/v1/remote_read/prometheus"basic_auth:username: rootpassword: NUma@numa1remote_timeout: 10sread_recent: true
11.启动Prometheus01
systemctl daemon-reload
systemctl start prometheus
systemctl enable prometheus
systemctl restart prometheus
systemctl status prometheus
启动keepalived并检查VIP
# 启动
systemctl start  keepalived
# 检查VIP
root@prometheus01:~# ip a
12.安装Grafana
sudo apt-get install -y adduser libfontconfig1 musl
wget https://dl.grafana.com/oss/release/grafana_10.3.1_arm64.deb
sudo dpkg -i grafana_10.3.1_arm64.deb
# 启动Grafana
sudo /bin/systemctl daemon-reload
sudo /bin/systemctl enable grafana-server
sudo /bin/systemctl start grafana-server
# 默认账户名密码
admin/admin
# 配置数据源时设置VIP地址 切记!!!
我这里设置的是http://10.0.0.20:9090/
# 导入Linux监控面板
8919
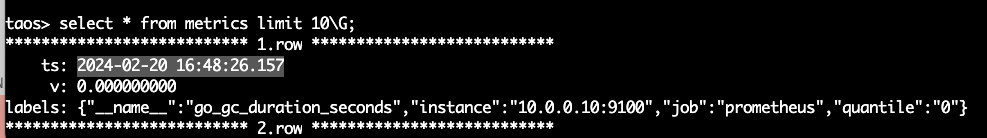
13.查看TDengine数据
taos -uroot -p'NUma@numa1'
use prometheus;
show stables;
select * from metrics limit 10\G;
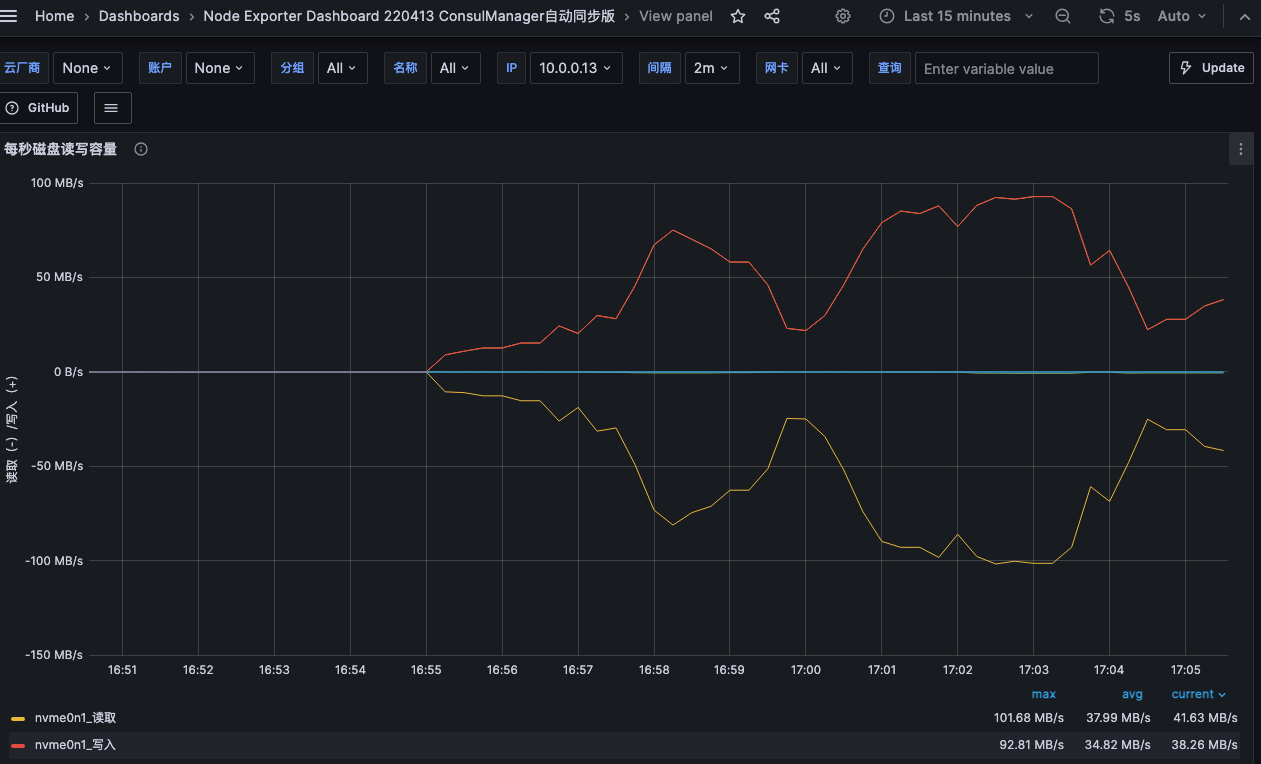
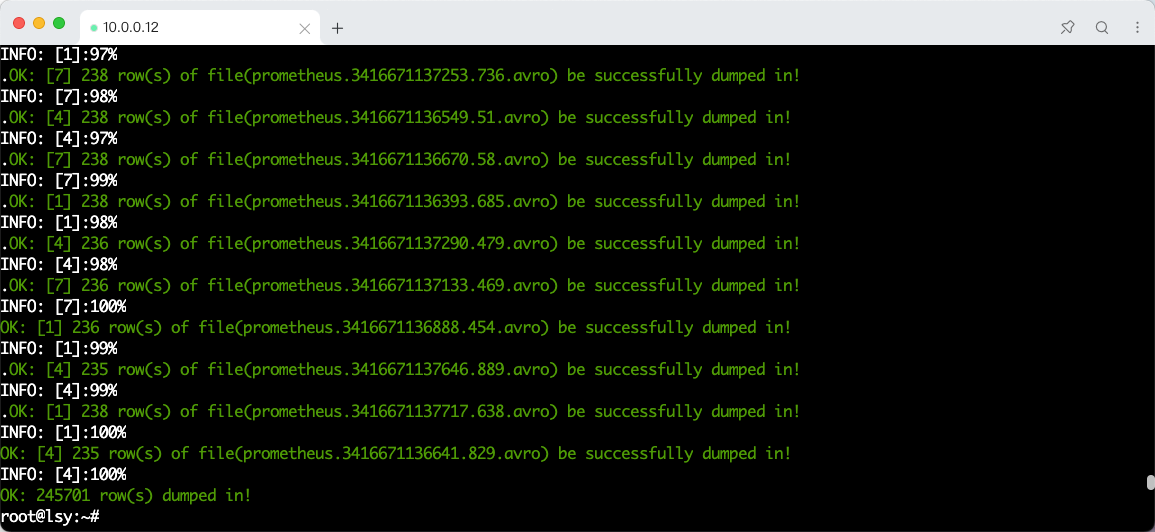
14.实验验证
在压测磁盘的时候进行操作:
1、 关闭Prometheus01,查看VIP是否会转移到Prometheus02 并且自动设置Prometheus启动
2、启动Prometheus01,查看VIP是否回到了Prometheus01 并且Prometheus02的Prometheus服务关闭
验证操作过程中 显示磁盘读写的图表是否中断,全程图表没有中断则说明高可用架构已经实现。
# 压测命令
while true; do  dd if=/dev/nvme0n1p2  of=/testrw.dbf bs=4k && rm -rf /testrw.dbf; done
数据备份
taosdump -uroot -p'NUma@numa1' -D prometheus -o /root/backup/

数据还原
taosdump -uroot -p'NUma@numa1' -D prometheus -i /root/backup/

数据清理
TDengine 数据建模 | TDengine 文档 | 涛思数据 (taosdata.com)
数据库 | TDengine 文档 | 涛思数据 (taosdata.com)
采用Keep方式在创建数据库时指定数据保留时间,此处为测试,设置的是保留一天
CREATE DATABASE prometheus KEEP 1 DURATION 1;
周二下午4:48 第一条数据的时间(等周三下午4:48再查看一下试试)
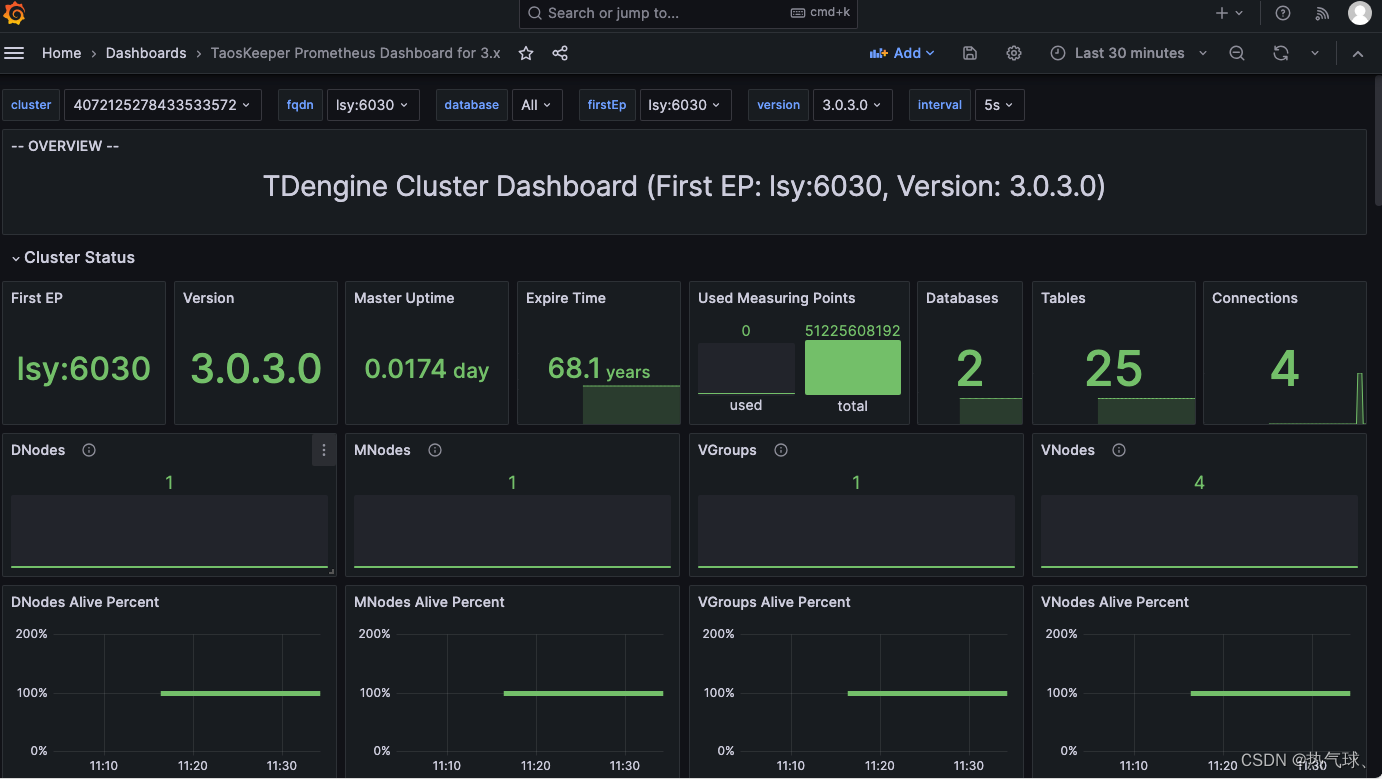
监控TDengine
taosKeeper 是 TDengine 3.0 版本监控指标的导出工具,通过简单的几项配置即可获取 TDengine 的运行状态。taosKeeper 使用 TDengine RESTful 接口,所以不需要安装 TDengine 客户端即可使用。
taosKeeper | TDengine 文档 | 涛思数据 (taosdata.com)
编辑配置文件
root@lsy:~# vim /etc/taos/keeper.toml
# Start with debug middleware for gin
debug = false# Listen port, default is 6043
port = 6043# log level
loglevel = "info"# go pool size
gopoolsize = 50000# interval for TDengine metrics
RotationInterval = "15s"[tdengine]
host = "127.0.0.1"
port = 6041
username = "root"
password = "NUma@numa1"# list of taosAdapter that need to be monitored
[taosAdapter]
address = ["127.0.0.1:6041"][metrics]
# metrics prefix in metrics names.
prefix = "taos"# database for storing metrics data
database = "log"# export some tables that are not super table
tables = [][environment]
# Whether running in cgroup.
incgroup = false
启动
systemctl start taoskeeper
systemctl enable taoskeeper
systemctl status taoskeeper
查看监控结果
$ taos -uroot -p'NUma@numa1'
# 如上示例,使用 log 库作为监控日志存储位置
> use log;
> select * from cluster_info limit 1;
结果示例:
taos> select * from cluster_info limit 1;ts            |            first_ep            | first_ep_dnode_id |   version    |    master_uptime     | monitor_interval |  dbs_total  |  tbs_total  | stbs_total  | dnodes_total | dnodes_alive | mnodes_total | mnodes_alive | vgroups_total | vgroups_alive | vnodes_total | vnodes_alive | connections_total |  protocol   |           cluster_id           |
===============================================================================================================================================================================================================================================================================================================================================================================2024-02-20 11:08:22.409 | lsy:6030                       |                 1 | 3.0.3.0      |              0.00000 |               30 |           2 |           8 |          19 |            1 |            1 |            1 |            1 |             4 |             4 |            4 |            4 |                 4 |           1 | 4072125278433533572            |
Query OK, 1 row(s) in set (0.005329s)taos>
导出监控指标
root@lsy:~# curl http://127.0.0.1:6043/metrics|wc -l% Total    % Received % Xferd  Average Speed   Time    Time     Time  CurrentDload  Upload   Total   Spent    Left  Speed
100 15575    0 15575    0     0  7604k      0 --:--:-- --:--:-- --:--:-- 7604k
261
root@lsy:~#
集成Prometheus
- job_name: "taoskeeper"static_configs:- targets: ["localhost:6043"]
grafana导入监控面板
# 面板ID
18587
参考文档
TDengine 发布历史及下载链接 | TDengine 文档 | 涛思数据 (taosdata.com)
TDengine 权限管理 | 用户增删改查,授权与撤销授权_tdengine 用户访问权限-CSDN博客
产品简介 - 《TDengine v3.0 中文文档》 - 书栈网 · BookStack