文章目录
- 前言
- OOMMonitorInitTask.INSTANCE.init
- OOMMonitor.INSTANCE.startLoop
- super.startLoop
- call() == LoopState.Terminate
- dumpAndAnalysis
- dump
- startAnalysisService
- 回到startLoop方法
- 总结
前言
这篇文章主要剖析KOOM的Java层源码设计逻辑。
使用篇请看上一篇:
【Android KOOM】KOOM java leak使用全解析
OOMMonitorInitTask.INSTANCE.init
OOMMonitorInitTask.INSTANCE.init(JavaLeakTestActivity.this.getApplication());
这里进行初始化,来看看init里面做了什么:
object OOMMonitorInitTask : InitTask {override fun init(application: Application) {val config = OOMMonitorConfig.Builder().setThreadThreshold(50) //50 only for test! Please use default value!.setFdThreshold(300) // 300 only for test! Please use default value!.setHeapThreshold(0.9f) // 0.9f for test! Please use default value!.setVssSizeThreshold(1_000_000) // 1_000_000 for test! Please use default value!.setMaxOverThresholdCount(1) // 1 for test! Please use default value!.setAnalysisMaxTimesPerVersion(3) // Consider use default value!.setAnalysisPeriodPerVersion(15 * 24 * 60 * 60 * 1000) // Consider use default value!.setLoopInterval(5_000) // 5_000 for test! Please use default value!.setEnableHprofDumpAnalysis(true).setHprofUploader(object : OOMHprofUploader {override fun upload(file: File, type: OOMHprofUploader.HprofType) {MonitorLog.e("OOMMonitor", "todo, upload hprof ${file.name} if necessary")}}).setReportUploader(object : OOMReportUploader {override fun upload(file: File, content: String) {MonitorLog.i("OOMMonitor", content)MonitorLog.e("OOMMonitor", "todo, upload report ${file.name} if necessary")}}).build()MonitorManager.addMonitorConfig(config)}
}
可以看到里面做了各种参数的配置,包括上传hprof和报告的上传回调。
使用了构建者模式来进行参数设置,接着通过MonitorManager.addMonitorConfig(config) 添加到MonitorManager中,可见MonitorManager这个类就是监控器管理用的。
interface InitTask {fun init(application: Application)
}
定义了一个接口,用来初始化内存监控任务。参数是需要传递Application,但是这里没有看到有使用到。
OOMMonitor.INSTANCE.startLoop
OOMMonitor.INSTANCE.startLoop(true, false,5_000L);上面配置好咯参数和回调,这里就是开始循环。下面来看看里面做了什么。
object OOMMonitor : LoopMonitor<OOMMonitorConfig>(), LifecycleEventObserver {
@Volatileprivate var mIsLoopStarted = false
...override fun startLoop(clearQueue: Boolean, postAtFront: Boolean, delayMillis: Long) {throwIfNotInitialized { return }if (!isMainProcess()) {return}MonitorLog.i(TAG, "startLoop()")if (mIsLoopStarted) {return}mIsLoopStarted = truesuper.startLoop(clearQueue, postAtFront, delayMillis)getLoopHandler().postDelayed({ async { processOldHprofFile() } }, delayMillis)}...}
判断下,假如非主线程,立刻返回。这里可以看出来,调用的地方必须是主线程,不然它就不会执行。
来看下mIsLoopStarted,它被Volatile修饰。Volatile的作用是可以把对应的变量刷新到Cpu缓存中,保证了多线程环境变量的可见性。假如有其他线程修改了这个变量,那么其他线程可以立刻知道。
而这里判断假如loop已经开始,那么也return掉。这些属于健壮性代码。
super.startLoop
看下super.startLoop:
open fun startLoop(clearQueue: Boolean = true,postAtFront: Boolean = false,delayMillis: Long = 0L) {if (clearQueue) getLoopHandler().removeCallbacks(mLoopRunnable)if (postAtFront) {getLoopHandler().postAtFrontOfQueue(mLoopRunnable)} else {getLoopHandler().postDelayed(mLoopRunnable, delayMillis)}mIsLoopStopped = false}
这里可看到围绕着mLoopRunnable来做功夫。首先看看是否需要清理之前的mLoopRunnable,接着根据参数,决定把runable post到消息队列的哪种情况中,这个稍后研究。这里先看看哪里传入的Handler。
通过跳转,找到了这里:
package com.kwai.koom.base.loopimport android.os.Handler
import android.os.HandlerThread
import android.os.Process.THREAD_PRIORITY_BACKGROUNDinternal object LoopThread : HandlerThread("LoopThread", THREAD_PRIORITY_BACKGROUND) {init {start()}internal val LOOP_HANDLER = Handler(LoopThread.looper)
}
这里是一个HandlerThread,至于HandlerThread。并且LoopThread它在初始化就执行start方法来启动线程。
接着看mLoopRunnable
protected open fun getLoopInterval(): Long {return DEFAULT_LOOP_INTERVAL}companion object {private const val DEFAULT_LOOP_INTERVAL = 1000L}private val mLoopRunnable = object : Runnable {override fun run() {if (call() == LoopState.Terminate) {return}if (mIsLoopStopped) {return}getLoopHandler().removeCallbacks(this)getLoopHandler().postDelayed(this, getLoopInterval())}}
这里就是拿到handler,执行postDelayed,间隔设置为1秒。
call() == LoopState.Terminate
这行代码是关键,假如LoopState.Terminate,是结束状态的话,那就执行call方法。
看下OOMMonitor的实现:
override fun call(): LoopState {if (!sdkVersionMatch()) {return LoopState.Terminate}if (mHasDumped) {return LoopState.Terminate}return trackOOM()}
假如dump完成,就返回terminate状态。继续看trackOOM方法:
private fun trackOOM(): LoopState {SystemInfo.refresh()mTrackReasons.clear()for (oomTracker in mOOMTrackers) {if (oomTracker.track()) {mTrackReasons.add(oomTracker.reason())}}if (mTrackReasons.isNotEmpty() && monitorConfig.enableHprofDumpAnalysis) {if (isExceedAnalysisPeriod() || isExceedAnalysisTimes()) {MonitorLog.e(TAG, "Triggered, but exceed analysis times or period!")} else {async {MonitorLog.i(TAG, "mTrackReasons:${mTrackReasons}")dumpAndAnalysis()}}return LoopState.Terminate}return LoopState.Continue}
看下refresh方法:
var procStatus = ProcStatus()var lastProcStatus = ProcStatus()var memInfo = MemInfo()var lastMemInfo = MemInfo()var javaHeap = JavaHeap()var lastJavaHeap = JavaHeap()fun refresh() {lastJavaHeap = javaHeaplastMemInfo = memInfolastProcStatus = procStatusjavaHeap = JavaHeap()procStatus = ProcStatus()memInfo = MemInfo()javaHeap.max = Runtime.getRuntime().maxMemory()javaHeap.total = Runtime.getRuntime().totalMemory()javaHeap.free = Runtime.getRuntime().freeMemory()javaHeap.used = javaHeap.total - javaHeap.freejavaHeap.rate = 1.0f * javaHeap.used / javaHeap.maxFile("/proc/self/status").forEachLineQuietly { line ->if (procStatus.vssInKb != 0 && procStatus.rssInKb != 0&& procStatus.thread != 0) return@forEachLineQuietlywhen {line.startsWith("VmSize") -> {procStatus.vssInKb = VSS_REGEX.matchValue(line)}line.startsWith("VmRSS") -> {procStatus.rssInKb = RSS_REGEX.matchValue(line)}line.startsWith("Threads") -> {procStatus.thread = THREADS_REGEX.matchValue(line)}}}File("/proc/meminfo").forEachLineQuietly { line ->when {line.startsWith("MemTotal") -> {memInfo.totalInKb = MEM_TOTAL_REGEX.matchValue(line)}line.startsWith("MemFree") -> {memInfo.freeInKb = MEM_FREE_REGEX.matchValue(line)}line.startsWith("MemAvailable") -> {memInfo.availableInKb = MEM_AVA_REGEX.matchValue(line)}line.startsWith("CmaTotal") -> {memInfo.cmaTotal = MEM_CMA_REGEX.matchValue(line)}line.startsWith("ION_heap") -> {memInfo.IONHeap = MEM_ION_REGEX.matchValue(line)}}}memInfo.rate = 1.0f * memInfo.availableInKb / memInfo.totalInKbMonitorLog.i(TAG, "----OOM Monitor Memory----")MonitorLog.i(TAG,"[java] max:${javaHeap.max} used ratio:${(javaHeap.rate * 100).toInt()}%")MonitorLog.i(TAG,"[proc] VmSize:${procStatus.vssInKb}kB VmRss:${procStatus.rssInKb}kB " + "Threads:${procStatus.thread}")MonitorLog.i(TAG,"[meminfo] MemTotal:${memInfo.totalInKb}kB MemFree:${memInfo.freeInKb}kB " + "MemAvailable:${memInfo.availableInKb}kB")MonitorLog.i(TAG,"avaliable ratio:${(memInfo.rate * 100).toInt()}% CmaTotal:${memInfo.cmaTotal}kB ION_heap:${memInfo.IONHeap}kB")}
SystemInfo类里面有很多Java堆,内存信息,进程状态相关的类。这里面可以看出,这个类就是用来把一些监控到的数据刷新和写入文件里面的。当然,还有log输出。
再看mOOMTrackers,分别是各个跟踪器
private val mOOMTrackers = mutableListOf(HeapOOMTracker(), ThreadOOMTracker(), FdOOMTracker(),PhysicalMemoryOOMTracker(), FastHugeMemoryOOMTracker())
他们抽象父类是:
abstract class OOMTracker : Monitor<OOMMonitorConfig>() {/*** @return true 表示追踪到oom、 false 表示没有追踪到oom*/abstract fun track(): Boolean/*** 重置track状态*/abstract fun reset()/*** @return 追踪到的oom的标识*/abstract fun reason(): String
}
至于具体怎么track,由于篇幅和内容方向问题,这篇文章先不进一步分析。留到后面的文章继续。
回到trackOOM方法:
mTrackReasons.clear()for (oomTracker in mOOMTrackers) {if (oomTracker.track()) {mTrackReasons.add(oomTracker.reason())}}if (mTrackReasons.isNotEmpty() && monitorConfig.enableHprofDumpAnalysis) {if (isExceedAnalysisPeriod() || isExceedAnalysisTimes()) {MonitorLog.e(TAG, "Triggered, but exceed analysis times or period!")} else {async {MonitorLog.i(TAG, "mTrackReasons:${mTrackReasons}")dumpAndAnalysis()}}假如track到了原因,它就添加mTrackReasons。
假如分析超过时间和次数,就打印error。其它正常情况就打印mTrackReasons,执行dumpAndAnalysis,然后返回LoopState.Terminate状态。
下面重点看看dumpAndAnalysis方法:
dumpAndAnalysis
private fun dumpAndAnalysis() {MonitorLog.i(TAG, "dumpAndAnalysis");runCatching {if (!OOMFileManager.isSpaceEnough()) {MonitorLog.e(TAG, "available space not enough", true)return@runCatching}if (mHasDumped) {return}mHasDumped = trueval date = Date()val jsonFile = OOMFileManager.createJsonAnalysisFile(date)val hprofFile = OOMFileManager.createHprofAnalysisFile(date).apply {createNewFile()setWritable(true)setReadable(true)}MonitorLog.i(TAG, "hprof analysis dir:$hprofAnalysisDir")ForkJvmHeapDumper.getInstance().run {dump(hprofFile.absolutePath)}MonitorLog.i(TAG, "end hprof dump", true)Thread.sleep(1000) // make sure file synced to disk.MonitorLog.i(TAG, "start hprof analysis")startAnalysisService(hprofFile, jsonFile, mTrackReasons.joinToString())}.onFailure {it.printStackTrace()MonitorLog.i(TAG, "onJvmThreshold Exception " + it.message, true)}}
这里面正式把track到的数据写入到文件中,包括json文件和hprof文件。重点看dump方法:
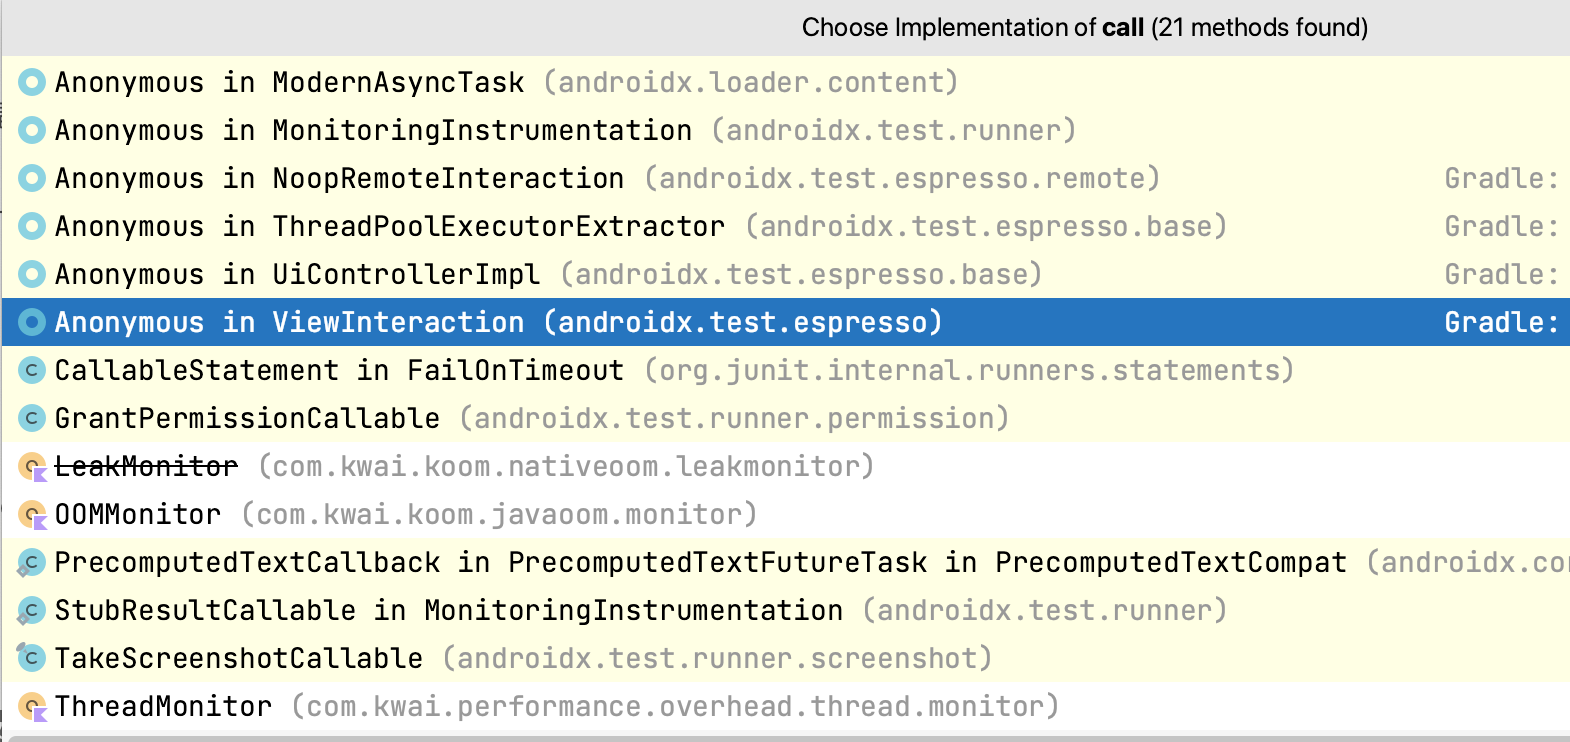
dump
@Overridepublic synchronized boolean dump(String path) {MonitorLog.i(TAG, "dump " + path);if (!sdkVersionMatch()) {throw new UnsupportedOperationException("dump failed caused by sdk version not supported!");}init();if (!mLoadSuccess) {MonitorLog.e(TAG, "dump failed caused by so not loaded!");return false;}boolean dumpRes = false;try {MonitorLog.i(TAG, "before suspend and fork.");int pid = suspendAndFork();if (pid == 0) {// Child processDebug.dumpHprofData(path);exitProcess();} else if (pid > 0) {// Parent processdumpRes = resumeAndWait(pid);MonitorLog.i(TAG, "dump " + dumpRes + ", notify from pid " + pid);}} catch (IOException e) {MonitorLog.e(TAG, "dump failed caused by " + e);e.printStackTrace();}return dumpRes;}
init方法:
private void init () {if (mLoadSuccess) {return;}if (loadSoQuietly("koom-fast-dump")) {mLoadSuccess = true;nativeInit();}}
这里加载一个so库,可以看到还有这些native方法:
/*** Init before do dump.*/private native void nativeInit();/*** Suspend the whole ART, and then fork a process for dumping hprof.** @return return value of fork*/private native int suspendAndFork();/*** Resume the whole ART, and then wait child process to notify.** @param pid pid of child process.*/private native boolean resumeAndWait(int pid);/*** Exit current process.*/private native void exitProcess();
接着执行suspendAndFork,也是native方法。拿到进程pid之后,fork当前进程。然后dump hprof文件。
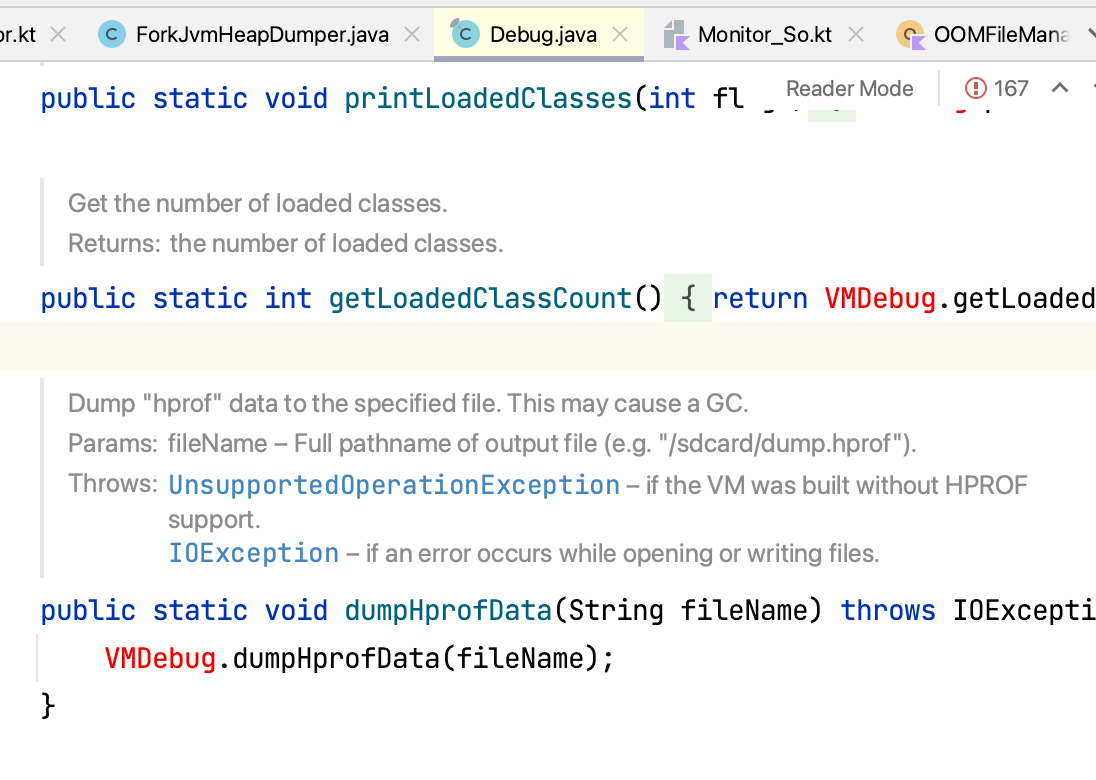
至于为什么需要fork一个进程出来dump,可以通过上面截图看出来原因,dump hprof 数据的时候会触发GC,而GC会出发STW,这无疑会造成APP卡顿。这也是LeakCanary不能做成线上内存监控的主要原因,而KOOM解决了这个问题。
子进程dump工作做完之后,接着exitProcess退出。
假如pid > 0,resumeAndWait,就恢复整个ART虚拟机,然后等待子线程唤醒。
这里逻辑我说的有点不清晰,由于看不到so的代码,无法确认。有知道的大佬可以指点一下,感激。
startAnalysisService
前面fork子进程后,执行了 Thread.sleep(1000) // make sure file synced to disk. 。
接着看是分析堆转信息工作:
private fun startAnalysisService(hprofFile: File,jsonFile: File,reason: String) {if (hprofFile.length() == 0L) {hprofFile.delete()MonitorLog.i(TAG, "hprof file size 0", true)return}if (!getApplication().isForeground) {MonitorLog.e(TAG, "try startAnalysisService, but not foreground")mForegroundPendingRunnables.add(Runnable {startAnalysisService(hprofFile,jsonFile,reason)})return}OOMPreferenceManager.increaseAnalysisTimes()val extraData = AnalysisExtraData().apply {this.reason = reasonthis.currentPage = getApplication().currentActivity?.localClassName.orEmpty()this.usageSeconds = "${(SystemClock.elapsedRealtime() - mMonitorInitTime) / 1000}"}HeapAnalysisService.startAnalysisService(getApplication(),hprofFile.canonicalPath,jsonFile.canonicalPath,extraData,object : AnalysisReceiver.ResultCallBack {override fun onError() {MonitorLog.e(TAG, "heap analysis error, do file delete", true)hprofFile.delete()jsonFile.delete()}override fun onSuccess() {MonitorLog.i(TAG, "heap analysis success, do upload", true)val content = jsonFile.readText()MonitorLogger.addExceptionEvent(content, Logger.ExceptionType.OOM_STACKS)monitorConfig.reportUploader?.upload(jsonFile, content)monitorConfig.hprofUploader?.upload(hprofFile, OOMHprofUploader.HprofType.ORIGIN)}})}
这里就是进行针对一些dump数据进行解析、整理等工作,假如需要上传到服务器,这里也预留了接口供开发者使用,非常贴心。
到这里KOOM框架的Java层核心代码逻辑基本过完了。
回到startLoop方法
回到startLoop方法中super.startLoop 方法,下一行代码是:
getLoopHandler().postDelayed({ async { processOldHprofFile() } }, delayMillis)前面分析知道,getLoopHandler拿到的是HandlerThread,这里延时post一个runable消息给它。这里使用协程来执行。
重点需要关注的是processOldHprofFile。
object OOMMonitor : LoopMonitor<OOMMonitorConfig>(), LifecycleEventObserver {private const val TAG = "OOMMonitor"...private fun processOldHprofFile() {MonitorLog.i(TAG, "processHprofFile")if (mHasProcessOldHprof) {return}mHasProcessOldHprof = true;reAnalysisHprof()manualDumpHprof()}...private fun reAnalysisHprof() {for (file in hprofAnalysisDir.listFiles().orEmpty()) {if (!file.exists()) continueif (!file.name.startsWith(MonitorBuildConfig.VERSION_NAME)) {MonitorLog.i(TAG, "delete other version files ${file.name}")file.delete()continue}if (file.canonicalPath.endsWith(".hprof")) {val jsonFile = File(file.canonicalPath.replace(".hprof", ".json"))if (!jsonFile.exists()) {MonitorLog.i(TAG, "create json file and then start service")jsonFile.createNewFile()startAnalysisService(file, jsonFile, "reanalysis")} else {MonitorLog.i(TAG,if (jsonFile.length() == 0L) "last analysis isn't succeed, delete file"else "delete old files", true)jsonFile.delete()file.delete()}}}}private fun manualDumpHprof() {for (hprofFile in manualDumpDir.listFiles().orEmpty()) {MonitorLog.i(TAG, "manualDumpHprof upload:${hprofFile.absolutePath}")monitorConfig.hprofUploader?.upload(hprofFile, OOMHprofUploader.HprofType.STRIPPED)}}}
里面就是操作dump出来的文件,判断当前的版本,假如是旧的,删掉重写等逻辑。
总结
截止到这里,我们开始监控的这两行代码分析完毕:
/** Init OOMMonitor*/OOMMonitorInitTask.INSTANCE.init(JavaLeakTestActivity.this.getApplication());OOMMonitor.INSTANCE.startLoop(true, false,5_000L);很简单的两行代码,里面包含了如此之多的业务逻辑和精彩的设计。
很多时候,我们使用越是简单的开源框架,越是能证明作者的厉害之处。他们把繁杂的逻辑内聚到了框架里面,让使用者能用简单一两行代码实现复杂的逻辑业务。
KOOM作为一个线上内存监控框架,有很多优秀的设计。这篇文章也只是在外层分析了一些表面的技术逻辑,至于更深入的内容,后续会继续更新。