前言:
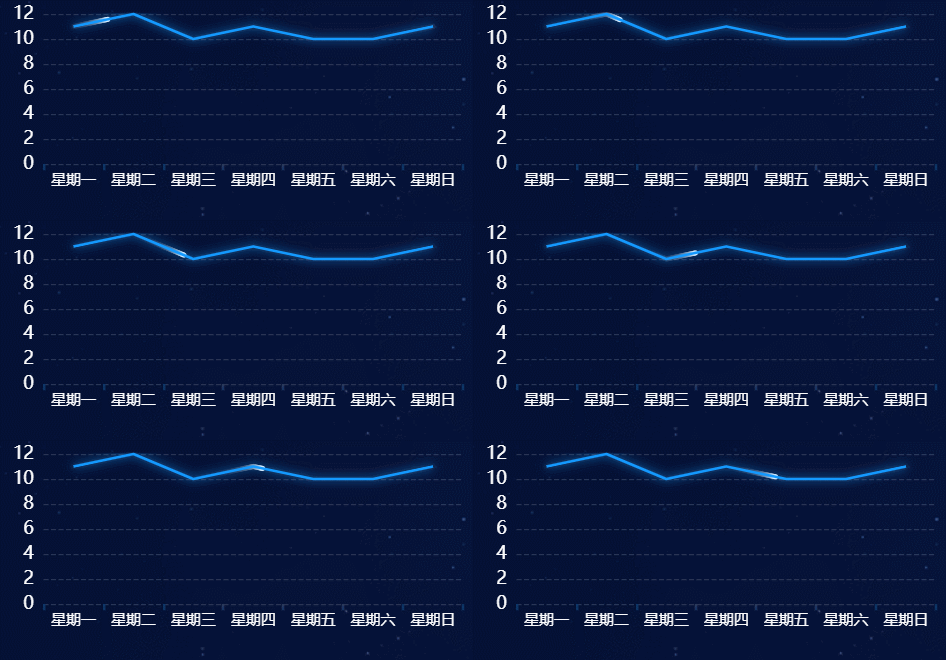
echarts实现炫酷科技感的流光效果
效果图:
实现步骤:
1、引入echarts,直接安装或者cdn引入
npm i echartshttps://cdn.jsdelivr.net/npm/echarts@5.4.3/dist/echarts.min.js2、封装 option方法,第一个数据是折线数据,第二个是流动的点
commonOption(name,xData,yData){let dtList = []xData.forEach((item,i)=>{let arr = []arr.push(item)arr.push(yData[i])dtList[i] = arr})return {title: {text: name,textStyle: {color: "#fff",fontSize: 16,fontWeight: "500",}},"grid": {"containLabel": true,"bottom": "20","top": "40","left": "20","right": "20"},"xAxis": {"triggerEvent": true,"axisLabel": {"show": true,"fontSize": 12,"color": "#fff","align": "center","verticalAlign": "top"},"axisLine": {"show": false},"axisTick": {"show": true,"lineStyle": {"show": true,"color": "#0B3561","width": 2}},"data": xData},"yAxis": [{"axisLabel": {"interval": 0,"show": true,"fontSize": 14,"color": "#fff"},"axisLine": {"show": false},"axisTick": {"show": false},"splitLine": {"lineStyle": {"type": "dashed","color": "rgba(255,255,255,0.15)"}}}],"series": [{"name": "demo1","type": "line","smooth": false,"symbol": "circle","symbolSize": 3,"showSymbol": false,"lineStyle": {"normal": {"width": 2,"shadowColor": "#159AFF","shadowBlur": 8}},"itemStyle": {"normal": {"color": "#159AFF"}},"data": yData},{"name": "demo1","type": "lines","polyline": true,"showSymbol": false,"coordinateSystem": "cartesian2d","effect": {"trailLength": 0.3,"show": true,"period": 6,"symbolSize": 4,"loop": true},"lineStyle": {"color": "#fff","width": 0,"opacity": 0,"curveness": 0,"type": "dashed"},"data": [{"coords": dtList // 动态的图}]}]}},3、然后方法中使用
let myChart = echarts.init(dom);let arr1 = ['星期一', '星期二', '星期三', '星期四', '星期五', '星期六', '星期日']
let arr = [11, 12, 10, 11, 10, 10, 11]
let option = this.commonOption('学员一队',arr1,arr)myChart.setOption(option);
