矢量图
from matplotlib_inline import backend_inline
backend_inline.set_matplotlib_formats('svg')
matplotlib中文问题
import matplotlib.pyplot as plt
plt.rcParams["font.sans-serif"]=["SimHei"] #设置字体
plt.rcParams["axes.unicode_minus"]=False #该语句解决图像中的“-”负号的乱码问题
可见文章Matplotlib中文乱码解决方案(两种方式)
散点矩阵图
import pandas as pd
import mglearn
grr = pd.plotting.scatter_matrix(iris_dataframe, # 要绘制散点矩阵图的特征数据c=y_train, # 指定颜色映射的依据figsize=(15, 15),marker='o',hist_kwds={'bins': 20}, # 直方图分为 20 个区间s=60,alpha=.8, # 透明度cmap=mglearn.cm3) # 设置颜色映射
ROC曲线和AUC值
sklearn.metrics.roc_curve (y_true, y_score, pos_label=None, sample_weight=None, drop_intermediate=True)
- y_true : 数组,形状 = [n_samples],真实标签
- y_score : 数组,形状 = [n_samples],可以是正类样本的概率值,或置信度分数,或decision_function返回的距离
- pos_label : 整数或者字符串, 默认None,表示被认为是正类样本的类别
- sample_weight : 形如 [n_samples]的类数组结构,可不填,表示样本的权重
- drop_intermediate : 布尔值,默认True,如果设置为True,表示会舍弃一些ROC曲线上不显示的阈值点,这对于计算一个比较轻量的ROC曲线来说非常有用
- 这个类返回:FPR,Recall以及阈值。
sklearn.metrics.roc_auc_score (y_true, y_score, average=’macro’, sample_weight=None, max_fpr=None)
输入的参数也比较简单,就是真实标签,和与roc_curve中一致的置信度分数或者概率值。
例1
import numpy as np
from sklearn.metrics import roc_curve, auc
import matplotlib.pyplot as plt# 假设有以下真实标签和预测概率
y_true = np.array([0, 0, 1, 1])
y_scores = np.array([0.1, 0.4, 0.35, 0.8])# 计算ROC曲线的点
fpr, tpr, thresholds = roc_curve(y_true, y_scores)# 计算AUC值
roc_auc = auc(fpr, tpr)# 画ROC曲线
plt.figure()
plt.plot(fpr, tpr, color='darkorange', lw=2, label='ROC curve (area = %0.2f)' % roc_auc)
plt.plot([0, 1], [0, 1], color='navy', lw=2, linestyle='--')
plt.xlim([0.0, 1.0])
plt.ylim([0.0, 1.05])
plt.xlabel('False Positive Rate')
plt.ylabel('True Positive Rate')
plt.title('Receiver Operating Characteristic Example')
plt.legend(loc="lower right")
plt.show()

例2
除了可以用sklearn.metrics.auc这个类来计算AUC面积,也可以使用roc_auc_score这个类。
# 准备数据
import matplotlib.pyplot as plt
from sklearn.datasets import make_blobs
from sklearn.svm import SVC
from sklearn.metrics import roc_curve,roc_auc_scoreclass_1 = 500  #类别1有500个样本。标签为0
class_2 = 50  #类别2只有50个。标签为1
centers = [[0.0, 0.0], [2.0, 2.0]]  #设定两个类别的中心
clusters_std = [1.5, 0.5]  #设定两个类别的标准差,通常来说,样本量比较大的类别会更加松散
X, y = make_blobs(n_samples=[class_1, class_2], centers=centers, cluster_std=clusters_std, random_state=0,shuffle=False)
# X:(550, 2) y:(550,) 有0和1两类# 训练模型
clf_proba = SVC(kernel="linear", C=1.0, probability=True).fit(X, y)
# 这里的thresholds不是概率值,而是距离值中的阈值,所以它可以大于1,也可以小于0
FPR, recall, thresholds = roc_curve(y, clf_proba.decision_function(X), pos_label=1)
auc_score = roc_auc_score(y, clf_proba.decision_function(X))# 绘制图形
plt.figure()
plt.plot(FPR, recall, color='red', label='ROC curve (area = %0.2f)' % auc_score)
plt.plot([0, 1], [0, 1], color='black', linestyle='--')
plt.xlim([-0.05, 1.05])
plt.ylim([-0.05, 1.05])
plt.xlabel('False Positive Rate')
plt.ylabel('Recall')
plt.title('ROC Curve')
plt.legend(loc="lower right")
plt.show()

可见文章(8) 支持向量机(下)(模型评估指标、ROC曲线)
例3
import numpy as np
import matplotlib.pyplot as plt
from sklearn.datasets import make_classification
from sklearn.model_selection import train_test_split
from sklearn.linear_model import LogisticRegression
from sklearn.svm import SVC
from sklearn.ensemble import RandomForestClassifier
from sklearn.metrics import roc_curve, auc# 生成带有噪声的数据集
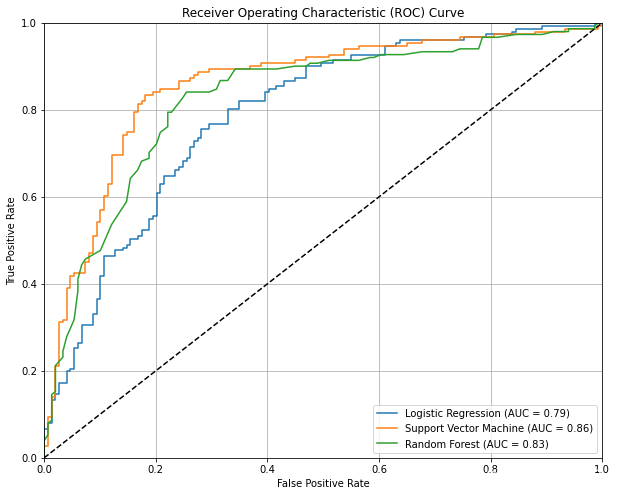
X, y = make_classification(n_samples=1000, n_features=20, n_classes=2, n_informative=10, n_redundant=5, n_clusters_per_class=2, weights=[0.5, 0.5], flip_y=0.3, random_state=42)# 划分训练集和测试集
X_train, X_test, y_train, y_test = train_test_split(X, y, test_size=0.3, random_state=42)# 定义模型
models = {'Logistic Regression': LogisticRegression(max_iter=10000),'Support Vector Machine': SVC(probability=True),'Random Forest': RandomForestClassifier(n_estimators=100)
}# 画ROC曲线
plt.figure(figsize=(10, 8))
for name, model in models.items():model.fit(X_train, y_train)y_prob = model.predict_proba(X_test)[:, 1]  # 获取正类的预测概率fpr, tpr, _ = roc_curve(y_test, y_prob)roc_auc = auc(fpr, tpr)plt.plot(fpr, tpr, label=f'{name} (AUC = {roc_auc:.2f})')plt.plot([0, 1], [0, 1], 'k--')  # 绘制对角线
plt.xlim([0.0, 1.0])
plt.ylim([0.0, 1.0])
plt.xlabel('False Positive Rate')
plt.ylabel('True Positive Rate')
plt.title('Receiver Operating Characteristic (ROC) Curve')
plt.legend(loc='lower right')
plt.grid()
plt.show()
