bmi-calculator
目录
- bmi-calculator
- 初始化项目
- 01大致布局
- 01代码
- 02完善样式
- 02代码
- 03输入信息模块
- 03代码
- 04 使用图表
- 04代码
- 05详细记录信息渲染
- 05代码
- 06 让数据变成响应式的
- 06-1输入框的数据处理
- 06-2图表,和记录信息的区域数据处理
- 07 删除功能,撤销功能
- 删除功能完成
- 撤销功能
- 08 数据持久化、组件化、模块化
- 08-1数据持久化
- 存数据
- 取数据
- Undo 使用本地化数据,不使用useRef()缓存了
- 08-2组件化、模块化
- 08-2-1输入添加模块
- 08-2-2图表模块
- 08-2-3七天数据模块
- 09 修一些bug
学习地址:https://gitee.com/cheng_yong_xu/bmi-calculator-my
源码地址:https://github.com/GermaVinsmoke/bmi-calculator
对于学习react的同学,这是个不错的学习项目,循序渐进, 很多注释
可以学到什么
函数组件
useState, useEffect,useRef
prop-types
materialize-css
react-chartjs-2(折线图)
数据本地存储
模块化,组件化
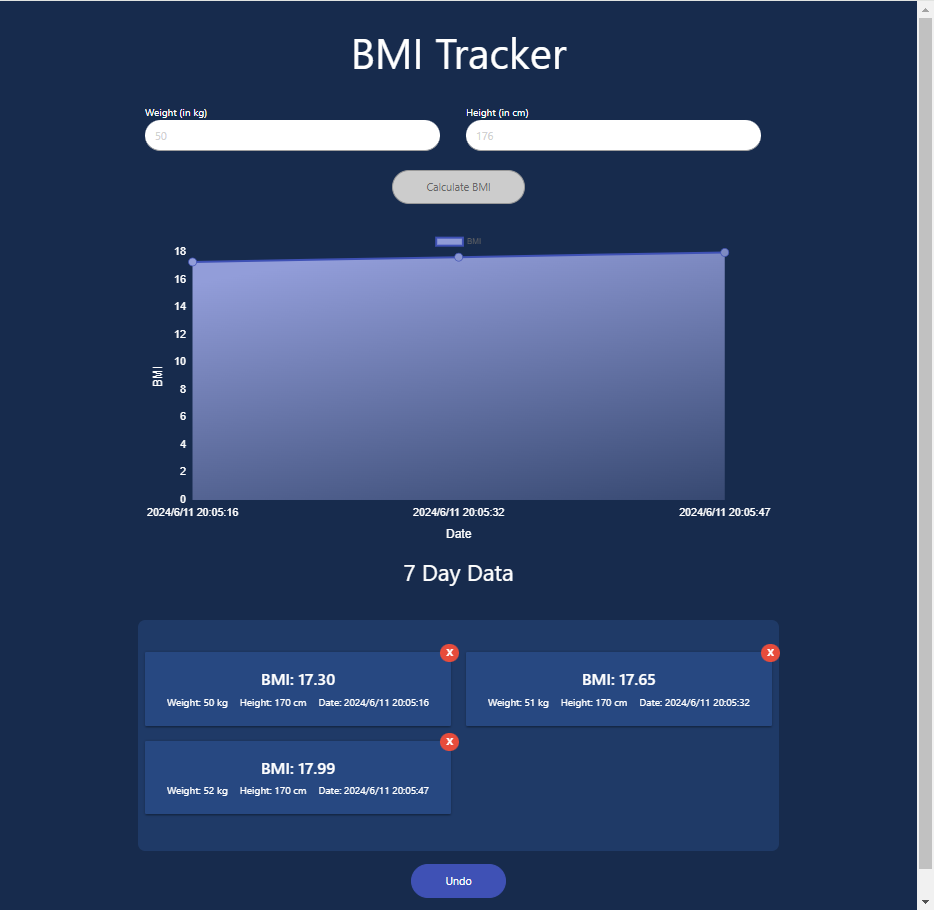
成品效果
初始化项目
第一次提交
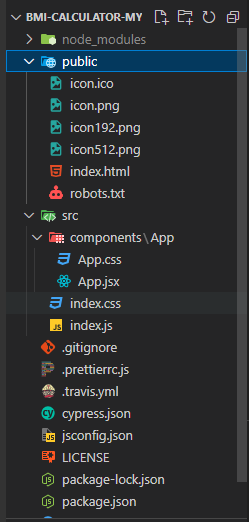
App组件
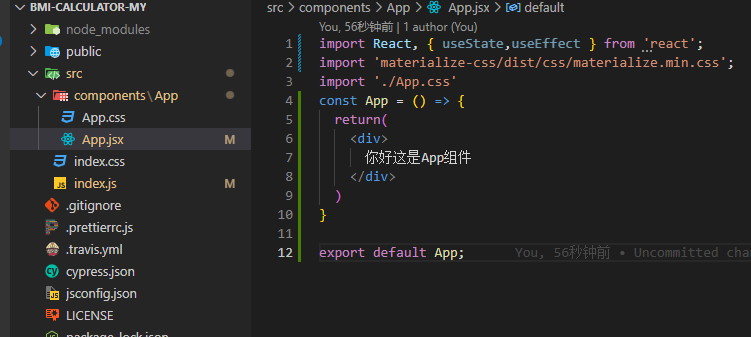
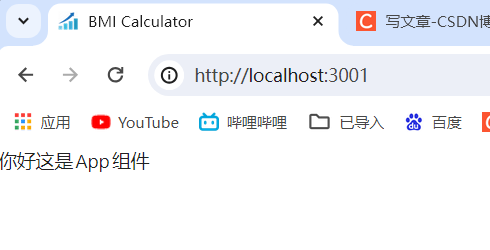
启动
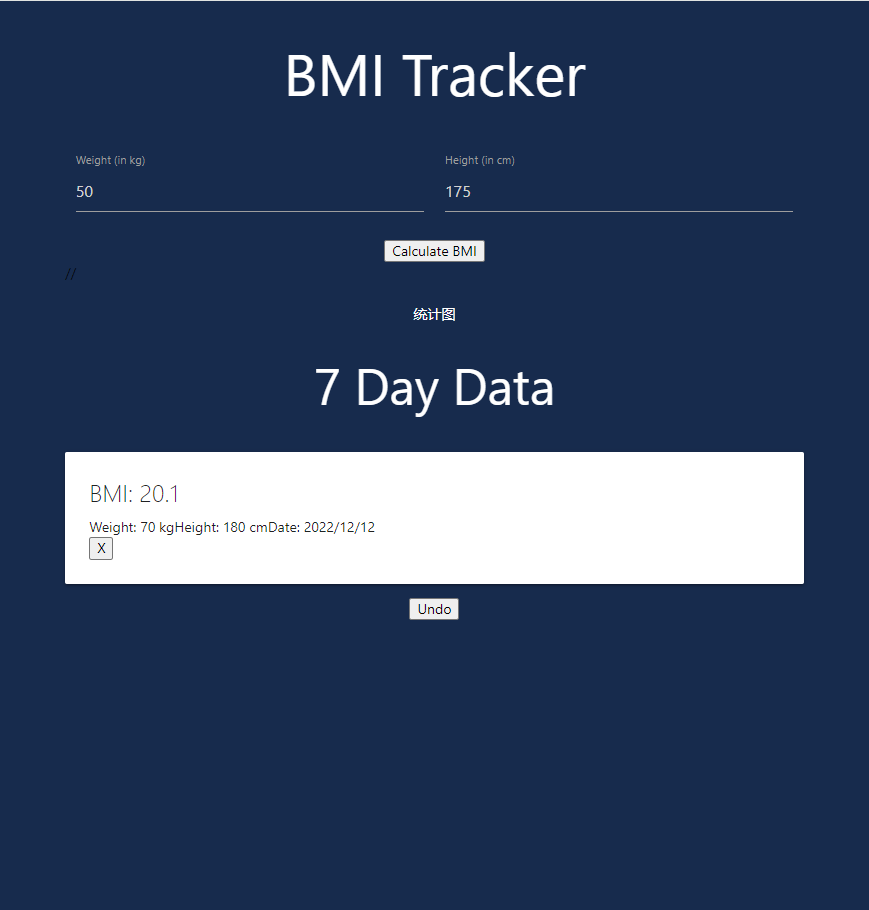
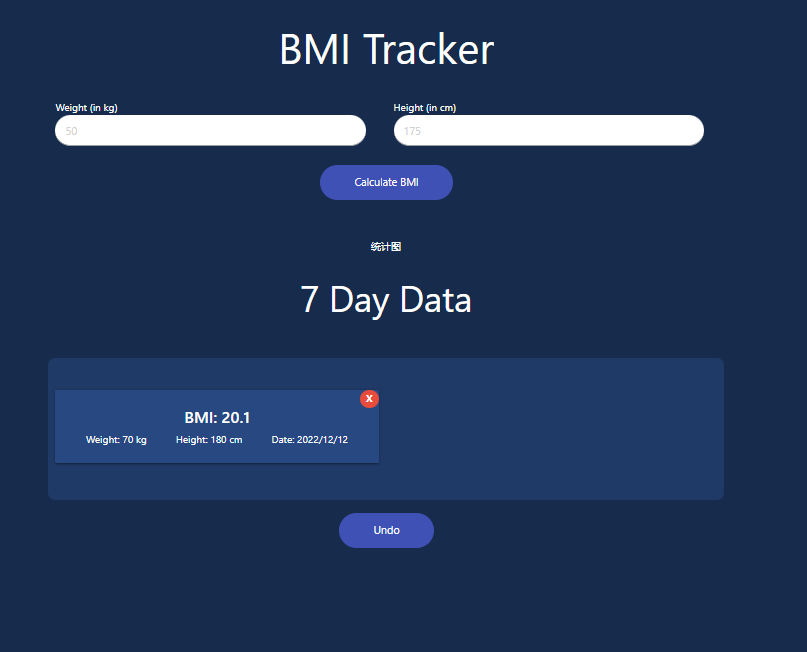
01大致布局
【分支01】
使用了Materialize CSS框架的网格系统(Grid System)来布局页面内容。
01代码
import React, { useState, useEffect } from 'react';
import 'materialize-css/dist/css/materialize.min.css';
import './App.css'
const App = () => {return (<div className='container'>{/* 标题 */}<div className='row center'><h1 className='white-text'>BMI Tracker</h1></div>{/* 输入框 */}<div className='row'><div className='col m12 s12'><div className='row'><div className='col m6 s12'><label htmlFor="weight">Weight (in kg)</label><inputtype="number"id="weight"name="weight"min="1"max="999"placeholder="50"/></div><div className='col m6 s12'><label htmlFor="height">Height (in cm)</label><inputtype="number"id="height"name="height"min="1"max="999"placeholder="175"/></div></div><div className='center'><buttonid="bmi-btn"className="calculate-btn"type="button">Calculate BMI</button></div>{ }</div>
//</div>{/* 统计图 */}<div className='row center white-text'>统计图</div>{/* 详细记录信息 */}<div><div className='row center'><h2 className='white-text'>7 Day Data</h2></div><div me='data-container row'><div className="col m6 s12"><div className="card"><div className="card-content"><span className="card-title" data-test="bmi">BMI: 20.1</span><div className="card-data"><span data-test="weight">Weight: 70 kg</span><span data-test="height">Height: 180 cm</span><span data-test="date">Date: 2022/12/12</span></div><button className="delete-btn">X</button></div></div></div></div></div><div className='center'><button className='calculate-btn'>Undo</button></div></div>)
}export default App;
02完善样式
【分支02】
02代码
body{background-color: #172B4D;
}
/* .center h1 {color: #fff;
} */input {background-color: #fff !important;border-radius: 44px !important;width: 90% !important;padding: 0px 15px !important;
}input:focus {border-bottom: none !important;box-shadow: none !important;
}label {display: block;color: #fff !important;font-size: 1rem !important;
}.calculate-btn{background-color: #3f51b5;padding: 15px 50px;color: white;font-size: 16px;border-radius: 44px;cursor: pointer;border: 1px solid #3f51b5;margin-bottom: 40px;transform: translate3d(0, 0, 0);transition: all 0.2s ease;
}.calculate-btn:hover {background-color: #fff;transform: translate(0px, -2px);color: #5364c3;box-shadow: 0px 15px 30px -12px rgba(255, 255, 255, 0.2);
}.calculate-btn:focus {background-color: #32408f;
}.calculate-btn:focus:hover {color: white;
}.calculate-btn:disabled {border: 1px solid #999999;background-color: #cccccc;color: #666666;cursor: default;
}.calculate-btn:disabled:hover {box-shadow: none;transform: translate(0, 0);
}.data-container {background-color: #1f3a67;border-radius: 11px;margin-top: 40px;padding-top: 40px;padding-bottom: 40px;
}.card{background-color: #274881 !important;color: white;
}.card-title {font-weight: 500 !important;text-align: center;
}.card-data {display: flex;justify-content: space-around;
}.delete-btn {background-color: #e74c3c;color: white;border: none;border-radius: 50%;font-weight: 700;padding: 5px 9px;cursor: pointer;position: absolute;top: 0;right: 0;}
.delete-btn:focus {background-color: #e74c3c;
}
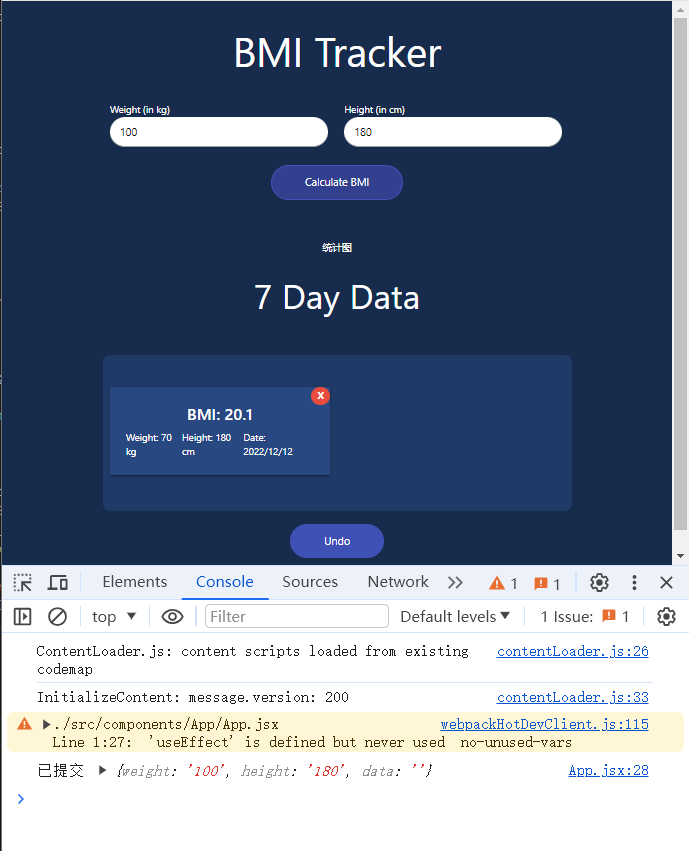
03输入信息模块
【分支03】
1.定义数据
2.定义,初始化数据状态
3.input 改变时,更新数据(受控组件)
4.提交数据
03代码
// src\components\App\App.jsx
import React, { useState, useEffect } from 'react';
import 'materialize-css/dist/css/materialize.min.css';
import './App.css'// 定义数据
const initialValues = {weight: '100',height: '180',data: ''
}const App = () => {// 定义,初始化数据状态const [state, setState] = useState(initialValues)// input 改变时,更新数据const handleChange = e => {let { value, name } = e.target;setState({...state,[name]: value,})}// 提交数据const handleSubmit = e => {setState(initialValues)console.log('已提交', state)}return (<div className='container'>{/* 标题 */}<div className='row center'><h1 className='white-text'>BMI Tracker</h1></div>{/* 输入框 */}<div className='row'><div className='col m12 s12'><div className='row'><div className='col m6 s12'><label htmlFor="weight">Weight (in kg)</label><inputtype="number"id="weight"name="weight"min="1"max="999"placeholder="50"value={state.weight}onChange={handleChange}/></div><div className='col m6 s12'><label htmlFor="height">Height (in cm)</label><inputtype="number"id="height"name="height"min="1"max="999"placeholder="175"value={state.height}onChange={handleChange}/></div></div><div className='center'><buttonid="bmi-btn"className="calculate-btn"type="button"disabled={!state.weight || !state.height}onClick={handleSubmit}>Calculate BMI</button></div>{ }</div></div>{/* 统计图 */}<div className='row center white-text'>统计图</div>{/* 详细记录信息 */}<div><div className='row center'><h2 className='white-text'>7 Day Data</h2></div><div className='data-container row'><div className="col m6 s12"><div className="card"><div className="card-content"><span className="card-title" data-test="bmi">BMI: 20.1</span><div className="card-data"><span data-test="weight">Weight: 70 kg</span><span data-test="height">Height: 180 cm</span><span data-test="date">Date: 2022/12/12</span></div><button className="delete-btn">X</button></div></div></div></div></div><div className='center'><button className='calculate-btn'>Undo</button></div></div>)
}export default App;
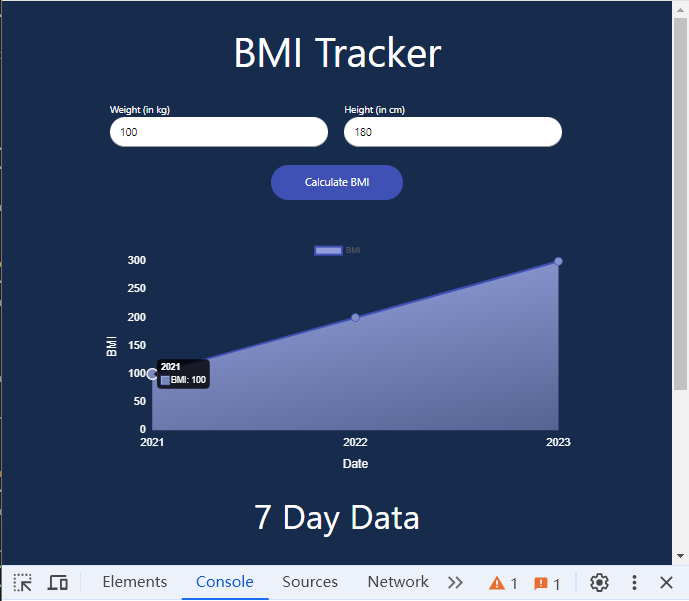
04 使用图表
chartjs:https://www.chartjs.org/docs/latest/
react-chartjs-2:https://react-chartjs-2.js.org/
主要知道react-chartjs-2怎么使用
【04分支】
04代码
// src\components\App\App.jsx
import React, { useState, useEffect } from 'react';
import { Line } from 'react-chartjs-2';
import 'materialize-css/dist/css/materialize.min.css';
import './App.css'// 定义数据
const initialValues = {weight: '100',height: '180',data: ''
}const App = () => {// 定义,初始化数据状态const [state, setState] = useState(initialValues)// input 改变时,更新数据const handleChange = e => {let { value, name } = e.target;setState({...state,[name]: value,})}// 提交数据const handleSubmit = e => {setState(initialValues)console.log('已提交', state)}const labelData = [2021,2022,2023]const bmiData = [100,200,300]// 定义图标数据const data = canvas => {// 从传入的canvas元素中获取2D绘图上下文,这是在canvas上绘制图形的基础。// 这段代码创建了一个线性渐变对象,起始于坐标(63, 81),结束于(181, 700),颜色从#929dd9渐变到#172b4d。这常用于为图表的填充色提供动态效果。const ctx = canvas.getContext("2d");const gradient = ctx.createLinearGradient(63, 81, 181, 700);gradient.addColorStop(0, '#929dd9');gradient.addColorStop(1, '#172b4d');return{labels: labelData,  // 图表的标签数组,通常对应X轴的各个分类datasets: [  // 一个数据集对象{label: 'BMI',  // 数据集的标签,通常用于图例data: bmiData,  // 数据集的实际数值数组,对应Y轴的值。backgroundColor: gradient,  // 使用之前创建的gradient作为填充色。borderColor: '#3F51B5',  // 数据点的边框颜色为#3F51B5。pointRadius: 6,  // 数据点的半径为6。pointHoverRadius: 8,  // 鼠标悬停时数据点的半径增大到8。pointHoverBorderColor: 'white',  // 鼠标悬停时数据点边框颜色变为白色。pointHoverBorderWidth: 2  // 鼠标悬停时数据点边框宽度为2。}]}
}// options 该对象包含了配置信息,主要用来定制基于Chart.js库的图表外观和行为const options = {responsive: true, // 设置图表是否应响应式scales: { //定义图表的坐标轴配置,包括x轴(xAxes)和y轴(yAxes)的样式和行为xAxes: [{scaleLabel: {display: true,labelString: 'Date',fontSize: 18,fontColor: 'white'},gridLines: {display: false,color: 'white'},ticks: {fontColor: 'white',fontSize: 16}}],yAxes: [{scaleLabel: { //  x轴标题的配置。display: true,  // 是否显示x轴标题labelString: 'BMI',  // x轴标题的文本内容fontSize: 18,  // 标题的字体大小和颜色fontColor: 'white'},gridLines: {  // 网格线的配置display: false,  // 不显示x轴的网格线color: 'white'  // 格线的颜色,即使不显示也定义了颜色},ticks: {  // 刻度线的配置fontColor: 'white', // 刻度线标签的字体颜色和大小。fontSize: 16,beginAtZero: true   // 图表的y轴刻度从0开始}}]},tooltips: { // 定义图表提示框(tooltip)的样式。// 分别设置提示框标题和内容的字体大小。titleFontSize: 13,bodyFontSize: 13}}return (<div className='container'>{/* 标题 */}<div className='row center'><h1 className='white-text'>BMI Tracker</h1></div>{/* 输入框 */}<div className='row'><div className='col m12 s12'><div className='row'><div className='col m6 s12'><label htmlFor="weight">Weight (in kg)</label><inputtype="number"id="weight"name="weight"min="1"max="999"placeholder="50"value={state.weight}onChange={handleChange}/></div><div className='col m6 s12'><label htmlFor="height">Height (in cm)</label><inputtype="number"id="height"name="height"min="1"max="999"placeholder="175"value={state.height}onChange={handleChange}/></div></div><div className='center'><buttonid="bmi-btn"className="calculate-btn"type="button"disabled={!state.weight || !state.height}onClick={handleSubmit}>Calculate BMI</button></div>{ }</div></div>{/* 统计图 */}<div className='row center white-text'>{/* 使用折线图 */}<Line data={data} options={options}/></div>{/* 详细记录信息 */}<div><div className='row center'><h2 className='white-text'>7 Day Data</h2></div><div className='data-container row'><div className="col m6 s12"><div className="card"><div className="card-content"><span className="card-title" data-test="bmi">BMI: 20.1</span><div className="card-data"><span data-test="weight">Weight: 70 kg</span><span data-test="height">Height: 180 cm</span><span data-test="date">Date: 2022/12/12</span></div><button className="delete-btn">X</button></div></div></div></div></div><div className='center'><button className='calculate-btn'>Undo</button></div></div>)
};
export default App;
解释
const data = canvas => {const ctx = canvas.getContext('2d');const gradient = ctx.createLinearGradient(63, 81, 181, 700);gradient.addColorStop(0, '#929dd9');gradient.addColorStop(1, '#172b4d');return {labels: labelData,datasets: [{label: 'BMI',data: bmiData,backgroundColor: gradient,borderColor: '#3F51B5',pointRadius: 6,pointHoverRadius: 8,pointHoverBorderColor: 'white',pointHoverBorderWidth: 2}]};};
这段JavaScript代码定义了一个名为data的函数,它接收一个canvas元素作为参数,并返回一个配置对象,该对象常用于初始化或更新基于Chart.js(或其他类似图表库)的图表数据和样式。下面是代码的详细解释:
- 获取2D渲染上下文:
javascriptconst ctx = canvas.getContext('2d');
这行代码从传入的canvas元素中获取2D绘图上下文,这是在canvas上绘制图形的基础。
- 创建线性渐变:
javascript const gradient = ctx.createLinearGradient(63, 81, 181, 700);gradient.addColorStop(0, '#929dd9');gradient.addColorStop(1, '#172b4d');
这段代码创建了一个线性渐变对象,起始于坐标(63, 81),结束于(181, 700),颜色从#929dd9渐变到#172b4d。这常用于为图表的填充色提供动态效果。
-
- 返回图表配置对象
- 返回的对象结构定义了图表的数据和样式,主要包括:
-
labels:
labelData,图表的标签数组,通常对应X轴的各个分类。 -
- datasets
- 包含一个数据集对象,具体定义为:
- label:
'BMI',数据集的标签,通常用于图例。 - data:
bmiData,数据集的实际数值数组,对应Y轴的值。 - backgroundColor: 使用之前创建的
gradient作为填充色。 - borderColor: 数据点的边框颜色为
#3F51B5。 - pointRadius: 数据点的半径为6。
- pointHoverRadius: 鼠标悬停时数据点的半径增大到8。
- pointHoverBorderColor: 鼠标悬停时数据点边框颜色变为白色。
- pointHoverBorderWidth: 鼠标悬停时数据点边框宽度为2。
综上所述,这个函数用于生成一个配置对象,配置了一种特定样式的图表,其中数据填充色为线性渐变,适合于展示BMI(身体质量指数)等相关数据的图表展示。
options的对象,该对象包含了配置信息,主要用来定制基于Chart.js库的图表外观和行为。具体配置项解释如下:
-
responsive: true: 设置图表是否应响应式,即图表是否会根据其容器的大小自动调整。
-
scales: 定义图表的坐标轴配置,包括x轴(xAxes)和y轴(yAxes)的样式和行为。
-
xAxes: 配置x轴的设置。
-
- scaleLabel
- x轴标题的配置。
- display: true: 是否显示x轴标题。
- labelString: ‘Date’: x轴标题的文本内容。
- fontSize: 18 和 fontColor: ‘white’: 标题的字体大小和颜色。
-
- gridLines
- 网格线的配置。
- display: false: 不显示x轴的网格线。
- color: ‘white’: 网格线的颜色,即使不显示也定义了颜色。
-
- ticks
- 刻度线的配置。
- fontColor: ‘white’ 和 fontSize: 16: 刻度线标签的字体颜色和大小。
-
-
yAxes: 配置y轴的设置,结构和配置项含义与x轴相似,但多了beginAtZero: true,表示y轴的刻度应该从0开始。
-
-
tooltips: 定义图表提示框(tooltip)的样式。
- titleFontSize: 13 和 bodyFontSize: 13: 分别设置提示框标题和内容的字体大小。
整体而言,这段代码详细地定制了一个图表的外观,包括坐标轴的标题、网格线、刻度线的样式,以及提示框的字体大小,使得图表更加符合特定的视觉需求,比如使用白色字体适应深色背景等。
05详细记录信息渲染
【05分支】
1.完整信息数据列表
硬编码,编写两组数据
2.完整信息数据列表渲染到图表
3.详细记录信息渲染
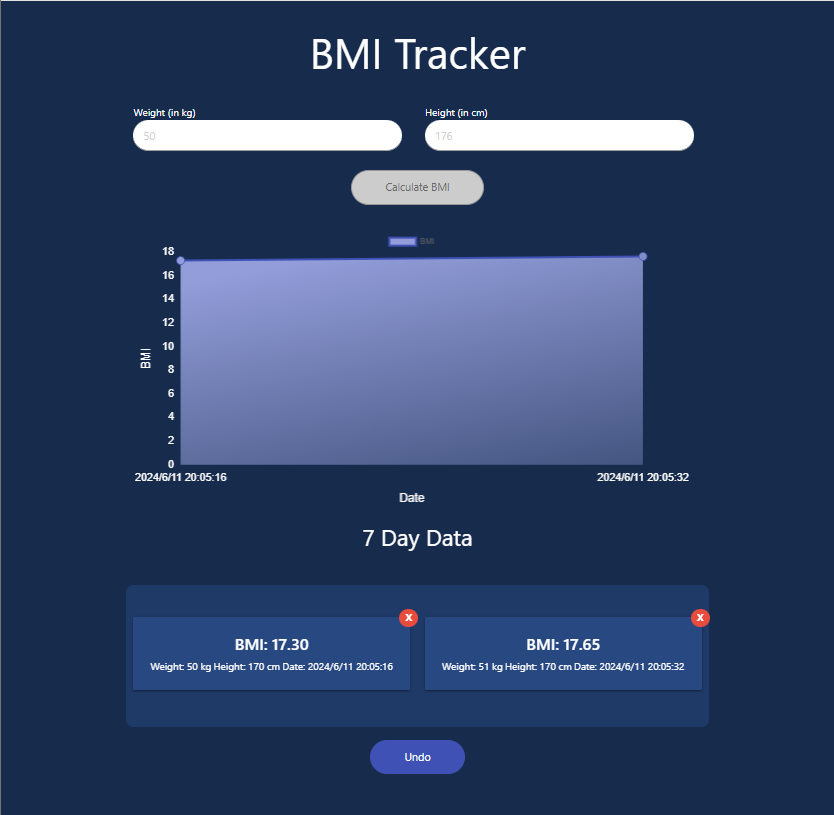
现在和设计稿已经一样了,
05代码
// src\components\App\App.jsx
import React, { useState, useEffect } from 'react';
import { Line } from 'react-chartjs-2';
import 'materialize-css/dist/css/materialize.min.css';
import './App.css'// 定义数据
const initialValues = {weight: '100',height: '180',data: ''
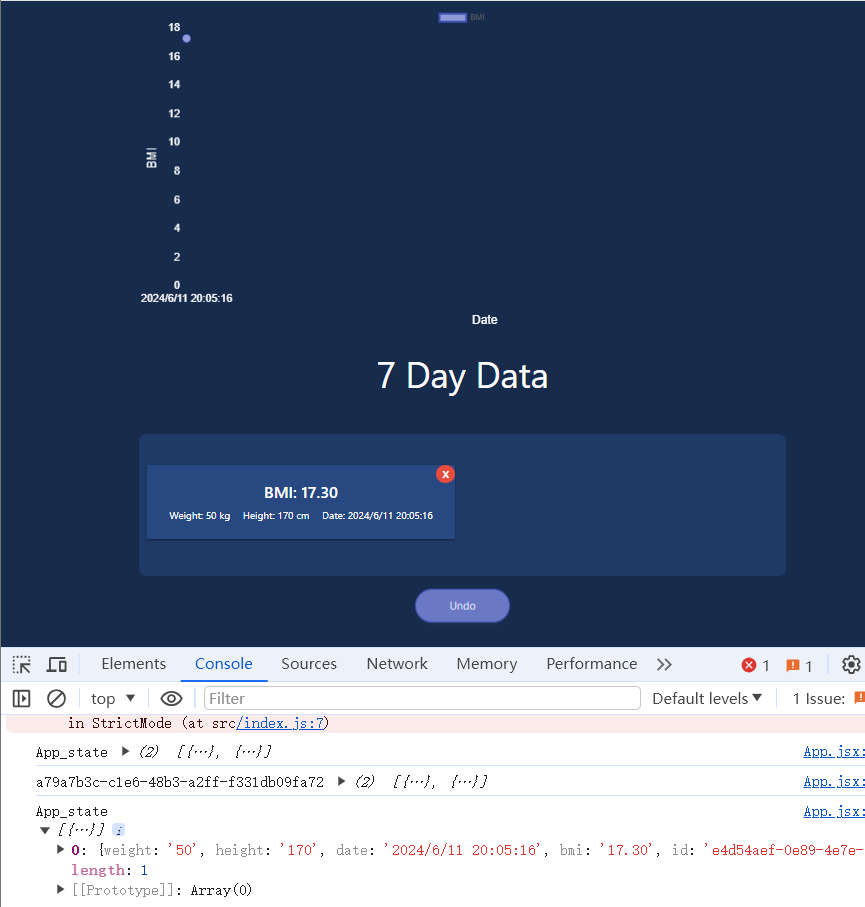
}// 完整信息数据列表
const stateS = [{ "weight": "50", "height": "170", "date": "2024/6/11 20:05:16", "bmi": "17.30", "id": "e4d54aef-0e89-4e7e-a887-9d7a289da5de" },{ "weight": "51", "height": "170", "date": "2024/6/11 20:05:32", "bmi": "17.65", "id": "a79a7b3c-c1e6-48b3-a2ff-f331db09fa72" }
]const App = () => {// 定义,初始化数据状态const [state, setState] = useState(initialValues)// input 改变时,更新数据const handleChange = e => {let { value, name } = e.target;setState({...state,[name]: value,})}// 提交数据const handleSubmit = e => {setState(initialValues)console.log('已提交', state)}// 交给图表 显示数据const labelData = stateS.map(item => item.date)const bmiData = stateS.map(item => item.bmi)// 定义图标数据const data = canvas => {// 从传入的canvas元素中获取2D绘图上下文,这是在canvas上绘制图形的基础。// 这段代码创建了一个线性渐变对象,起始于坐标(63, 81),结束于(181, 700),颜色从#929dd9渐变到#172b4d。这常用于为图表的填充色提供动态效果。const ctx = canvas.getContext("2d");const gradient = ctx.createLinearGradient(63, 81, 181, 700);gradient.addColorStop(0, '#929dd9');gradient.addColorStop(1, '#172b4d');return {labels: labelData, // 图表的标签数组,通常对应X轴的各个分类datasets: [ // 一个数据集对象{label: 'BMI', // 数据集的标签,通常用于图例data: bmiData, // 数据集的实际数值数组,对应Y轴的值。backgroundColor: gradient, // 使用之前创建的gradient作为填充色。borderColor: '#3F51B5', // 数据点的边框颜色为#3F51B5。pointRadius: 6, // 数据点的半径为6。pointHoverRadius: 8, // 鼠标悬停时数据点的半径增大到8。pointHoverBorderColor: 'white', // 鼠标悬停时数据点边框颜色变为白色。pointHoverBorderWidth: 2 // 鼠标悬停时数据点边框宽度为2。}]}}// options 该对象包含了配置信息,主要用来定制基于Chart.js库的图表外观和行为const options = {responsive: true, // 设置图表是否应响应式scales: { //定义图表的坐标轴配置,包括x轴(xAxes)和y轴(yAxes)的样式和行为xAxes: [{scaleLabel: {display: true,labelString: 'Date',fontSize: 18,fontColor: 'white'},gridLines: {display: false,color: 'white'},ticks: {fontColor: 'white',fontSize: 16}}],yAxes: [{scaleLabel: { // x轴标题的配置。display: true, // 是否显示x轴标题labelString: 'BMI', // x轴标题的文本内容fontSize: 18, // 标题的字体大小和颜色fontColor: 'white'},gridLines: { // 网格线的配置display: false, // 不显示x轴的网格线color: 'white' // 格线的颜色,即使不显示也定义了颜色},ticks: { // 刻度线的配置fontColor: 'white', // 刻度线标签的字体颜色和大小。fontSize: 16,beginAtZero: true // 图表的y轴刻度从0开始}}]},tooltips: { // 定义图表提示框(tooltip)的样式。// 分别设置提示框标题和内容的字体大小。titleFontSize: 13,bodyFontSize: 13}}return (<div className='container'>{/* 标题 */}<div className='row center'><h1 className='white-text'>BMI Tracker</h1></div>{/* 输入框 */}<div className='row'><div className='col m12 s12'><div className='row'><div className='col m6 s12'><label htmlFor="weight">Weight (in kg)</label><inputtype="number"id="weight"name="weight"min="1"max="999"placeholder="50"value={state.weight}onChange={handleChange}/></div><div className='col m6 s12'><label htmlFor="height">Height (in cm)</label><inputtype="number"id="height"name="height"min="1"max="999"placeholder="175"value={state.height}onChange={handleChange}/></div></div><div className='center'><buttonid="bmi-btn"className="calculate-btn"type="button"disabled={!state.weight || !state.height}onClick={handleSubmit}>Calculate BMI</button></div>{ }</div></div>{/* 统计图 */}<div className='row center white-text'>{/* 使用折线图 */}<Line data={data} options={options} /></div>{/* 详细记录信息 */}<div><div className='row center'><h2 className='white-text'>7 Day Data</h2></div><div className='data-container row'>{stateS.length > 0 ? (<>{stateS.map(info => (<div className="col m6 s12"><div className="card"><div className="card-content"><span className="card-title" data-test="bmi">BMI: {info.bmi}</span><div className="card-data"><span data-test="weight">Weight: {info.weight} kg</span><span data-test="height">Height: {info.height} cm</span><span data-test="date">Date: {info.date}</span></div><button className="delete-btn">X</button></div></div></div>))}</>) : (<div className='center white-text'>No log found</div>)}</div></div><div className='center'><button className='calculate-btn'>Undo</button></div></div>)
};
export default App;
06 让数据变成响应式的
06-1输入框的数据处理
【06-1分支】
问题
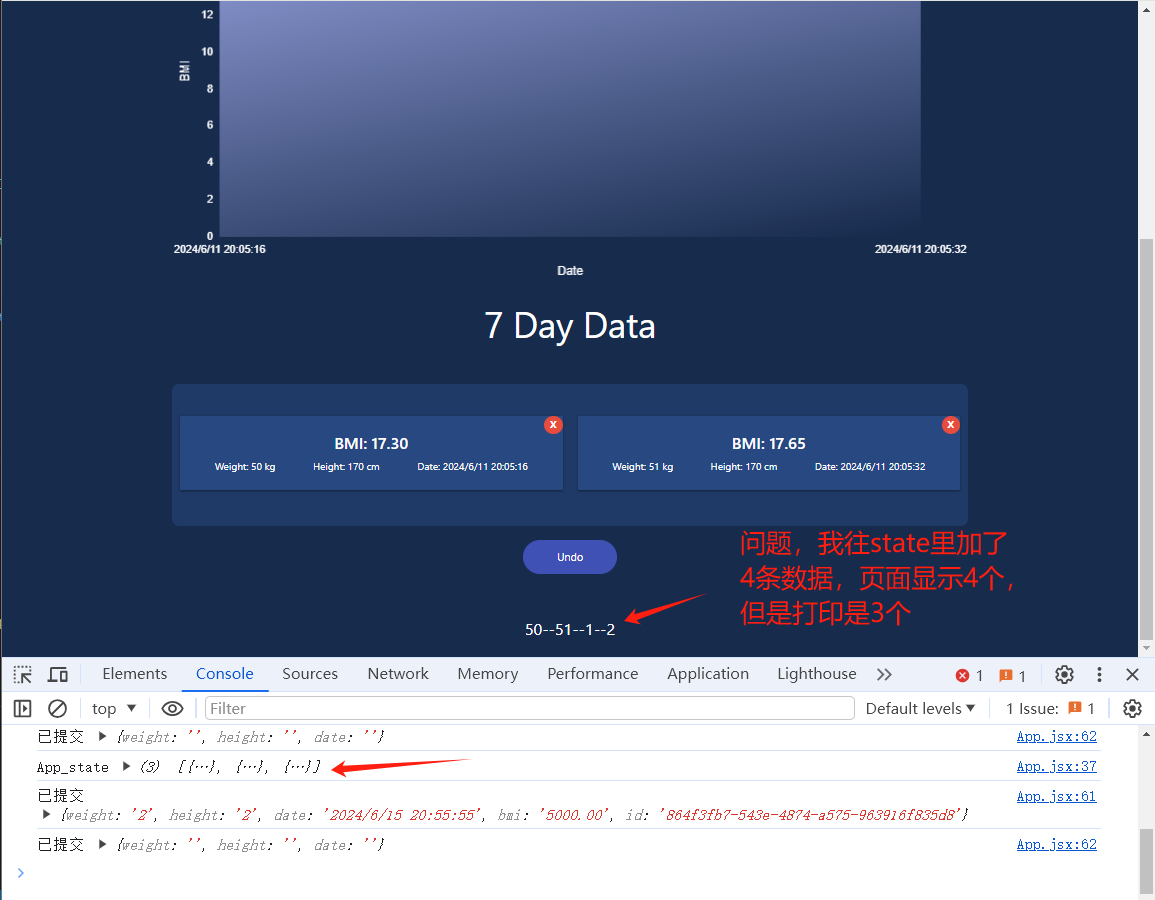
问题代码
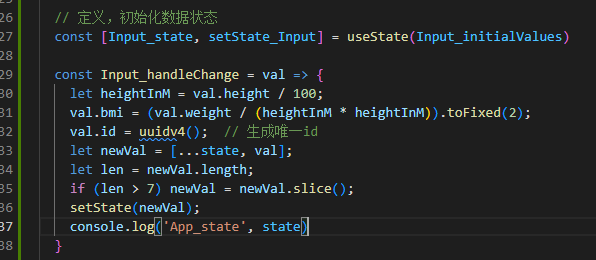
解决
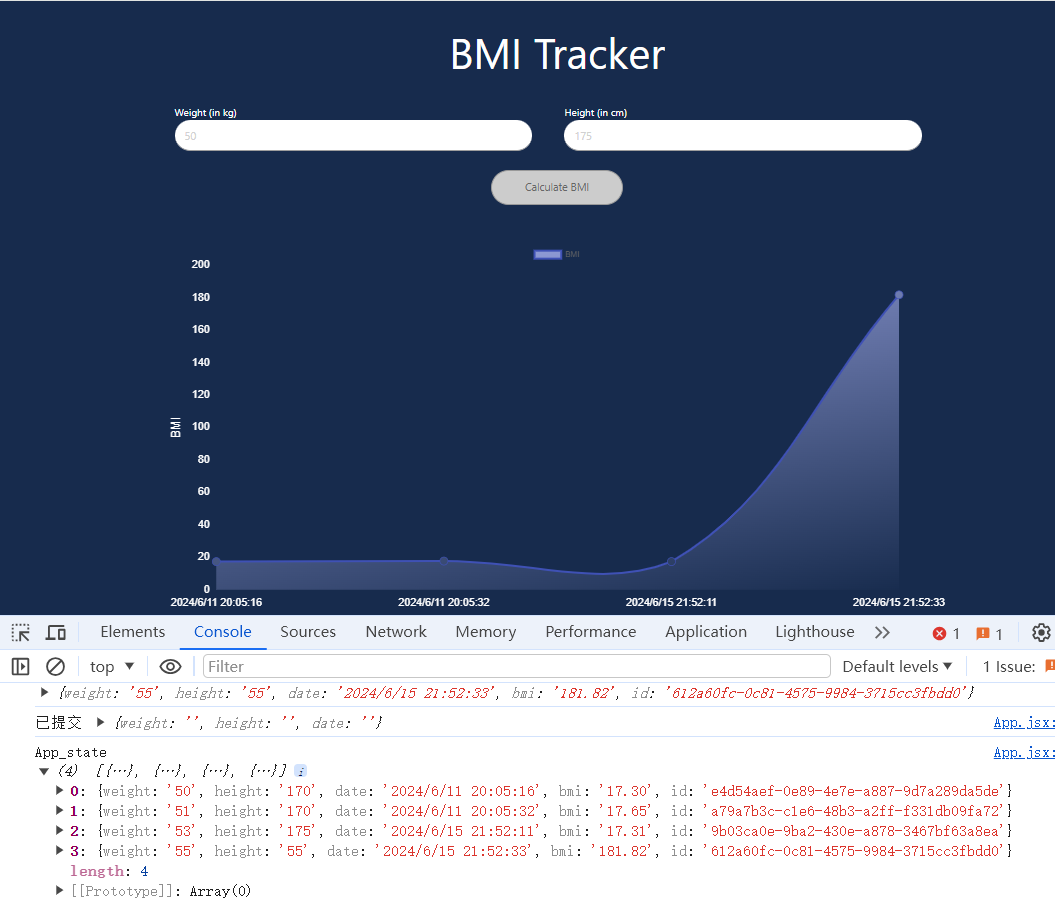
每次state变化,都会触发更新
我们在体重,身高输入框,输入
53,175
会往state状态里插入,如下的的一条数据
{weight: '53', height: '175', date: '2024/6/15 21:40:24', bmi: '17.31', id: 'f83452b5-a7b5-4a57-beb1-ea552bf432cb'}
接在下来,我们的图表,和记录信息的区域,都显示这些数据
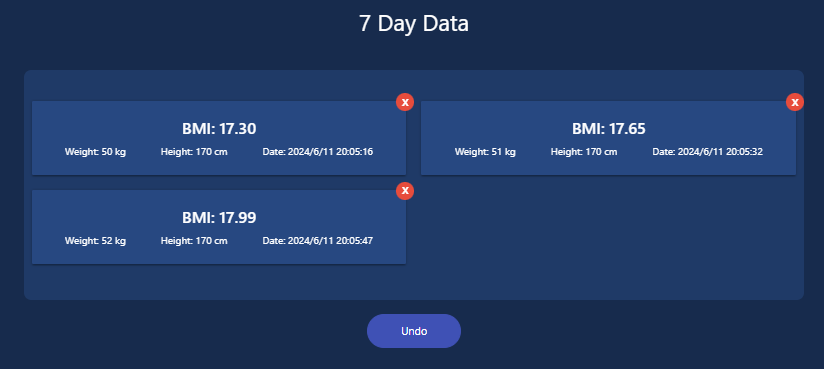
06-2图表,和记录信息的区域数据处理
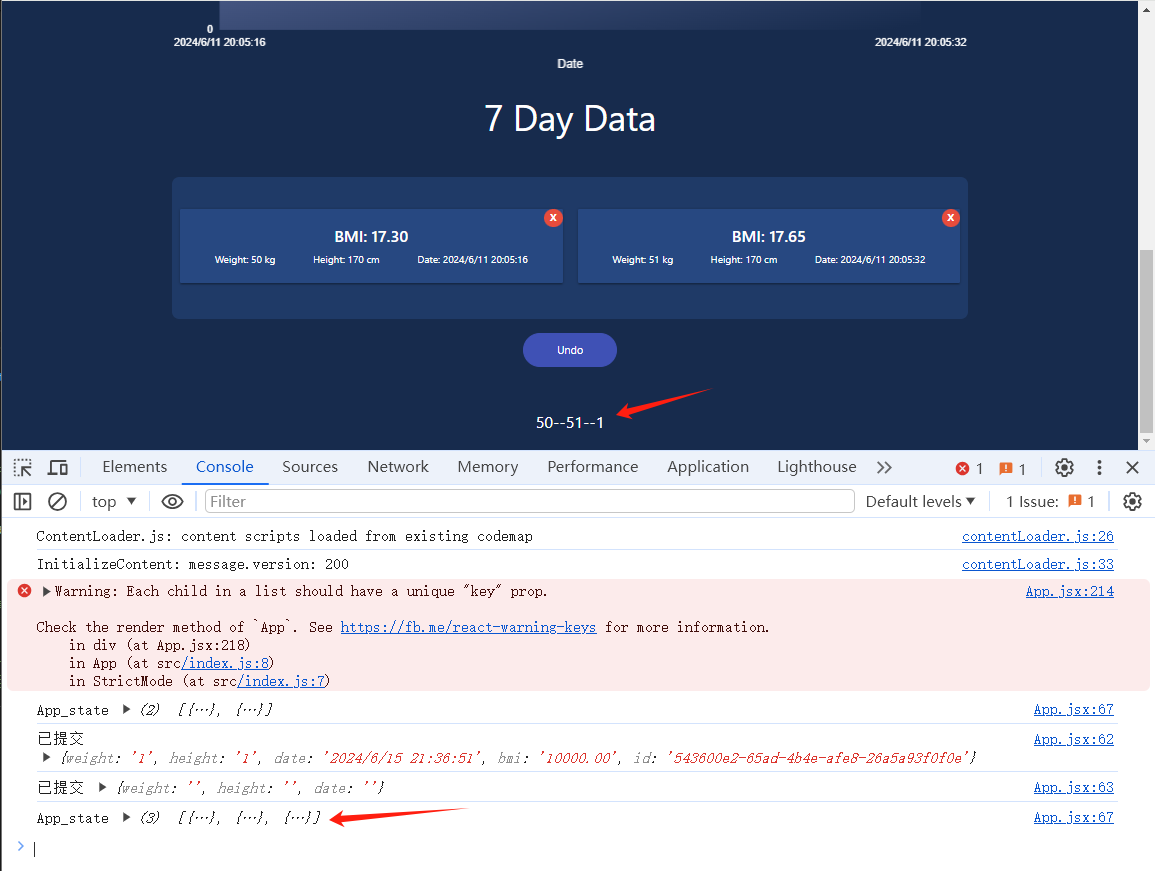
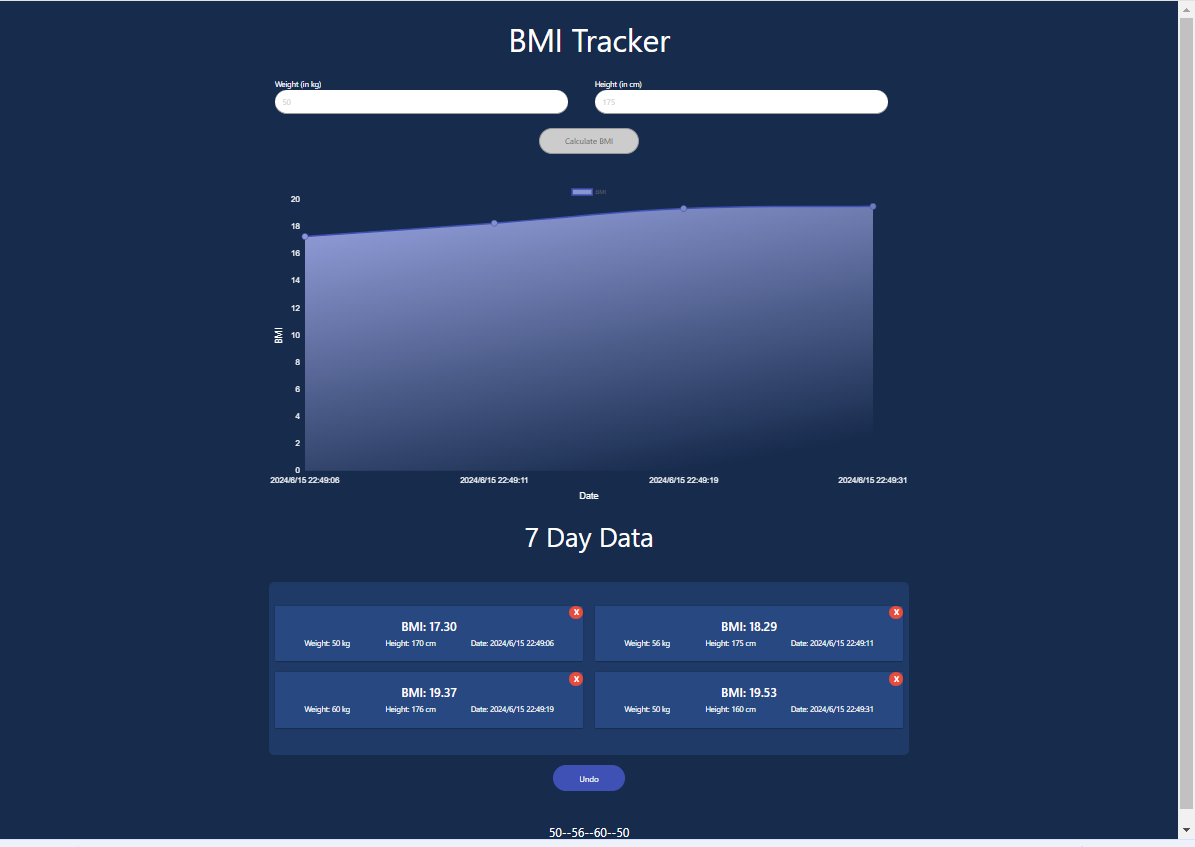
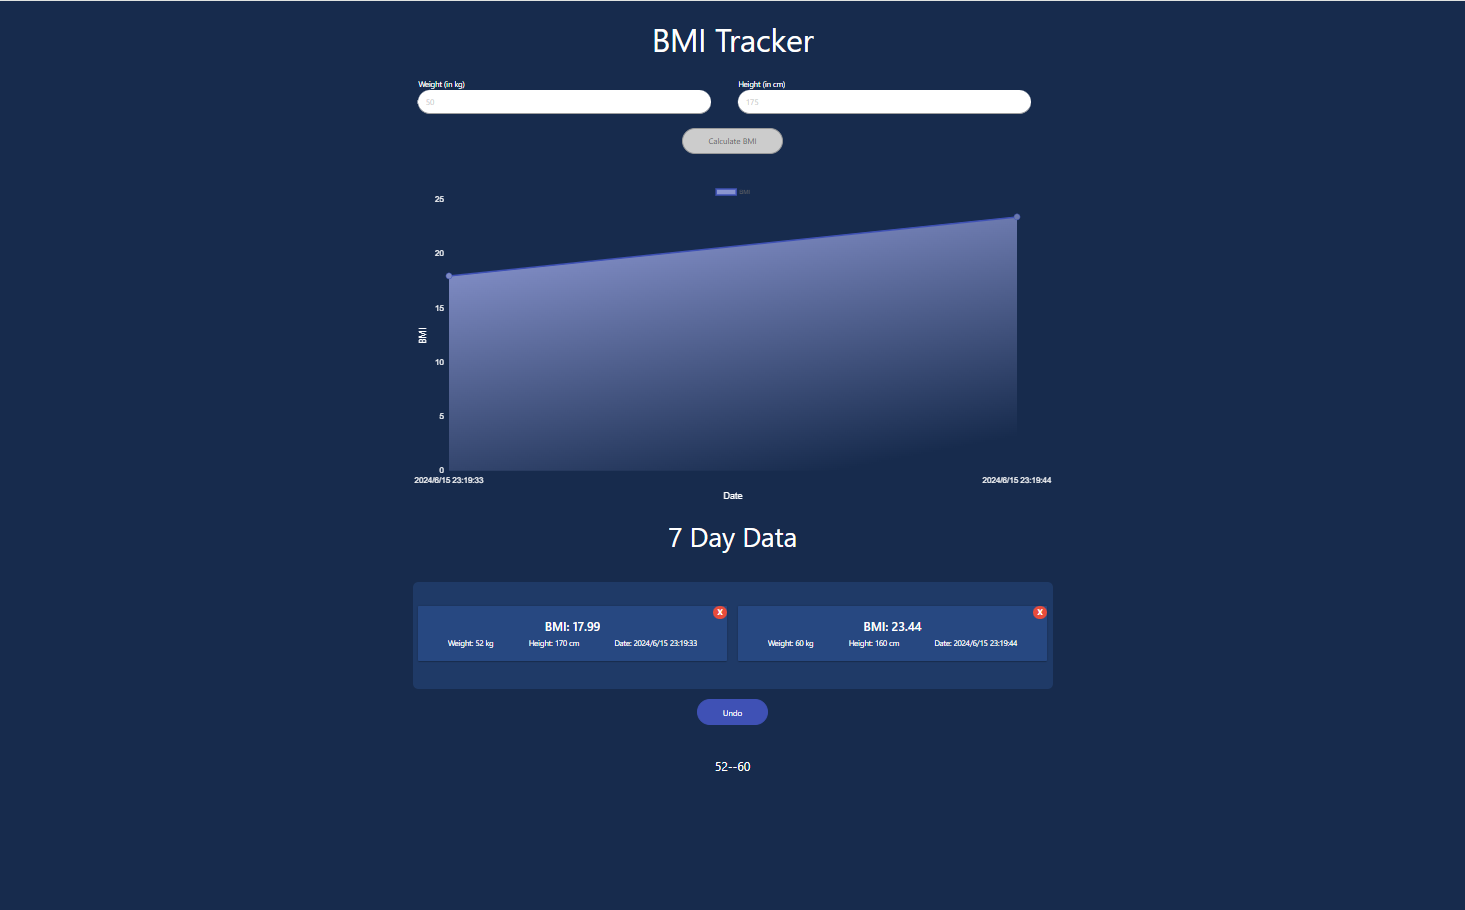
state有几条数据就显示几条
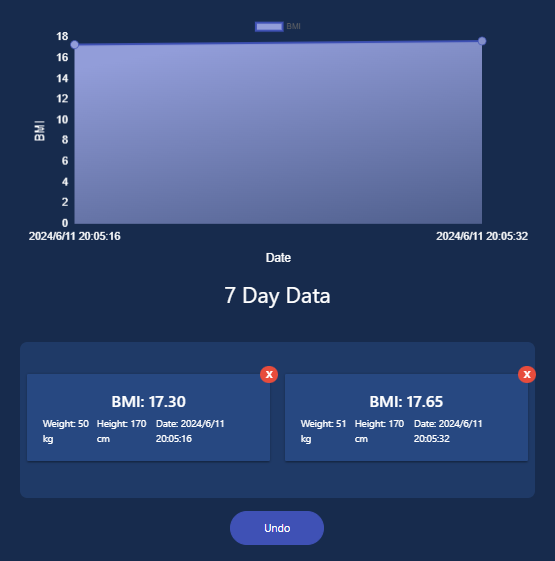
07 删除功能,撤销功能
点击x删除对应数据
点击Undo撤销上一步操作(如果上一步是点击x删除对应数据,那么Undo就是回复上一步;如果上一步是添加里一条数据,那么Undo就是删除新添加的这条数据 )
删除功能完成
撤销功能
思路就是所在点击删除后,第一件事就是先保存一份最新的state
// let lastState // 注意这个地方,如只是一般的变量,那么每次setState(lastState),渲染的时候handleUndo函数都会从新执行,一直在初始化lastState,所以需要使用useReflet lastState = useRef([])const deleteCard = (id) => {lastState.current = state.slice();let newState = state.filter(item => item.id !== id)setState(newState)// console.log(id,state)// console.log(lastState.current)}const handleUndo = () => {// setState(lastState);setState(lastState.current);// console.log(lastState.current , state)}
到目前位置,我们所有的功能都已完成
08 数据持久化、组件化、模块化
目前我们我们把这个小应用全部写在了一个文件里,这样文件会显得臃肿,庞大,混乱难以维护。当等功能增多的时候就会,更加庞大,混乱。
所以我们接下来要拆分这个组件,分成一个个小的组件。
现在我们的数据在缓存里,刷新就会丢失。所以我们将数据持久化到本地,关闭浏览器也不会丢失。
08-1数据持久化
【分支08-1】
写一个将数据存储到本地,从本地获取的数据的模块
// src\helpers\localStorage.js
export const getData = (key) => {if (!localStorage) return;try {return JSON.parse(localStorage.getItem(key));} catch (err) {console.error(`Error getting item ${key} from localStorage`, err);}
};export const storeData = (key, item) => {if (!localStorage) return;try {return localStorage.setItem(key, JSON.stringify(item));} catch (err) {console.error(`Error storing item ${key} to localStorage`, err);}
};
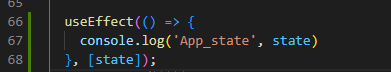
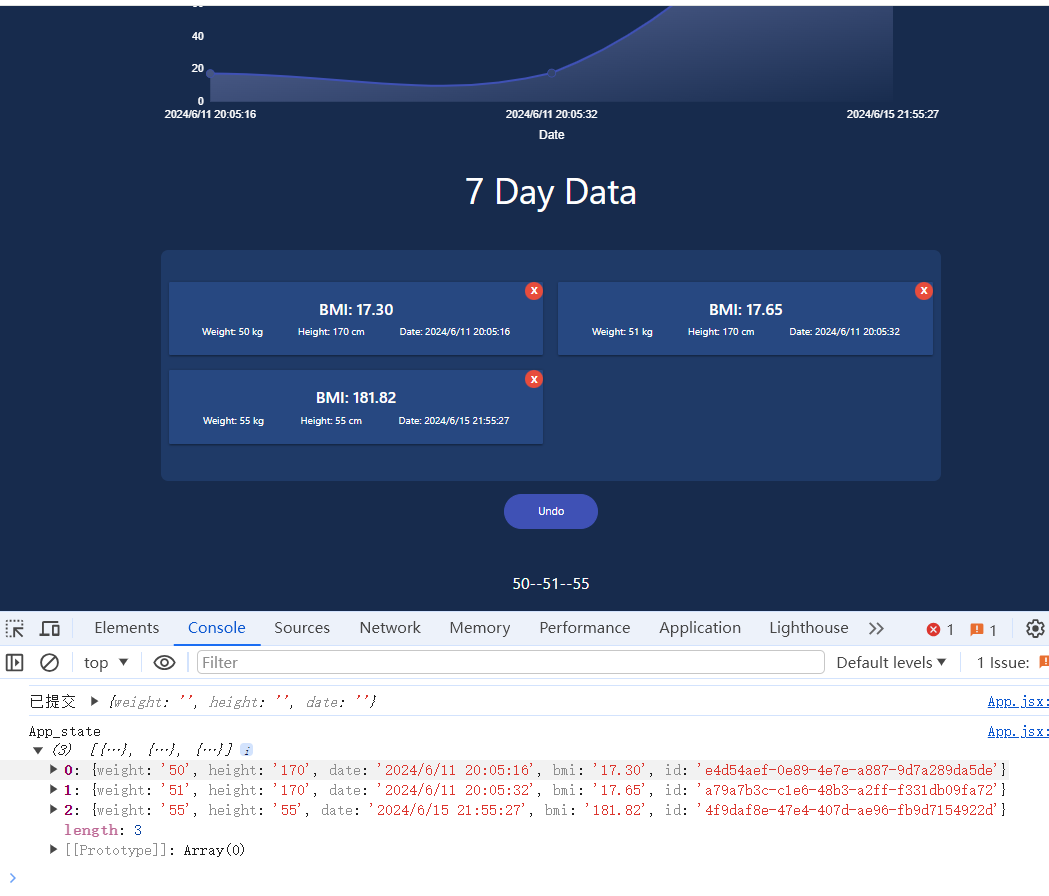
存数据
useEffect(() => {storeData('data', state); // 初始化组件和每次更新state时,都会触发storeData保存数据console.log('App_state', state)}, [state]);
取数据
const App = () => {// ,initialState 被定义为一个箭头函数,然后作为 useState 的参数使用。这里有一个常见的误解:通常我们不希望将 useState 的初始化函数定义为箭头函数,因为这样会导致每次组件渲染时都会创建一个新的函数实例,可能会引发不必要的组件重新渲染。// initialState是一个箭头函数,这种方式适用于当你想延迟执行 getData('data') 或者在未来的某个时间点决定是否执行这个操作时const initialState = () => getData('data') || []; const [state, setState] = useState(initialState)
Undo 使用本地化数据,不使用useRef()缓存了
// let lastState // 注意这个地方,如只是一般的变量,那么每次setState(lastState),渲染的时候handleUndo函数都会从新执行,一直在初始化lastState,所以需要使用useRef// let lastState = useRef([])const deleteCard = (id) => {storeData('lastState', state); // 不使用useRef([])缓存了,直接本地化保存数据let newState = state.filter(item => item.id !== id)setState(newState)// console.log(id,state)// console.log(lastState.current)}const handleUndo = () => {// setState(lastState);setState(getData('lastState'));// console.log(lastState.current , state)}
08-2组件化、模块化
将输入添加,图表模块,七天数据模块,做成单独的模块
输入添加模块
图表模块
七天数据模块
08-2-1输入添加模块
【分支08-2-1】
直接将我写好的都拿过来
将 Input_handleChange , 从App模块传递到 BmiForm 模块
import React, { useState } from 'react';
import PropTypes from 'prop-types';
import '../App/App.css'const Input_initialValues = {weight: '',height: '',date: ''
}const BmiForm = ({ Input_handleChange }) => {// 定义,初始化数据状态const [Input_state, setState_Input] = useState(Input_initialValues)// input 改变时,更新数据const handleChange = e => {let { value, name } = e.target;// 输入的数字不能大于999if (value > 999) {value = 999}const date = new Date().toLocaleString().split(',')[0]// console.log(date)// 更新输入框的值setState_Input({...Input_state,[name]: value,date})}// 提交数据const handleSubmit = () => {Input_handleChange(Input_state)setState_Input(Input_initialValues)// console.log('已提交', Input_state)// console.log('已提交', Input_initialValues)}return (<>{/* 输入框 */}< div className='row' ><div className='col m12 s12'><div className='row'><div className='col m6 s12'><label htmlFor="weight">Weight (in kg)</label><inputtype="number"id="weight"name="weight"min="1"max="999"placeholder="50"value={Input_state.weight}onChange={handleChange}/></div><div className='col m6 s12'><label htmlFor="height">Height (in cm)</label><inputtype="number"id="height"name="height"min="1"max="999"placeholder="175"value={Input_state.height}onChange={handleChange}/></div></div><div className='center'><buttonid="bmi-btn"className="calculate-btn"type="button"disabled={!Input_state.weight || !Input_state.height}onClick={handleSubmit}>Calculate BMI</button></div>{ }</div></div ></>)
}BmiForm.propTypes ={change: PropTypes.func.isRequired
}export default BmiForm;
08-2-2图表模块
【分支08-2-2】
直接将我写好的都拿过来
08-2-3七天数据模块
【分支08-2-3】
直接将我写好的都拿过来
09 修一些bug
【分支09】