周末,有读者加我, 说 之前的涨停分析 是否可以增加连板分析。 这个可以加上。
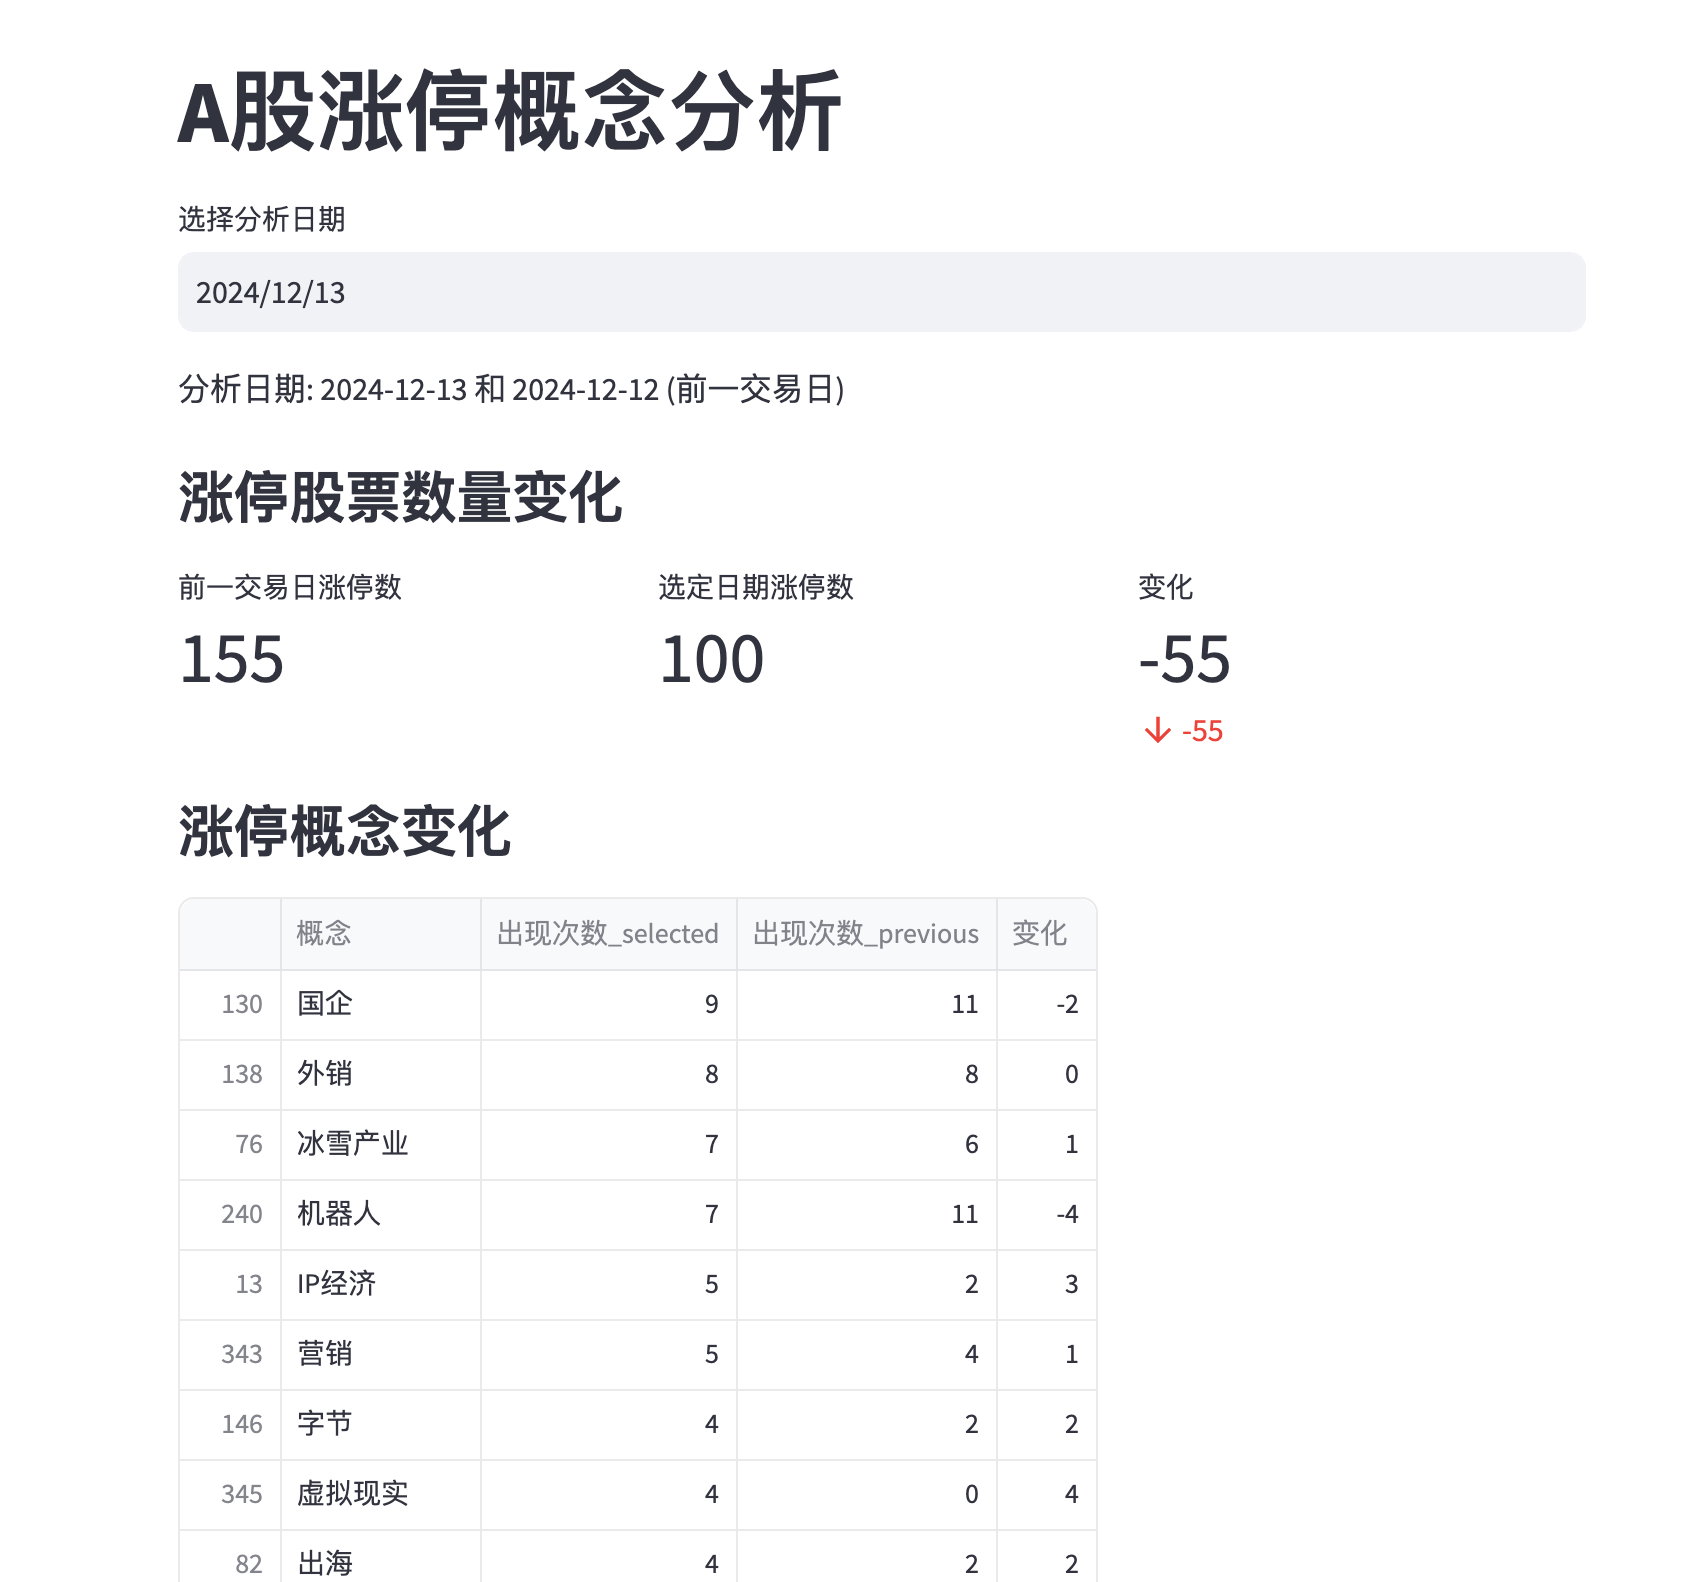
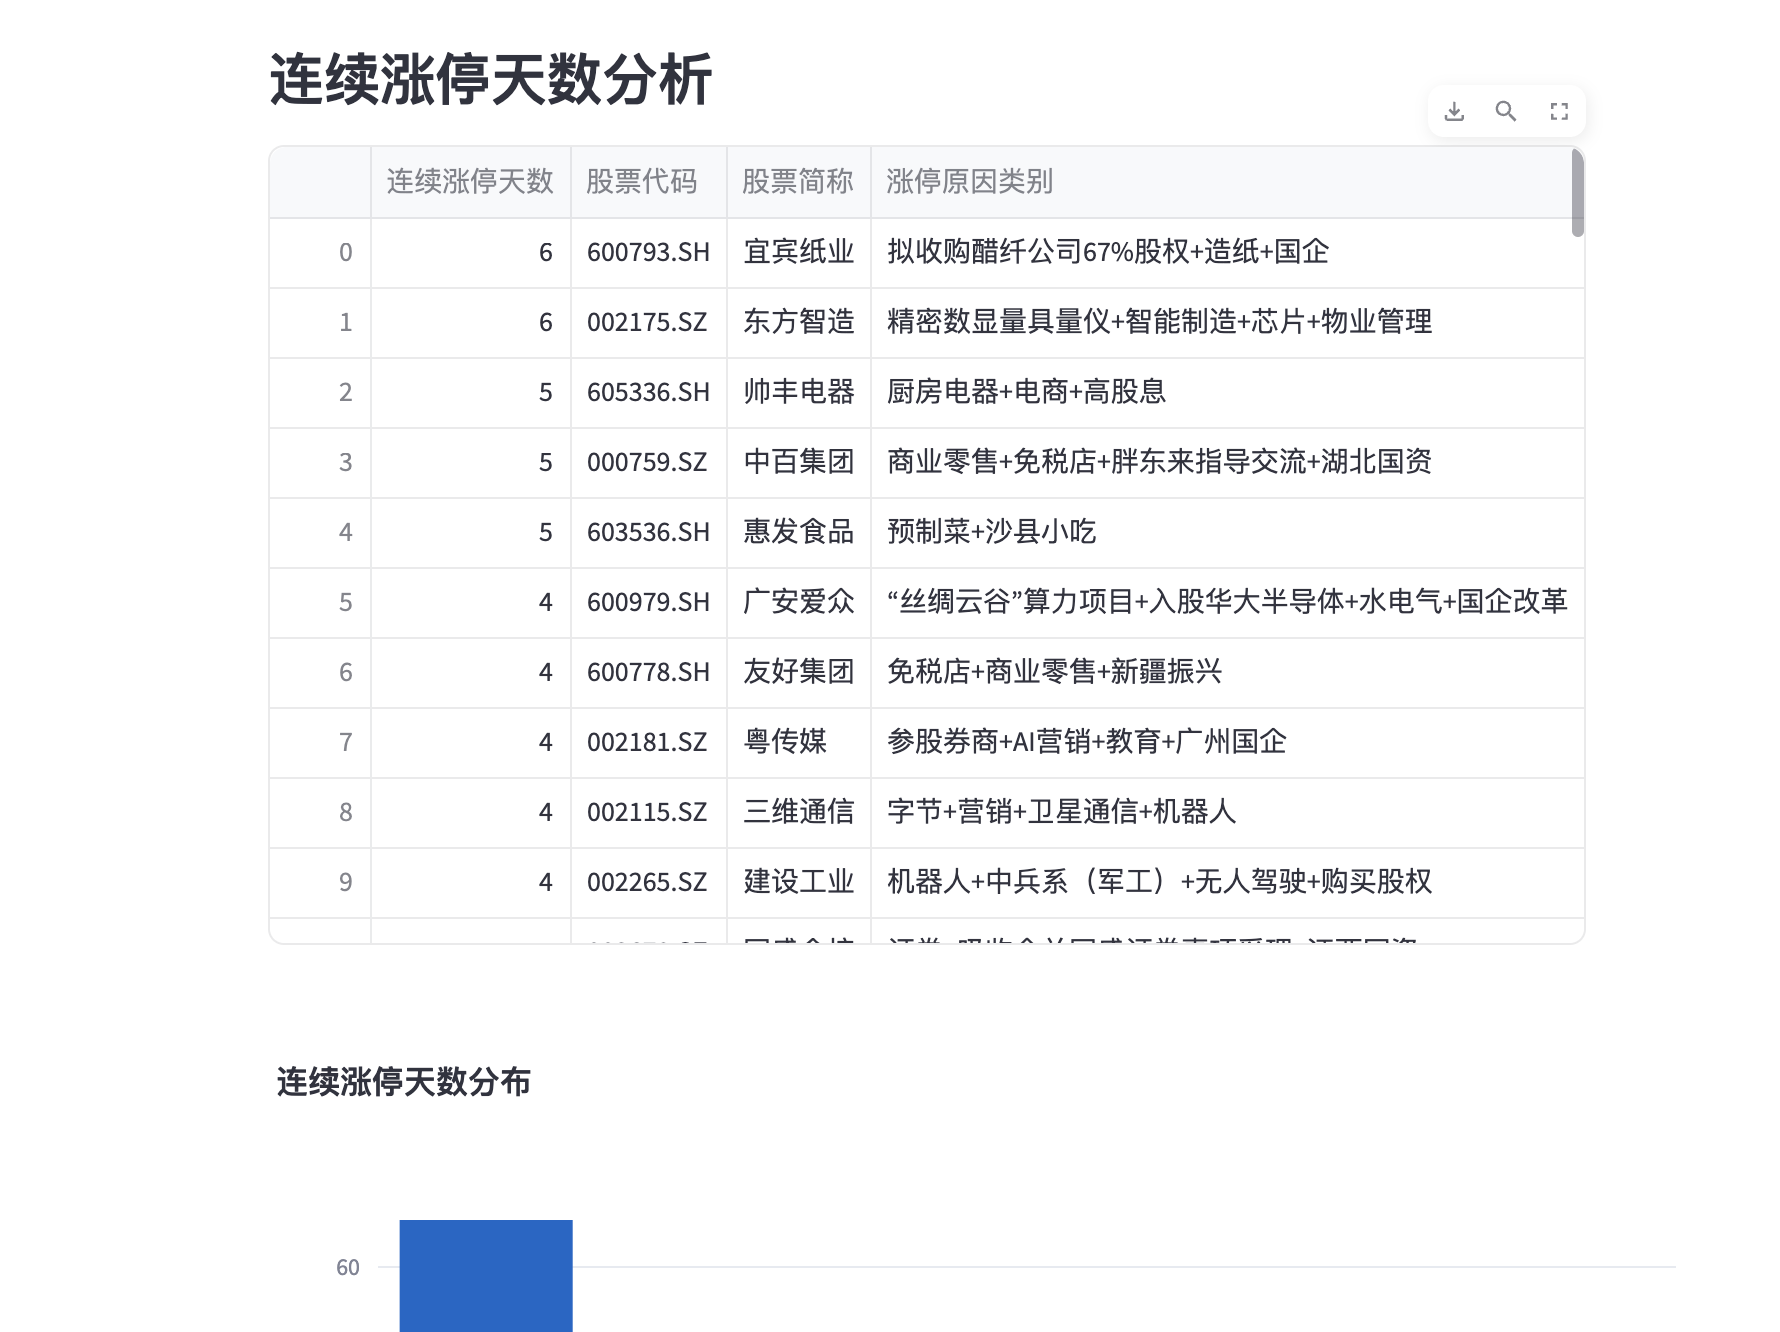
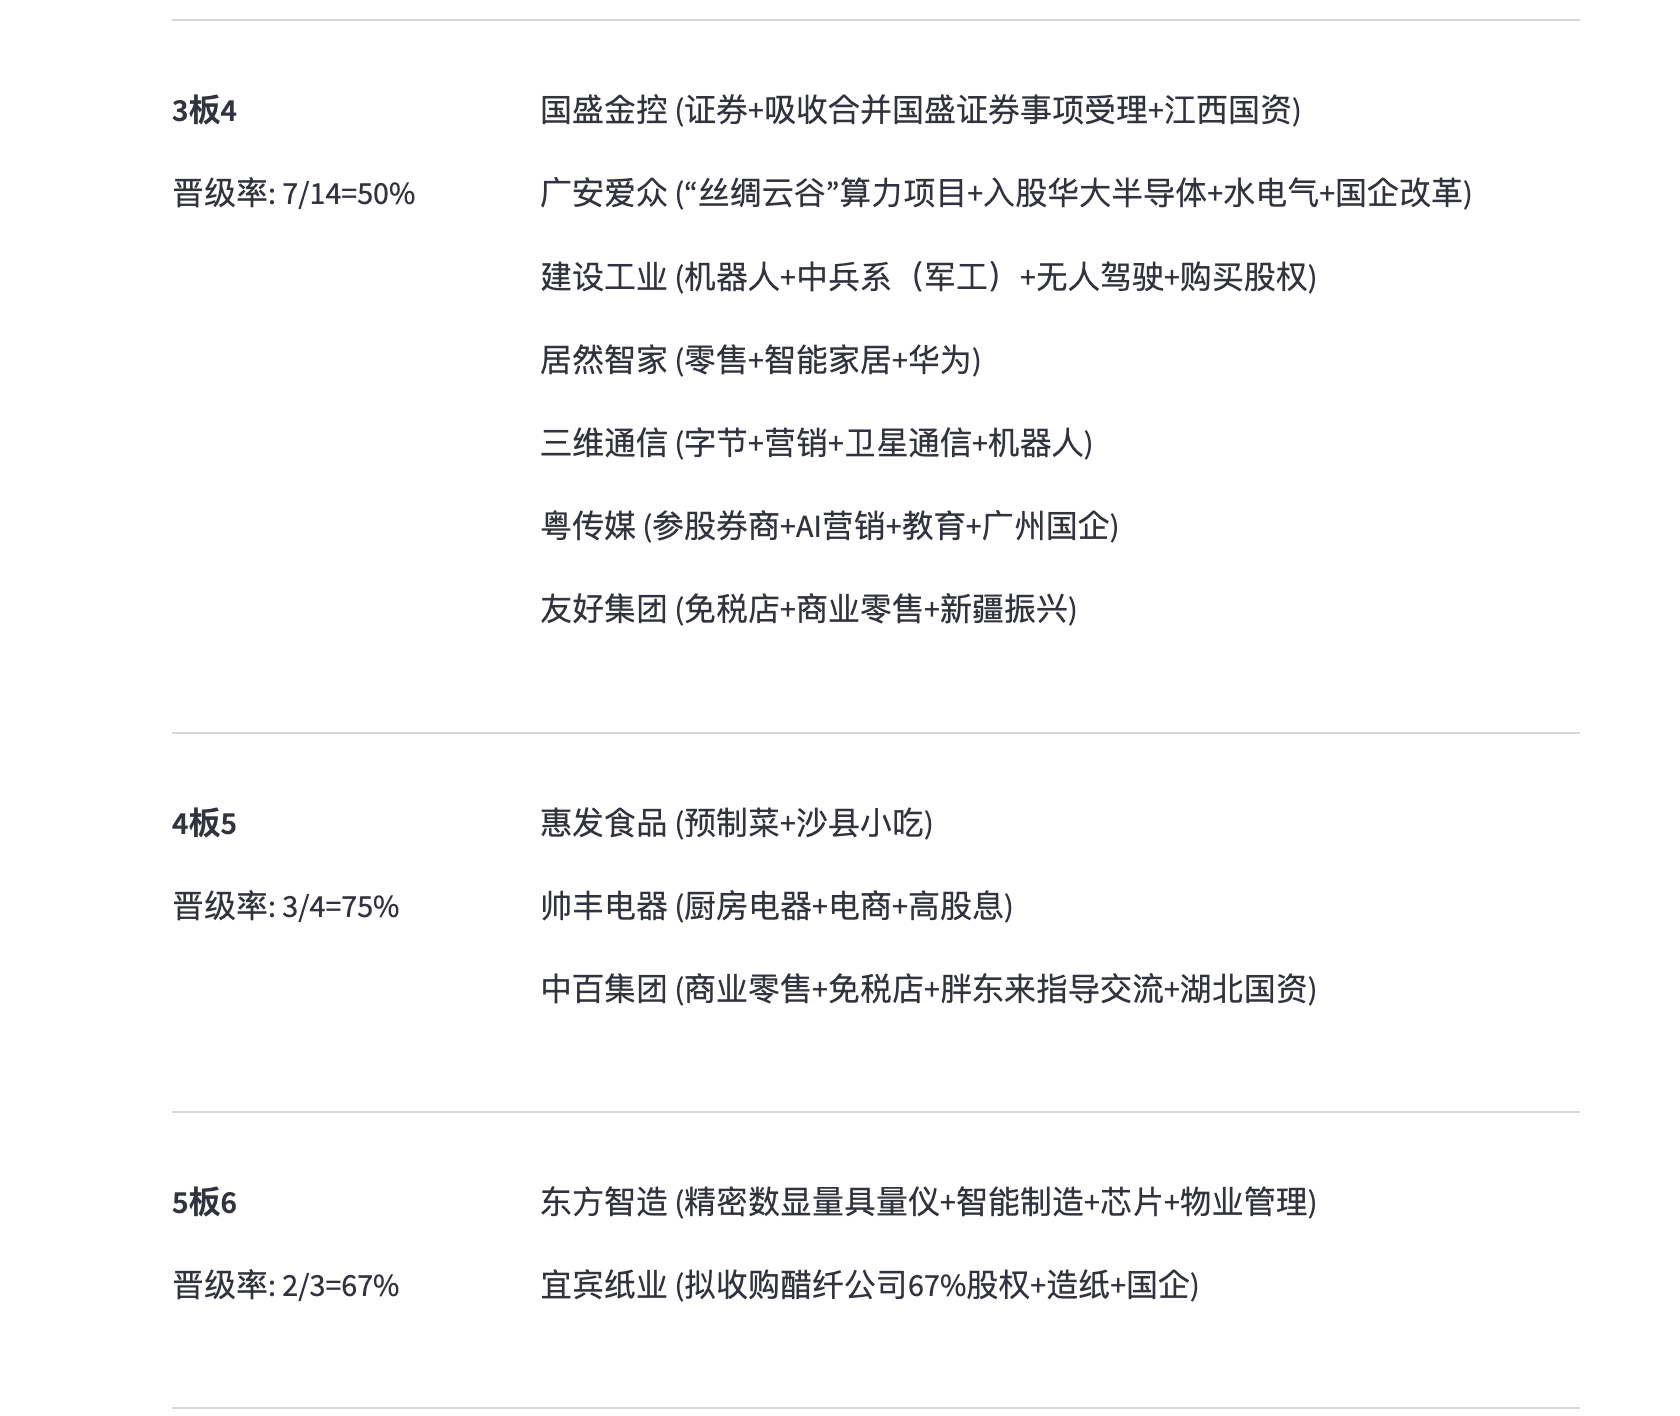
先看效果


这里附上完整代码:
import streamlit as st
import pywencai
import pandas as pd
from datetime import datetime, timedelta
import plotly.graph_objects as go
from chinese_calendar import is_workday, is_holiday# Setting up pandas display options
pd.set_option('display.unicode.ambiguous_as_wide', True)
pd.set_option('display.unicode.east_asian_width', True)
pd.set_option('display.max_rows', None)
pd.set_option('display.max_columns', None)
pd.set_option('display.expand_frame_repr', False)
pd.set_option('display.max_colwidth', 100)def get_previous_trading_day(date):previous_date = date - timedelta(days=1)while not is_workday(previous_date) or is_holiday(previous_date):previous_date -= timedelta(days=1)return previous_datedef get_limit_up_data(date):param = f"{date.strftime('%Y%m%d')}涨停,成交金额排序"df = pywencai.get(query=param, sort_key='成交金额', sort_order='desc', loop=True)return dfdef analyze_continuous_limit_up(df, date):# 提取连续涨停天数列和涨停原因类别列continuous_days_col = f'连续涨停天数[{date.strftime("%Y%m%d")}]'reason_col = f'涨停原因类别[{date.strftime("%Y%m%d")}]'# 确保涨停原因类别列存在if reason_col not in df.columns:df[reason_col] = '未知'# 按连续涨停天数降序排序,然后按涨停原因类别排序df_sorted = df.sort_values([continuous_days_col, reason_col], ascending=[False, True])# 创建结果DataFrameresult = pd.DataFrame(columns=['连续涨停天数', '股票代码', '股票简称', '涨停原因类别'])# 遍历排序后的DataFrame,为每只股票创建一行for _, row in df_sorted.iterrows():new_row = pd.DataFrame({'连续涨停天数': [row[continuous_days_col]],'股票代码': [row['股票代码']],'股票简称': [row['股票简称']],'涨停原因类别': [row[reason_col]]})result = pd.concat([result, new_row], ignore_index=True)return resultdef get_concept_counts(df, date):concepts = df[f'涨停原因类别[{date.strftime("%Y%m%d")}]'].str.split('+').explode().reset_index(drop=True)concept_counts = concepts.value_counts().reset_index()concept_counts.columns = ['概念', '出现次数']return concept_countsdef calculate_promotion_rates(current_df, previous_df, current_date, previous_date):"""Calculate promotion rates between consecutive days"""current_days_col = f'连续涨停天数[{current_date.strftime("%Y%m%d")}]'previous_days_col = f'连续涨停天数[{previous_date.strftime("%Y%m%d")}]'promotion_data = []# Calculate for each level (from 1 to max consecutive days)max_days = max(current_df[current_days_col].max(), previous_df[previous_days_col].max())for days in range(1, int(max_days)):# Previous day count for current levelprev_count = len(previous_df[previous_df[previous_days_col] == days])# Current day count for next levelcurr_count = len(current_df[current_df[current_days_col] == days + 1])if prev_count > 0:promotion_rate = f"{curr_count}/{prev_count}={round(curr_count / prev_count * 100 if prev_count > 0 else 0)}%"else:promotion_rate = "N/A"# Get stocks that promotedpromoted_stocks = current_df[current_df[current_days_col] == days + 1][['股票简称', f'涨停原因类别[{current_date.strftime("%Y%m%d")}]']]promotion_data.append({'连板数': f"{days}板{days + 1}",'晋级率': promotion_rate,'股票列表': promoted_stocks})return pd.DataFrame(promotion_data)def app():st.title("A股涨停概念分析")# Date selectionmax_date = datetime.now().date()selected_date = st.date_input("选择分析日期", max_value=max_date, value=max_date)if not is_workday(selected_date) or is_holiday(selected_date):st.write("所选日期不是A股交易日,请选择其他日期。")returnprevious_date = get_previous_trading_day(selected_date)st.write(f"分析日期: {selected_date} 和 {previous_date} (前一交易日)")# Fetch data for both daysselected_df = get_limit_up_data(selected_date)previous_df = get_limit_up_data(previous_date)# Analyze continuous limit-up for both daysselected_continuous = analyze_continuous_limit_up(selected_df, selected_date)previous_continuous = analyze_continuous_limit_up(previous_df, previous_date)# Get concept counts for both daysselected_concepts = get_concept_counts(selected_df, selected_date)previous_concepts = get_concept_counts(previous_df, previous_date)# Merge concept countsmerged_concepts = pd.merge(selected_concepts, previous_concepts, on='概念', how='outer',suffixes=('_selected', '_previous'))merged_concepts = merged_concepts.fillna(0)# Calculate changemerged_concepts['变化'] = merged_concepts['出现次数_selected'] - merged_concepts['出现次数_previous']# Sort by '出现次数_selected' in descending ordersorted_concepts = merged_concepts.sort_values('出现次数_selected', ascending=False)# Display total limit-up stocks for both daysst.subheader("涨停股票数量变化")selected_total = len(selected_continuous)previous_total = len(previous_continuous)change = selected_total - previous_totalcol1, col2, col3 = st.columns(3)col1.metric("前一交易日涨停数", previous_total)col2.metric("选定日期涨停数", selected_total)col3.metric("变化", change, f"{change:+d}")# Display concept changesst.subheader("涨停概念变化")st.dataframe(sorted_concepts)# Create a bar chart for top 10 conceptstop_10_concepts = sorted_concepts.head(10)fig = go.Figure(data=[go.Bar(name='选定日期', x=top_10_concepts['概念'], y=top_10_concepts['出现次数_selected']),go.Bar(name='前一交易日', x=top_10_concepts['概念'], y=top_10_concepts['出现次数_previous'])])fig.update_layout(barmode='group', title='Top 10 涨停概念对比')st.plotly_chart(fig)# Display continuous limit-up analysisst.subheader("连续涨停天数分析")st.dataframe(selected_continuous)# Create a bar chart for continuous limit-up days distributioncontinuous_days_count = selected_continuous['连续涨停天数'].value_counts().sort_index()fig_continuous = go.Figure(data=[go.Bar(x=continuous_days_count.index, y=continuous_days_count.values)])fig_continuous.update_layout(title='连续涨停天数分布',xaxis_title='连续涨停天数',yaxis_title='股票数量',xaxis=dict(tickmode='linear'))st.plotly_chart(fig_continuous)# Display raw datast.subheader("选定日期涨停股票详情")st.dataframe(selected_df)st.subheader("连板晋级率分析")promotion_rates = calculate_promotion_rates(selected_df, previous_df, selected_date, previous_date)# Display promotion rates in a custom formatfor _, row in promotion_rates.iterrows():col1, col2 = st.columns([1, 3])with col1:st.write(f"**{row['连板数']}**")st.write(f"晋级率: {row['晋级率']}")with col2:if not row['股票列表'].empty:for _, stock in row['股票列表'].iterrows():concept = stock[f'涨停原因类别[{selected_date.strftime("%Y%m%d")}]']st.write(f"{stock['股票简称']} ({concept})")st.markdown("---")# Create visualization for promotion ratespromotion_rates_fig = go.Figure()# Extract numeric values from promotion ratesrates = []labels = []for _, row in promotion_rates.iterrows():if row['晋级率'] != 'N/A':rate = int(row['晋级率'].split('=')[1].replace('%', ''))rates.append(rate)labels.append(row['连板数'])promotion_rates_fig.add_trace(go.Bar(x=labels,y=rates,text=[f"{rate}%" for rate in rates],textposition='auto',))promotion_rates_fig.update_layout(title='连板晋级率分布',xaxis_title='连板数',yaxis_title='晋级率 (%)',yaxis_range=[0, 100])st.plotly_chart(promotion_rates_fig)if __name__ == "__main__":app()
在原来代码基础上增加了 根据连板天数排序, 每支个股的涨停原因分析。 这个我之前没加, 是因为我很少关注连续涨停股, 毕竟我不是龙头选手。
另外增加了连板晋级率, 比如1进2,2进3 可以分析涨停板晋级概率。对于龙头选手有一定的辅助效果。
另外交易日判断,我之前肤浅了,主要是脑子短路了。根据读者提醒,改为引入日历控件chinese_calendar的is_workday, is_holiday 判断工作日、节假日。
原文链接:
【Python技术】同花顺wencai涨停分析基础上增加连板分析


