将 Segment Anything Model Version 2 应用于卫星图像以检测和导出农业地区田地边界的分步教程
🌟 简介
手动绘制田地边界是最耗时的任务之一,其准确性取决于绘制者的表现。然而,精确的边界检测在很多领域都有应用。例如,假设您想训练一种机器学习算法,分析卫星图像中的植被指数与农场作物产量之间的关系。您需要的第一个输入是农场的形状文件,这通常需要手动绘制。绘制一个形状文件可能只需要几分钟,但如果您需要为 1000 个农场绘制边界呢?这时,这个过程就变得非常耗时,而自动提取边界的技术就变得非常有价值,可以节省数小时的工作时间。
在本教程中,我将演示如何使用由吴秋生博士基于第一版和第二版 "分段任何模型(SAM)"开发的 segment-anything-py 和 segment-geospatial Python 软件包。所有代码都是在 Google Colab 中编写和测试的,任何人都可以轻松复制这些步骤。如果您对此感兴趣,请继续阅读!
🚀 设置 Google Colab
所有代码都将使用 Python 编写,并在 Google Colab 平台上进行测试,因此您无需安装各种软件和编译器即可按照步骤进行操作。由于运行 SAM 需要 GPU,因此请确保将运行时更改为 TPUv4,方法是点击 "运行时 "选项卡,选择 "更改运行时类型",然后选择 "TPUv4"。此外,还需要使用 pip 命令安装以下软件包:
pip install pandas rasterio🛰️ 加载清晰的哨兵-2 图像
设置好 Google Colab 后,我们需要一张农田的航空图像。我在本教程中使用了一张哨兵-2 图像,但您也可以使用任何按顺序(蓝、绿、红)保存了红色、绿色和蓝色波段的卫星图像。
Downloading Sentinel-2 Imagery in Python with Google Colab (Updated Nov 2023)
并使用以下信息检索相同的图像:图像信息 (S2B_MSIL2A_20240806T184919_N0511_R113_T10SFH):
url_dataspace = "https://catalogue.dataspace.copernicus.eu/odata/v1"satellite = "SENTINEL-2"
level = "S2MSI2A"aoi_point = "POINT(-121.707902 38.368628)"cloud_cover = 10start_date = "2024-07-15"
end_date = "2024-08-10"
start_date_full =start_date+"T00:00:00.000Z"
end_date_full = end_date +"T00:00:00.000Z"
按照这些步骤操作后,您的内容文件夹中就会出现 JP2 格式的三个单独色带(红、绿、蓝),如下图所示:
🌍 在哨兵-2 图像上应用 SAM2
将 SAM2 应用于卫星图像相对简单,但需要额外的步骤为模型准备图像。第一步是剪切下载的场景,将重点放在我们感兴趣的区域(AOI)上,因为完整的场景可能包括我们不感兴趣的区域,如城区、海洋、湖泊、山脉或森林。此外,Google Colab 的资源可能不足以处理整个场景。要创建一个较小的 AOI,我们可以在农业区域内定义一个点,并在该点的周围设置一个约 5 千米的缓冲区。
第二步是保存剪切后的图像,并将波段排序为蓝、绿、红("BGR"),因为算法希望采用这种顺序,而不是通常的 "RGB"。最后,将输出保存为 GeoTIFF 格式,因为算法不接受 JP2 格式的文件。下面的代码在点周围定义了一个缓冲区,根据边界框剪切红、绿、蓝三色带,并以 BGR 顺序将输出保存为 GeoTIFF 格式:
import rasterio
from rasterio.merge import merge
from rasterio.plot import show
from rasterio.mask import mask
from shapely.geometry import Point, box
from shapely.wkt import loads as load_wkt
import geopandas as gpd
from pyproj import CRS, Transformer
import numpy as np
import osdef clip_and_merge_jp2_files(blue_jp2, green_jp2, red_jp2, aoi_point_wkt, buffer_radius_km, output_tiff):# Parse the AOI point from WKTaoi_point = load_wkt(aoi_point_wkt)# Open the JP2 fileswith rasterio.open(blue_jp2) as blue_src, \rasterio.open(green_jp2) as green_src, \rasterio.open(red_jp2) as red_src:# Get the CRS of the JP2 files jp2_crs = blue_src.crs# Create a GeoDataFrame for the AOI point aoi_gdf = gpd.GeoDataFrame({'geometry': [aoi_point]}, crs="EPSG:4326")# Reproject the AOI point to the JP2 CRS if aoi_gdf.crs != jp2_crs:aoi_gdf = aoi_gdf.to_crs(jp2_crs)# Create a buffer around the AOI point (in meters)buffer_radius = buffer_radius_km * 1000  # Convert km to metersaoi_buffer = aoi_gdf.geometry.buffer(buffer_radius).iloc[0]# Convert the buffer to a bounding boxminx, miny, maxx, maxy = aoi_buffer.boundsbbox = box(minx, miny, maxx, maxy)# Convert the bbox to a GeoDataFramebbox_gdf = gpd.GeoDataFrame({'geometry': [bbox]}, crs=jp2_crs)# Clip each band using the bboxblue_clipped, blue_transform = mask(blue_src, bbox_gdf.geometry, crop=True)green_clipped, green_transform = mask(green_src, bbox_gdf.geometry, crop=True)red_clipped, red_transform = mask(red_src, bbox_gdf.geometry, crop=True)# Update the metadata meta = blue_src.meta.copy()meta.update({"driver": "GTiff","height": blue_clipped.shape[1],"width": blue_clipped.shape[2],"transform": blue_transform,"count": 3,  # We have three bands: B, G, R"dtype": blue_clipped.dtype})# Merge the bands into a single arraymerged_bgr = np.stack([blue_clipped[0], green_clipped[0], red_clipped[0]])# Save the merged BGR image as a GeoTIFFwith rasterio.open(output_tiff, 'w', **meta) as dst:dst.write(merged_bgr)print(f"Clipped and merged image saved as {output_tiff}")blue_jp2 = 'T10SFH_20240806T184919_B02_10m.jp2'
green_jp2 = 'T10SFH_20240806T184919_B03_10m.jp2'
red_jp2 = 'T10SFH_20240806T184919_B04_10m.jp2'
buffer_radius_km = 1.5
output_tiff = 'BGR_20240806.tif'
aoi_point = "POINT(-121.707902 38.368628)" #AOI point (longitude, latitude)clip_and_merge_jp2_files(blue_jp2, green_jp2, red_jp2, aoi_point, buffer_radius_km, output_tiff)
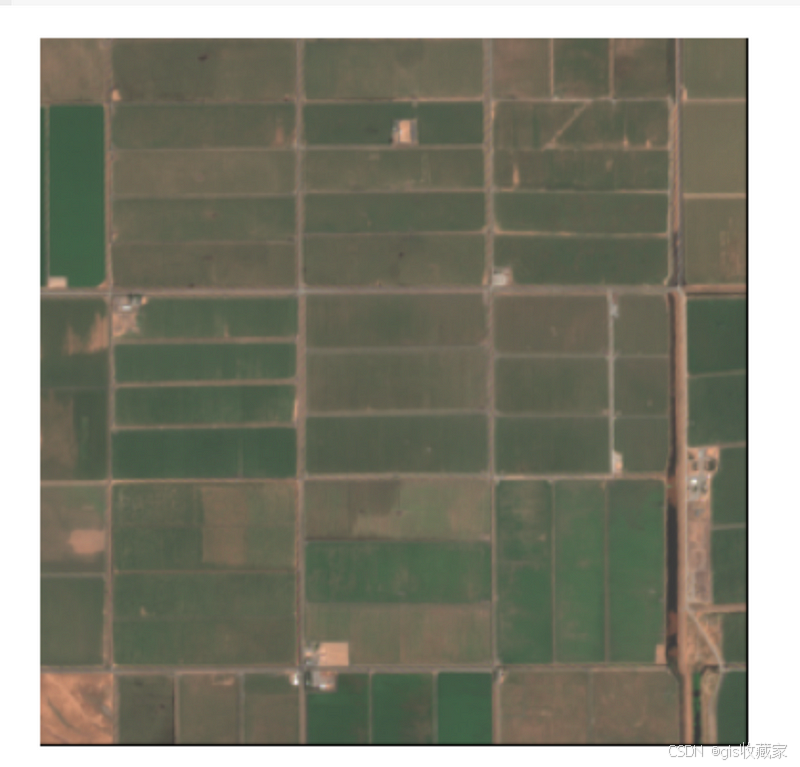
运行代码后,你应该能在内容文件夹中看到剪切后的图片:
import matplotlib.pyplot as pltdef plot_tiff(tiff_file):# Open the tiff filewith rasterio.open(tiff_file) as src:b_band = src.read(1) g_band = src.read(2) r_band = src.read(3) # Stack the bands into a single numpy arrayrgb = np.dstack((r_band, g_band, b_band))# Normalize the bands to the range [0, 1] (for display)rgb = rgb.astype(np.float32)rgb /= np.max(rgb)# Plot the imageplt.imshow(rgb)plt.axis('off') # Hide the axisplt.show()plot_tiff('BGR_20240806.tif')
下载图像后,下一步是剪切图像并将其保存为可接受的格式。我们需要更改图像格式,因为算法需要 8 位无符号格式,而剪切后的图像是浮点格式。下面的脚本转换了格式,并以 8 位无符号格式保存图像:
def convert_to_8bit(input_tiff, output_tiff):with rasterio.open(input_tiff) as src:blue = src.read(1)green = src.read(2)red = src.read(3)# Normalize the float values to 0-255 and convert to 8-bit unsigned integersblue_8bit = np.clip((blue - np.min(blue)) / (np.max(blue) - np.min(blue)) * 255, 0, 255).astype(np.uint8)green_8bit = np.clip((green - np.min(green)) / (np.max(green) - np.min(green)) * 255, 0, 255).astype(np.uint8)red_8bit = np.clip((red - np.min(red)) / (np.max(red) - np.min(red)) * 255, 0, 255).astype(np.uint8)# Define metadata profile = src.profileprofile.update(dtype=rasterio.uint8,count=3,compress='lzw')# Write the new 8-bit data to the output filewith rasterio.open(output_tiff, 'w', **profile) as dst:dst.write(blue_8bit, 1)dst.write(green_8bit, 2)dst.write(red_8bit, 3)input_tiff = 'BGR_20240806.tif'
output_tiff = 'BGR_20240806_8bit.tif'
convert_to_8bit(input_tiff, output_tiff)
第三步是将 UTM 坐标的图像保存为地理坐标(经纬度)。运行以下代码即可完成此操作:
from rasterio.warp import calculate_default_transform, reproject, Resamplingdef convert_to_latlong(input_tiff, output_tiff):with rasterio.open(input_tiff) as src:transform, width, height = calculate_default_transform(src.crs, 'EPSG:4326', src.width, src.height, *src.bounds)kwargs = src.meta.copy()kwargs.update({'crs': 'EPSG:4326','transform': transform,'width': width,'height': height})with rasterio.open(output_tiff, 'w', **kwargs) as dst:for i in range(1, src.count + 1):reproject(source=rasterio.band(src, i),destination=rasterio.band(dst, i),src_transform=src.transform,src_crs=src.crs,dst_transform=transform,dst_crs='EPSG:4326',resampling=Resampling.nearest)input_tiff = 'BGR_20240806.tif'
output_tiff = 'BGR_20240806_reproj.tif'
convert_to_latlong(input_tiff, output_tiff)
最后一步取决于您想如何部署和使用 SAM 算法。有两种模式可供选择:自动和手动。在自动模式下,算法只需要我们导出的准备好的图像(带地理坐标的 8 位无符号格式剪切 BGR 图像)。在手动模式下,您可以在每个对象上添加一个点,这通常有助于算法生成更精确的结果,并对用户点识别的对象进行分割。要在自动模式下运行算法,可以跳过下面的章节,直接跳到 "自动模式下的 SAM"。但是,如果您还想使用手动模式,请添加下面的脚本,这样您就可以点击图像并以经纬度存储您的点。
from localtileserver import get_folium_tile_layer, TileClient,get_leaflet_tile_layer
import ipyleaflet
from shapely.geometry import Point
from ipyleaflet import Map, Marker, ImageOverlay
from ipywidgets import Output, VBox
from IPython.display import display
import matplotlib.pyplot as plt
from PIL import Imagegeotiff_path = 'BGR_20240806_reproj.tif'# Create a TileClient object
client = TileClient(geotiff_path)# Create a TileLayer using the client
tiff_layer = get_leaflet_tile_layer(client, name='GeoTIFF')# Get the bounds of the GeoTIFF
bounds = client.bounds()
center = ((bounds[0] + bounds[1]) / 2, (bounds[2] + bounds[3]) / 2)# Create an ipyleaflet map
m = Map(center=center, zoom=14)# Add the TileLayer to the map
m.add_layer(tiff_layer)# Create a list to store the clicked points
clicked_points = []# Create an output widget to capture map click events
output = Output()# Function to handle clicks on the map
def handle_click(**kwargs):if 'type' in kwargs and kwargs['type'] == 'click':latlon = kwargs.get('coordinates')if latlon:lat, lon = latlonclicked_points.append(Point(lon, lat))marker = Marker(location=(lat, lon))m.add_layer(marker)with output:print(f"Point added: {lat}, {lon}")# Add the click handler to the map
m.on_interaction(handle_click)# Display the map and output widget
display(VBox([m, output]))
运行代码后,会出现一张交互式地图,您可以点击地图。每次点击后,这些点都会用蓝色标记标出,如下图所示: 要查看您在地图上所选点的坐标,只需运行以下代码即可:
clicked_points[<POINT (-121.709 38.371)>,<POINT (-121.716 38.371)>,<POINT (-121.717 38.37)>,<POINT (-121.717 38.368)>,<POINT (-121.717 38.366)>,<POINT (-121.709 38.366)>,<POINT (-121.709 38.369)>,<POINT (-121.7 38.371)>,<POINT (-121.701 38.369)>,<POINT (-121.7 38.367)>,<POINT (-121.697 38.375)>,<POINT (-121.715 38.377)>,<POINT (-121.718 38.379)>,<POINT (-121.72 38.363)>,<POINT (-121.699 38.362)>]您还可以通过使用
# Function to export the points to a GeoPackage
def export_to_gpkg(points, output_path):"""Export points to a GeoPackage."""gdf = gpd.GeoDataFrame(geometry=points, crs="EPSG:4326")gdf.to_file(output_path, driver="GPKG")output_gpkg_path = 'output.gpkg'
export_to_gpkg(clicked_points, output_gpkg_path)
自动模式的 SAM
如前所述,如果输入图像的格式符合 SAM 算法的要求,那么在 Google Colab 平台上运行算法就相对简单。由于我们已经完成了下载、剪切、格式化、更改波段顺序和调整数据类型等所有必要步骤,现在我们的图像已经准备就绪,是时候执行 SAM 并查看结果了。本节主要介绍 SAM 的自动模式,我们将安装由吴秋生博士开发的地理空间版 SAM,选择预训练模型,并将结果可视化。要启动 SAM,只需安装以下软件包并加载这些库:
pip install -U segment-geospatial
import leafmap
from samgeo import SamGeo2, regularize,SamGeo
安装 segment-geospatial 软件包大约需要 5 到 10 分钟,因此在运行该行时请耐心等待。安装软件包并导入库后,我们可以选择预训练模型,并通过配置 SAM 选择自动模式:
sam = SamGeo2(model_id="sam2-hiera-large",automatic=True,
)
可视化分割图像前的最后一步是使用我们的图像,定义输出名称,并通过以下代码运行算法:
image = 'BGR_20240806_8bit.tif'
mask = 'segment_auto.tif'
sam.generate(image, mask)
最后一行将生成 segment_auto.tif 文件,该文件可在内容文件夹中找到。
现在,我们已经得到了结果,可以使用分割地图对原始图像和分割图像进行可视化处理。在这张地图中,右侧显示的是 RGB 的原始卫星图像,左侧显示的是 SAM 在自动模式下生成的分割图像:
m = leafmap.Map()
m.add_raster(image, layer_name="Image")
m.split_map('segment_auto.tif',image,left_label="auto_mask",right_label="Aerial imagery",left_args={"colormap": "tab20", "nodata": 0, "opacity": 0.7},
)
m
如图所示,在这种类型的图像和自动模式下,SAM 能够分割出几个区块,但在这一帧中错过了大部分区块。下一步,我们将使用手动模式,看看手动选择区块是否有助于提高准确性。
带手动模式的 SAM
由于自动模式在分割卫星图像中的农场边界方面不是很成功,我们将在手动模式下再次运行该算法。在此,我们将提供位于几个农场内的点,并要求模型分割这些点所识别的对象。步骤与上一节(自动模式)类似,但有一个例外:添加用户输入。要将点输入算法,应从 geopackage(.gpkg)文件中提取点的坐标,并将其格式化为列表。下面的代码将 geopackage 文件转换为所需格式,以便使用我们的点运行 SAM:
import geopandas as gpddef convert_gpkg_to_point_coords_batch(gpkg_file):gdf = gpd.read_file(gpkg_file)if not all(gdf.geometry.geom_type == 'Point'):raise ValueError("The GeoPackage file must contain only point geometries.")point_coords_batch = [[point.x, point.y] for point in gdf.geometry]return point_coords_batchgpkg_file = "output.gpkg"
point_coords_batch = convert_gpkg_to_point_coords_batch(gpkg_file)
print(point_coords_batch)
在配置文件中,只需将自动变量设置为 "假 "即可:
sam = SamGeo2(model_id="sam2-hiera-large",automatic=False,
)sam.set_image(image)
然后,使用 sam.predict_by_points 根据之前选择的点运行算法。输出结果将以 mask.tif 的形式保存在内容文件夹中。
sam.predict_by_points(point_coords_batch=point_coords_batch,point_crs="EPSG:4326",output="mask.tif",dtype="uint8",
)
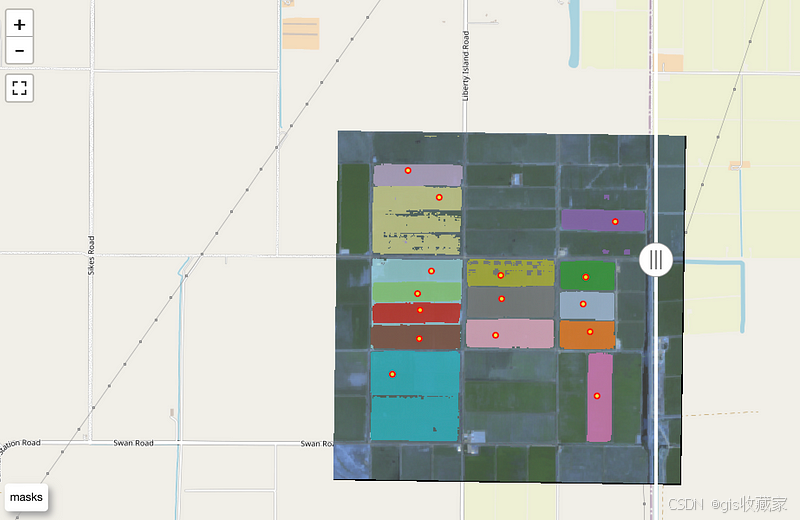
与自动模式类似,我们可以使用 leafmap 库中的分割图功能来并排显示分割后的图像和原始图像:
m = leafmap.Map()
m.add_raster(image, layer_name="Image")
m.add_circle_markers_from_xy('output.gpkg', radius=3, color="red", fill_color="yellow", fill_opacity=0.8
)
m.split_map('mask.tif',image,left_label="masks",right_label="Aerial imagery",left_args={"colormap": "tab20", "nodata": 0, "opacity": 0.7},
)
m
如图所示,随着输入点的增加,SAM2 在检测田块边界方面的性能有了显著提高,这有助于限制图像中的片段数量。然而,在一些区块中出现了一些绿色斑块,这些斑块代表了属于某些田地但被排除在区段之外的区域。这种排除种植区的情况会严重影响结果,导致根据分割的田地边界计算出的面积被低估。
📄 结论
Segment Anything Model(SAM)的第二个版本是一种强大的无监督算法,用于自动创建任何图像的分割层,与大约一年前发布的第一个版本类似。该算法有望应用于众多与检测和计算物体相关的人工智能和 ML 项目中。然而,与任何算法一样,它也需要在不同的对象上进行评估,以了解它在哪些方面表现良好,在哪些方面存在局限性。通过这些评估,我们可以深入了解改进的机会。
我以用户身份在卫星图像上测试了 SAM2,以检测田地边界。我发现自动模式只能检测到几个区块,而用户输入点的性能则明显提高。不过,田地边界仍然排除了一些斑块。提高图像分辨率,或根据植被指数将图像从 RGB 转换为单一波段,或改变预训练模型,都可能提高算法的性能。


