动画可以有趣地展示某种现象。相比于静态图表,人们更容易被动画和交互式的图表所吸引。在描绘时间序列数据时,动画更有意义,例如多年来股票价格的波动,过去十年气候的季节性变化和和趋势,因为我们可以看到特定参数如何随时间变化。

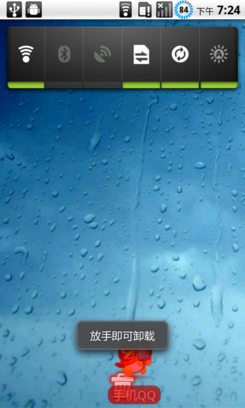
上图是用Matplotlib实现的雨滴模拟,Matplotlib库被人们亲切地称为Python可视化包的祖父。Matplotlib通过设置50个散射点的比例和不透明度的动画来模拟地表的雨滴。如今,python拥有大量强大的可视化工具,如plotly、bokeh、altair等等。这些库能够实现最先进的动画和交互。本文的目在于介绍matlibplot这个库的中不为人熟悉的一面,那就是动画。让我们一窥matplotlib的动画绘制。
概述
Matplotlib是一个python 2D绘图库,也是最流行的库之一。大多数人都是从Matplotlib开始他们的数据可视化之旅。使用matplotlib可以轻松生成plot图、柱状图、功率谱、柱状图、误差图、散点图等。它还与Pandas和Seaborn等库无缝集成,以创建更复杂的可视化效果。
Matplotlib的一些优点是:
- 它的设计类似于matlab,因此在两者之间切换相当容易。
- 包含许多渲染后端。
- 几乎可以绘制任何种类的图表。
- 已经存在了十多年世界,具有巨大的用户基础。
然而,也有一些方面,Matplotlib并没有那么耀眼,落后于其强大的对手。
- Matplotlib有一个命令式API,它通常过于冗长。
- 有时风格欠佳。
- 对Web和交互式图形的支持不足。
- 对于大型和复杂的数据,速度通常较慢。
为了快速复习一下matplotlib的用法,这里有一个来自Datacamp的Cheat sheet.
动起来
matplotlib的动画基础类实现了动画的绘制。它提供了一个框架,内建动画功能。由两个主要的接口的实现:
FuncAnimation 通过周期性地调用函数func来制作动画。ArtistAnimation:使用一个固定的Artist对象绘制动画.
在这两种方法中, FuncAnimation用起来最方便,这是它的文档。
环境依赖
必要:安装numpy和matplotlib
可选:为了保存动画为mp4或gif格式,需要 ffmpeg or imagemagick (很多linux发行版自带).
入门:移动的sin曲线
这个例子来自于Matplotlib Animation tutorial,展示如何使用FuncAnimation创建一个基本的动画。
import numpy as np
from matplotlib import pyplot as plt
from matplotlib.animation import FuncAnimation
plt.style.use('seaborn-pastel')fig = plt.figure()
ax = plt.axes(xlim=(0, 4), ylim=(-2, 2))
line, = ax.plot([], [], lw=3)def init():line.set_data([], [])return line,
def animate(i):x = np.linspace(0, 4, 1000)y = np.sin(2 * np.pi * (x - 0.01 * i))line.set_data(x, y)return line,anim = FuncAnimation(fig, animate, init_func=init,frames=100, interval=20, blit=True)anim.save('sine_wave.gif', writer='imagemagick')
运行之后,将在当前目录下生成一个gif文件。
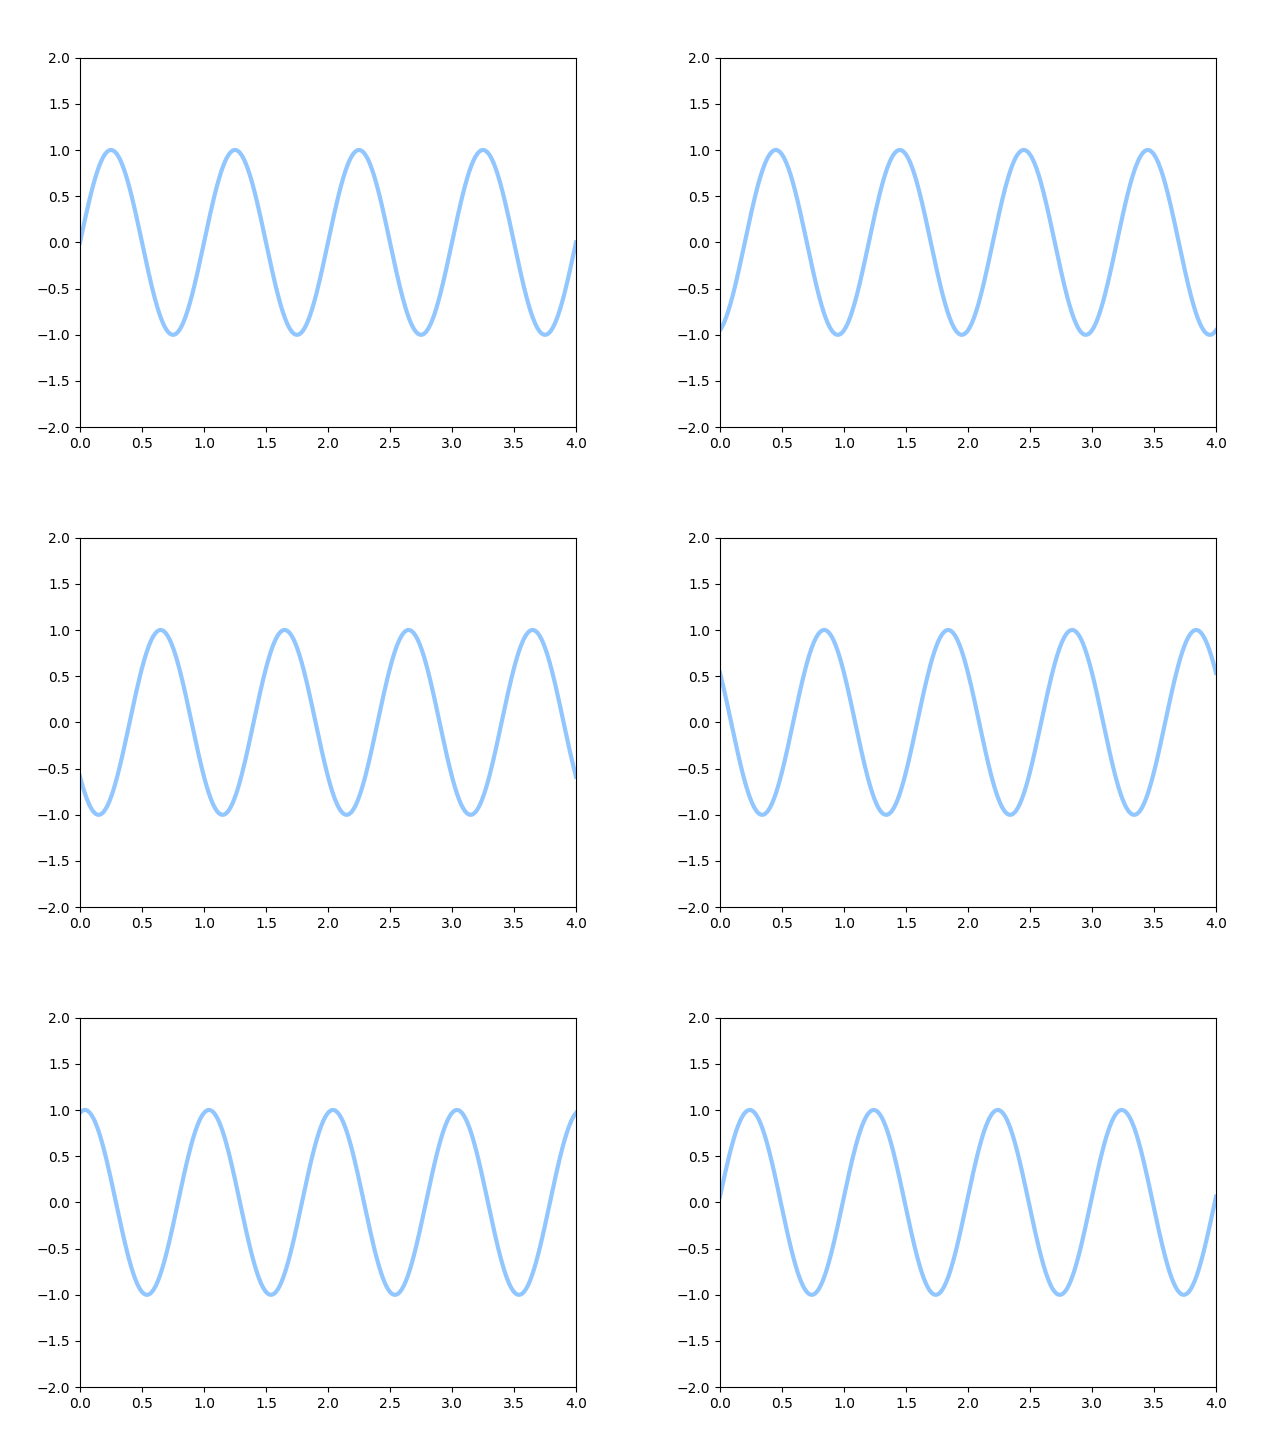
解析:
在第7-9行,我们创建了一个图像窗口,设置了坐标轴的范围。关键在于,在第9行创建了一个空的line对象,之后将通过更新line的数据,实现动画效果。
在第11-13行,我们创建了初始化函数init,这个函数其实什么也没干,给了line对象空的数据。
第14-18行,我们第难以了动画函数animate,入参i是动画帧序号,根据i计算新的sin曲线数据,更新到line对象。
在第20行,我们利用之前所说的FuncAnimation()函数创建了对象anim,初始化时传入了figure对象,init()函数和animate()函数,以及帧数和更新时间。由于我们的sin函数是波长为1,显示4个周期,因此循环一个周期,也就是100帧,就可以实现前后相接的循环效果了。
示波器上的李萨如图形
画一个一个正弦信号毕竟too simple. 大学课堂的物理课使用示波器,肯定做过这样的实验:在阴极射线管示波器上使用x-y模式,x通道的正弦信号频率为f1,y通道的频率为f2,两者之间存在关系,随着n和m的不同,残留的光辉会变幻出各种图形,称之为李萨如(Liaasjous)图形。不管大家还记不记得,我们这就来画一个,直接上代码。
import matplotlib.pyplot as plt
import matplotlib.animation as animation
import numpy as np
plt.style.use('dark_background')fig = plt.figure()
ax = plt.axes(xlim=(-50, 50), ylim=(-50, 50))
line, = ax.plot([], [], lw=2) # initialization function
def init(): # creating an empty plot/frame line.set_data([], []) return line, # lists to store x and y axis points
xdata, ydata = [], [] #simulate ghost effect of oscilloscope
def ghostImage(x,y):xdata.append(x)ydata.append(y)if len(xdata)>60:del xdata[0]del ydata[0]return xdata,ydata# animation function
def animate(i): # t is a parameter t = i/100.0 # x, y values to be plotted x = 40*np.sin(2*2*np.pi*(t+0.3)) y = 40*np.cos(3*2*np.pi*t) # appending new points to x, y axes points list line.set_data(ghostImage(x,y)) return line, # setting a title for the plot
plt.title('Creating a Lissajous figure with matplotlib')
# hiding the axis details
plt.axis('off') # call the animator
anim = animation.FuncAnimation(fig, animate, init_func=init, frames=400, interval=20, blit=True) # save the animation as gif file
anim.save('figure.gif',writer='imagemagick') 
三维动画
三维图像具有更多的信息,如果让三维图像的观察角度运动起来,那将十分有意思。
现在我们用另外一种暴力的思路制作三维动画:首先绘制一幅三维图,然后每次改变一下视角,成为一帧。这里不再使用什么FuncAnimation函数了,直接将每帧保存成静态图片,然后合成为gif图。这样的好处在于,只要在原来的基础上增加一个循环,保存成多幅图像,就能合成动画。
我们来读入一幅图片test.jpg,用plot_surface画成3D图;然后在程序中改变视角,保存成多幅图片(运行前要新建一个目录animFram,用于写入图像)。
from mpl_toolkits.mplot3d import Axes3D
import matplotlib.pyplot as plt
from PIL import Image
#import matplotlib.animation as animation
import numpy as np img = Image.open('test.jpg')
grayImg = img.convert('L')
width, height = grayImg.size
X, Y = np.meshgrid(np.arange(0,width), np.arange(0,height))
#print(X)
Z = np.array(grayImg)
fig = plt.figure()
ax = fig.gca(projection='3d')
ax.plot_surface(X,Y,Z, rstride=1, cstride=1, cmap='viridis')
transition = lambda x,N: (1+np.sin(-0.5*np.pi+2*np.pi*x / (1.0*N)))/2.0
for i in range (40):horiAngle=45+50*transition(i,40)vertAngle=50+43*transition(i,40)ax.view_init(vertAngle,horiAngle)filename='animFram/'+str('%03d'%i)+'.png'plt.savefig(filename, dpi=96)
然后使用ImageMagick的convert命令,将多幅静态帧转换成gif,使用以下命令:
convert -delay 10 *.png gif.gif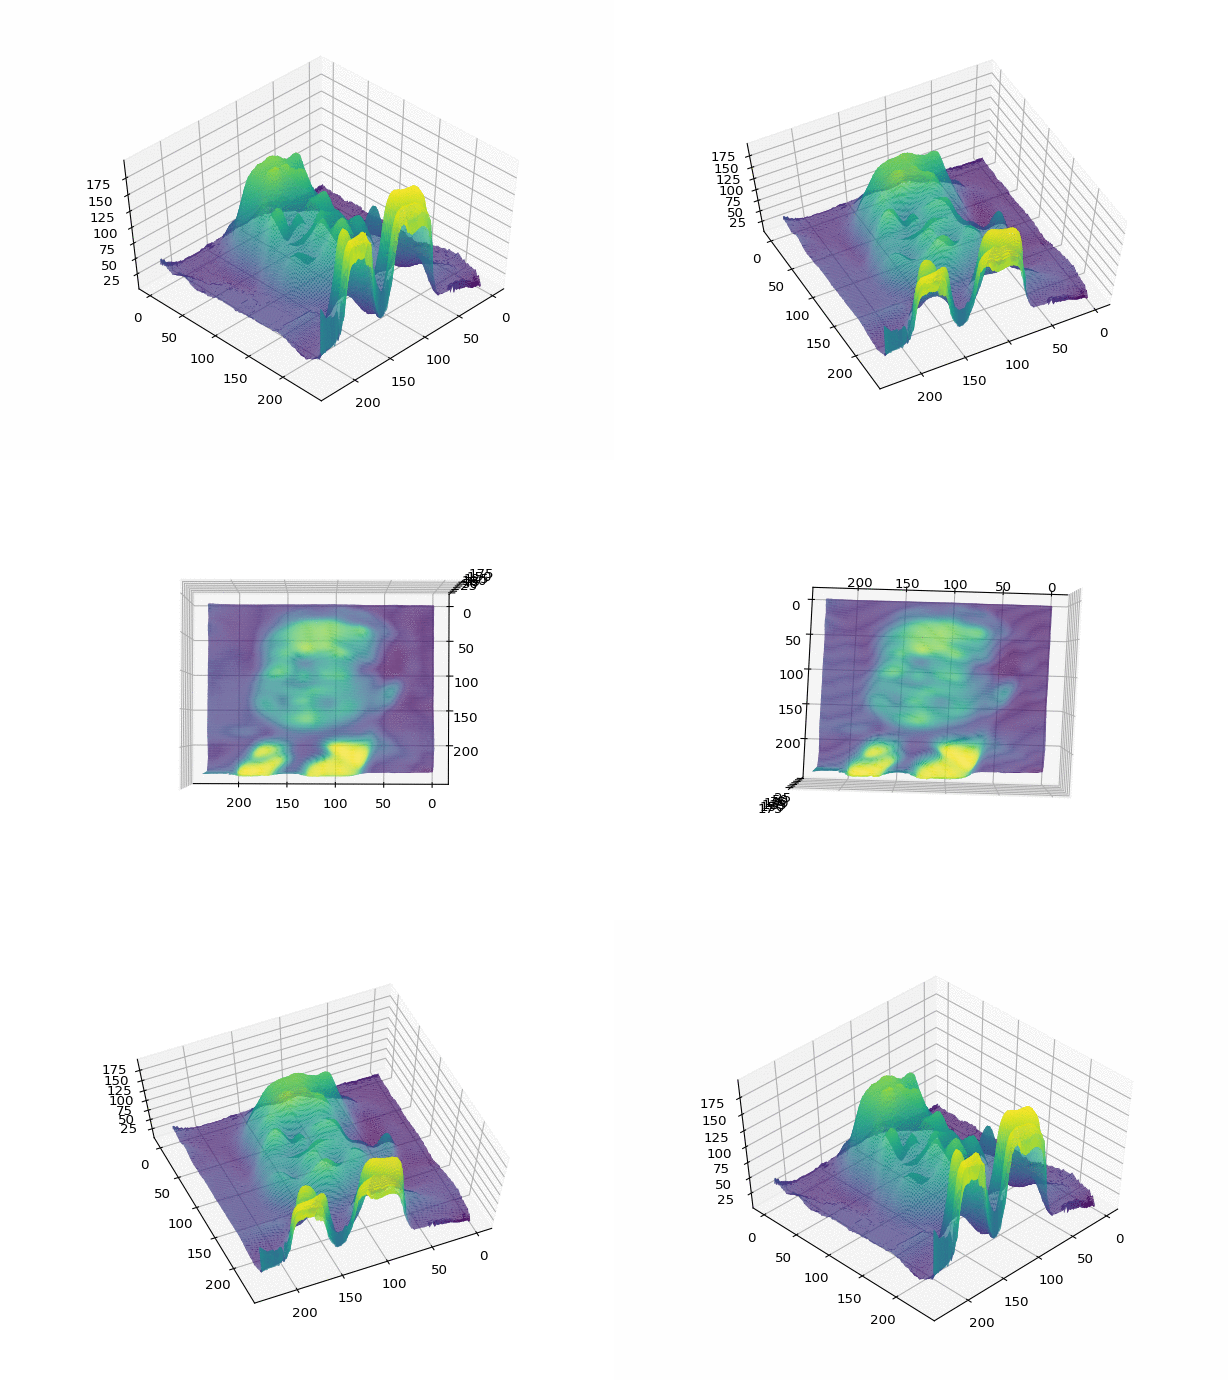
好了那就介绍到这,足够用了,外面有人敲门。
Ref:
https://towardsdatascience.com/animations-with-matplotlib-d96375c5442c
