【云原生•监控】基于Prometheus实现自定义指标弹性伸缩(HPA)
什么是弹性伸缩
「Autoscaling即弹性伸缩,是Kubernetes中的一种非常核心的功能,它可以根据给定的指标(例如 CPU 或内存)自动缩放Pod副本,从而可以更好地管理和利用计算资源,提高系统的可用性和性能,同时减少开销和成本。弹性伸缩可以解决服务负载存在较大波动或资源实际使用与预估之间的差距。」
在Kubernetes集群中提供了三种弹性伸缩技术:
「CA(Cluster Autoscaler)」:Node级别自动扩/缩容
「HPA(Horizontal Pod Autoscaler)」:Pod个数自动扩/缩容
「VPA(Vertical Pod Autoscaler)」:Pod配置自动扩/缩容,主要是CPU、内存配置
「Node自动扩/缩容」
Cluster AutoScaler定期检测是否有充足的资源来调度新创建的Pod,当资源不足时会调用Cloud Provider创建新的Node。Cluster AutoScaler也会定期监测 Node的资源使用情况,当一个Node长时间资源利用率都很低时(低于50%)自动将其所在虚拟机从集群中删除。此时,原来的Pod会自动调度到其他Node上面。
Node的增减可能会影响整个kubernetes集群的稳定性,一旦出现问题会影响整个集群上部署的所有业务程序,所以,生产中针对Node节点的扩缩容一般还是谨慎使用,当确实需要对Node进行扩缩容时,往往通过人工执行脚本完成。
「Pod的垂直扩/缩容(VPA)」
VPA全称Vertical Pod Autoscaler,即Pod的垂直自动伸缩,它根据容器资源使用率自动设置CPU和内存的requests,从而允许在节点上进行适当的调度,以便为每个Pod提供适当的资源。它既可以缩小过度请求资源的容器,也可以根据其使用情况随时提升资源不足的容量。
「目前,VPA技术成熟度还不够,是Kubernetes比较新的功能,更新正在运行的Pod资源配置是VPA的一项试验性功能,会导致Pod的重建和重启,而且有可能被调度到其他的节点上。」
「Pod的水平扩/缩容(HPA)」
HPA全称Horizontal Pod Autoscaler,即Pod的水平自动伸缩,根据资源利用率或者自定义指标自动调整Pod的副本数,实现Pod的扩容、缩容,让部署的规模接近于实际服务的负载。
HPA弹性伸缩原理
Horizontal Pod Autoscaler功能最初是在Kubernetes 1.1中引入并不断发展,目前HPA已经支持了autoscaling/v1、autoscaling/v2beta1和autoscaling/v2beta2三个大版本。
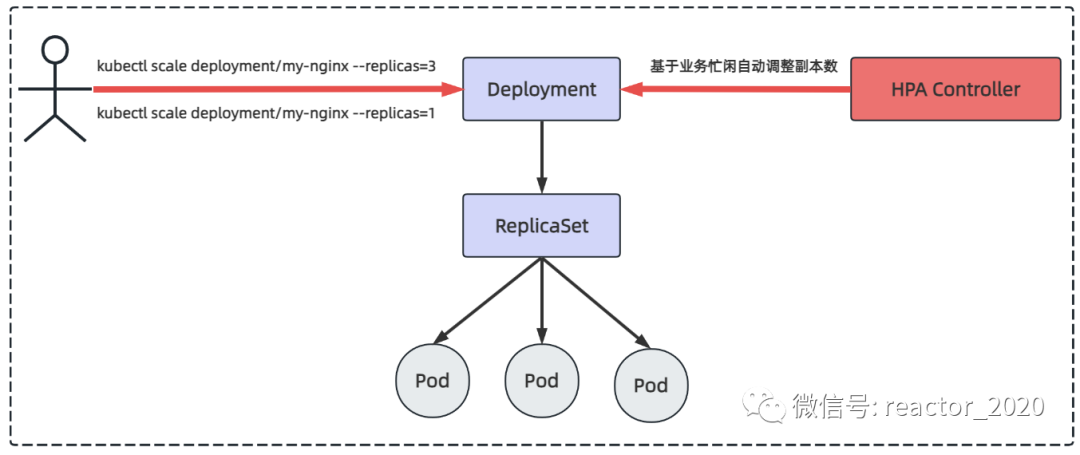
常规场景下,比如晚上业务压力较小情况下,可以使用kubectl scale指令将Pod副本数设置为1;当白天上班高分期业务压力大时使用kubectl scale指令将Pod的副本数设置为3,但这些操作都是人为介入执行的。而HPA控制器则是基于业务的指标判断业务忙闲自动基于算法计算出当前多少Pod副本数运行比较合适,自动调整Pod的副本数。
Kubernetes HPA v2相对于v1版本进行了一些重大改进。其中最显著的改进是引入了「多指标」自动扩缩容,即可以同时根据多种指标(如 CPU使用率、内存使用率、网络负载等)来进行自动扩缩容决策。此外,HPA v2还增加了支持「自定义指标」的能力,使得用户可以根据自己的需求定义和使用自己的指标。总的来说,Kubernetes HPA v2是一个更加成熟、更加灵活和可定制的自动扩缩容机制。
「HPA弹性伸缩的核心机制:自动根据业务忙闲来调整业务工作负载的副本数。这里主要涉及到两个关键点:」
「如何识别业务的忙闲程度」
「使用控制Pod副本数调整」
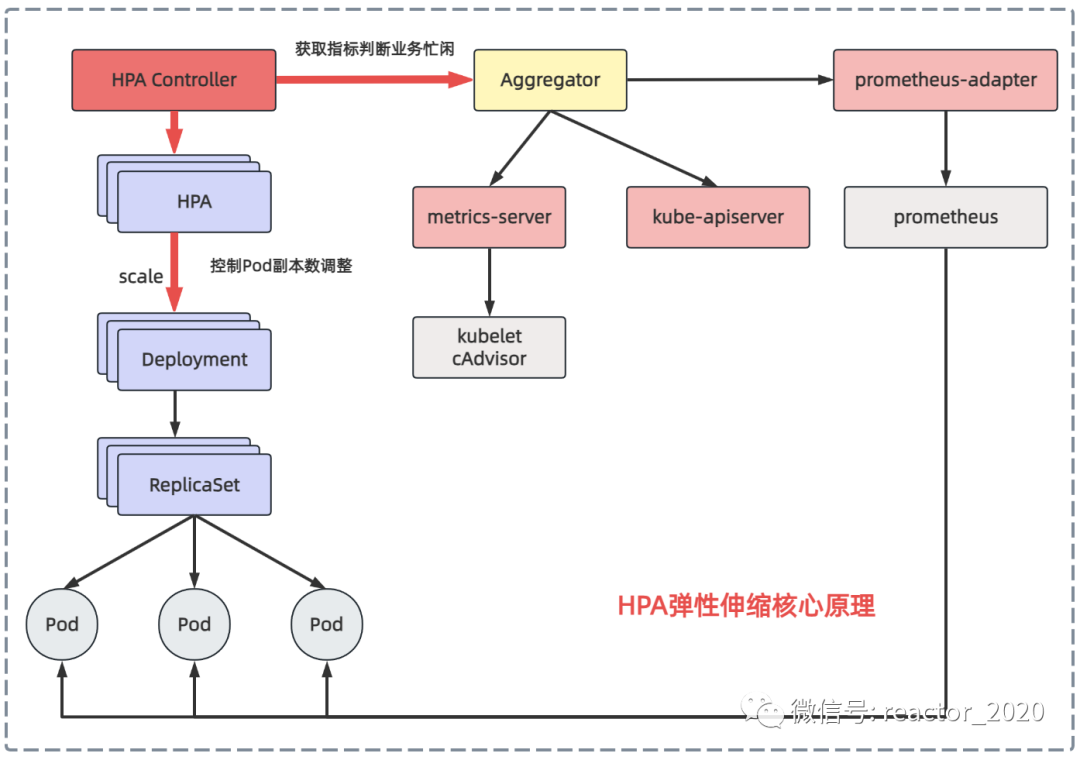
「我们先来看下第一个问题:如何识别业务的忙闲程度?」
之前介绍kubernetes集群监控时介绍过metrics-server组件可以从集群中所有节点的kubelet组件中cAdvisor上获取到底层容器运行时指标,然后聚合后就可以通过kubectl top node/pod查看CPU、内存资源使用情况,也可以通过kubectl get --raw /apis/metrics.k8s.io/v1beta1/nodes 接口访问访问获取。所以,HPA控制器可以通过metrics-server组件获取Pod的CPU、内存使用率识别业务忙闲。
Kubernestes 1.7引入了聚合层(Aggregator),允许第三方应用程序通过注册自己为API插件来扩展Kubernestes API。metrics-server组件注册到聚合层然后就可以像访问kube-apiserver接口一样访问metrics-server后端服务的接口。
Kubernetes在kube-apiserver服务中引入了一个API聚合层,用于将扩展API的访问请求转发到用户服务的功能。比如,当你访问apis/metrics.k8s.io/v1beta1的时候,aggregator组件会基于group和version转发到后端metrics-server服务上,聚合层只是相当于代理层。通过这种方式,我们就可以很方便地扩展Kubernetes的API。
从metrics-server获取CPU、内存指标比较单一,kubernetes集群监控事实标准是prometheus,如果可以从prometheus获取指标用来识别业务忙闲程度,弹性伸缩灵活性就会大大增加。prometheus-adapter组件就可以实现这个功能,它从prometheus拉取指标转换成kubernetes api接口识别的数据格式,并将其注册到聚合层,这样kubernetes集群中其它服务就可以通过/apis/访问。
「再来看第二个问题:如何控制Pod副本数调整?」
HPA控制器会定期执行每个HPA对象的reconcile方法,主要包含如何操作:
获取当前指标数据:从metrics-server获取CPU使用率、内存使用率或从prometheus-adapter获取自定义指标数据;
Pod副本数计算:将获取的指标数据和目标期望比较,判断是要扩容、缩容还是不变,若不需要要进行扩缩容调整就直接返回当前副本数,否则才使用HPA metrics 目标类型对应的算法来计算出deployment的目标副本数;
更新Pod副本数:如果上步骤计算出的Pod目标副本数与当前副本数量不一致时,即需要进行扩/缩容的情况,则HPA控制器就向Deploymen发起scale操作,调整当前副本数,完成扩/缩容操作;
监控调整效果:最终实现尽可能将deployment下的每个pod的最终metrics指标(平均值)基本维持到用户期望的水平,HPA会继续监控新的Pod副本数量对指标数据的影响,并根据需要进行进一步的调整。
❝reconcile定时间隔默认15秒,可以通过horizontal-pod-autoscaler-sync-period配置。
❞
基于CPU指标的HPA
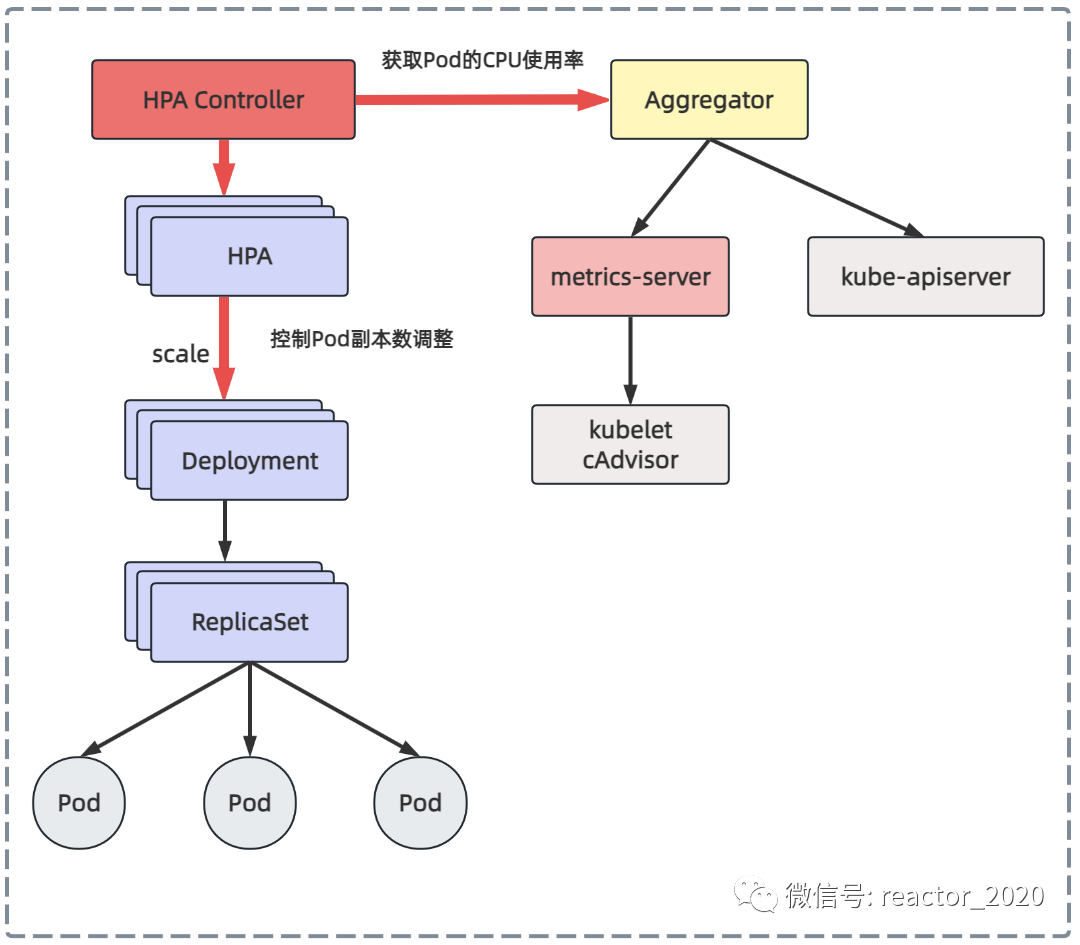
HPA v1版本支持CPU使用率、内存使用率的弹性伸缩,内存使用率一般缓存影响很难真实反映系统负载,所以,一般使用CPU使用率指标来进行弹性伸缩。容器的CPU使用率可以通过聚合层API代理到后端metrics-server服务,metrics-server向所有的kubelet组件发送请求,通过cAdvisor收集到所有容器的CPU、内存运行信息,这样HPA控制器就可以获取到Pod的CPU使用率,然后基于CPU使用率进行弹性伸缩。
「1、基于Deployment创建Pod:」
#vi deploy-for-hpa_cpu.yml
apiVersion: apps/v1
kind: Deployment
metadata:name: web
spec:replicas: 1selector:matchLabels:app: nginx-phptemplate:metadata:labels:app: nginx-phpspec:containers:- image: lizhenliang/nginx-phpname: javaresources: requests:memory: "300Mi"cpu: "250m"
---
apiVersion: v1
kind: Service
metadata:name: web
spec:ports:- port: 80protocol: TCPtargetPort: 80selector:app: nginx-php
「2、创建:」
[root@k8s-01 autoscaling]# kubectl apply -f deploy-for-hpa_cpu.yml -n demo01
[root@k8s-01 autoscaling]# kubectl get pod -n demo01
NAME                                  READY   STATUS    RESTARTS   AGE
web-84885d5959-fbtxt                 1/1     Running   0          29s
「3、HPA策略文件:」
# vi hpa_for_cpu.yml
apiVersion: autoscaling/v1
kind: HorizontalPodAutoscaler
metadata:name: web
spec:#扩/缩容副本范围maxReplicas: 3minReplicas: 1#指定扩容的DeploymentscaleTargetRef: apiVersion: apps/v1kind: Deploymentname: webtargetCPUUtilizationPercentage: 60❝❞
targetCPUUtilizationPercentage: 60表示:当Pod整体的资源利用率超过60%的时候,会进行扩容。
「4、创建HPA:」
[root@k8s-01 autoscaling]# kubectl apply -f hpa_for_cpu.yml -n demo01
horizontalpodautoscaler.autoscaling/web created
[root@k8s-01 autoscaling]# kubectl get hpa -n demo01
NAME              REFERENCE                       TARGETS   MINPODS   MAXPODS   REPLICAS   AGE
web Deployment/web 0%/60% 1 3 1 44s❝TARGETS一栏显示指标情况,前面0%表示当前Pod得到整体CPU资源使用率,因为没有任何HTTP请求,所以是0%;60%则是扩/缩容阈值。
MINPODS、MAXPODS:指定hpa扩/缩容
❞
「5、压测:」
[root@k8s-01 autoscaling]# yum install httpd-tools
[root@k8s-01 autoscaling]# kubectl get svc -n demo01
NAME                 TYPE        CLUSTER-IP      EXTERNAL-IP   PORT(S)    AGE
web                  ClusterIP   10.96.237.204   <none>        80/TCP     5d20h
[root@k8s-01 autoscaling]# ab -n 100000 -c 100  http://10.96.237.204/status.php
「6、观察扩/缩容:」
压测几十秒后,查看hpa后发现整体CPU使用率173%,超过60%目标值,但是replicas还是1,并没有扩容:
[root@k8s-01 autoscaling]# kubectl get hpa -n demo01
NAME              REFERENCE                       TARGETS    MINPODS   MAXPODS   REPLICAS   AGE
metrics-app-hpa   Deployment/sample-httpserver2   200m/2     1         3         1          46h
web               Deployment/web                  173%/60%   1         3         1          75s
再等会查看到replicas=3,触发了扩容操作:
[root@k8s-01 autoscaling]# kubectl get hpa -n demo01
NAME              REFERENCE                       TARGETS   MINPODS   MAXPODS   REPLICAS   AGE
metrics-app-hpa   Deployment/sample-httpserver2   200m/2    1         3         1          46h
web               Deployment/web                  15%/60%   1         3         3          76s
查看Pod信息:
[root@k8s-01 autoscaling]# kubectl get pod -n demo01
NAME READY STATUS RESTARTS AGE
web-84885d5959-d9l4h 1/1 Running 0 90s
web-84885d5959-fbtxt 1/1 Running 0 6m9s
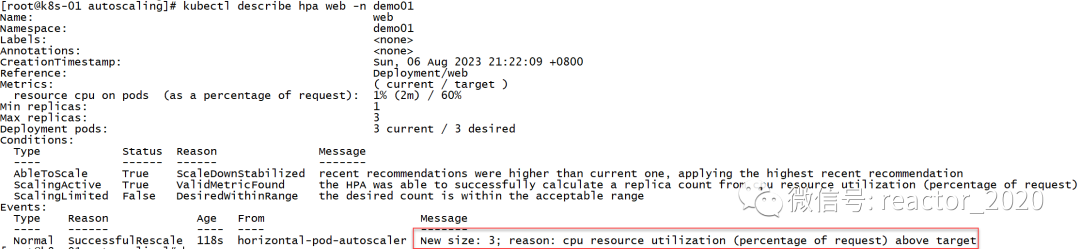
web-84885d5959-xgn4n 1/1 Running 0 90skubectl describe hpa信息,可以看到有一条副本数扩到3的消息事件:
停止压测后,CPU使用率压力会降下来,大概等个几分钟后,又会触发缩容操作,replicas又会被设置成1:
[root@k8s-01 autoscaling]# kubectl get hpa -n demo01
NAME REFERENCE TARGETS MINPODS MAXPODS REPLICAS AGE
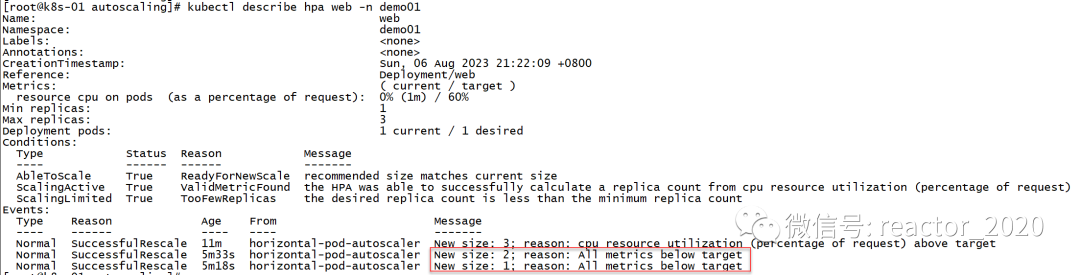
web Deployment/web 0%/60% 1 3 1 7m59skubectl describe hpa查看hpa信息,会发现有两条缩容消息事件,一条显示是副本数从3缩容到2消息事件,另一条显示副本数从2缩容到1消息事件:
基于Prometheus自定义指标的HPA
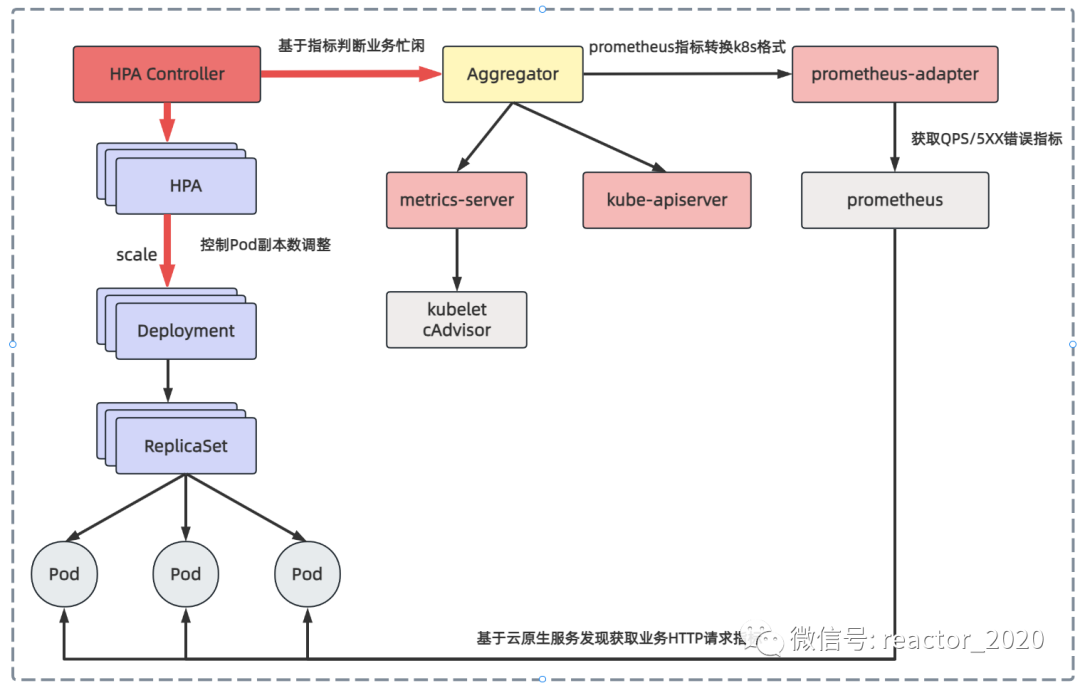
基于metrics-server组件获取的CPU使用率、内存使用率弹性伸缩灵活性稍差,如果想根据自定义指标,如HTTP请求的QPS、5XX错误数等,在云原生领域监控基本就是Prometheus。自定义指标由Prometheus来提供,再利用prometheus-adpater聚合到apiserver,实现从metric-server组件获取CPU、内存同样的效果。
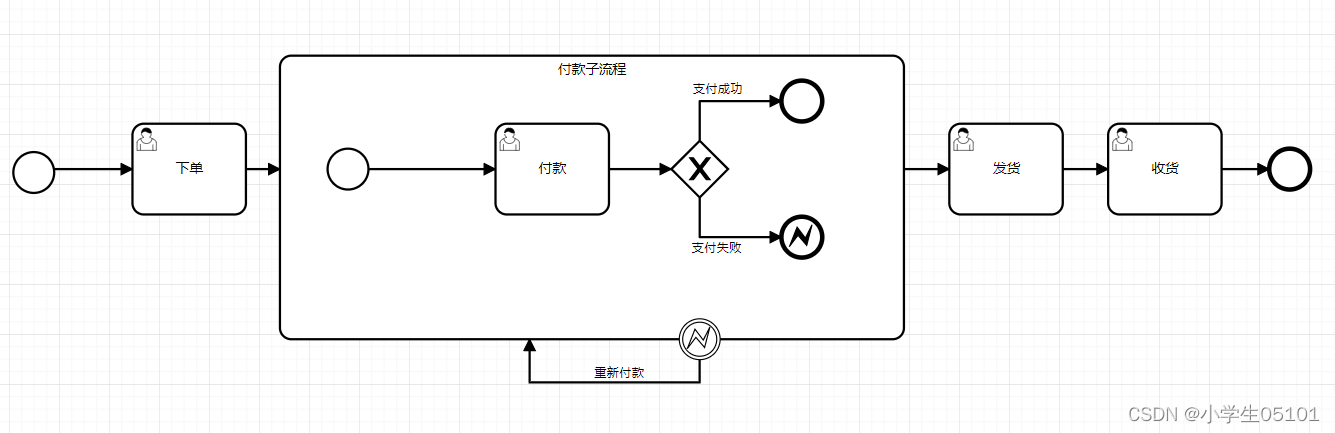
基于Prometheus自定义指标的HPA核心流程如下图:
prometheus-adapter组件部署
「1、安装prometheus-adapter组件:」
[root@k8s-01 ~]# helm repo add stable http://mirror.azure.cn/kubernetes/charts
"prometheus-community" has been added to your repositories
[root@k8s-01 ~]# helm repo update
Hang tight while we grab the latest from your chart repositories...
...Successfully got an update from the "prometheus-community" chart repository
Update Complete. ⎈ Happy Helming!⎈
[root@k8s-01 ~]# helm repo list
NAME                    URL
stable                  http://mirror.azure.cn/kubernetes/charts   [root@k8s-01 ~]# helm install prometheus-adapter stable/prometheus-adapter --namespace monitoring --set prometheus.url=http://prometheus,prometheus.port=9090
NAME: prometheus-adapter
LAST DEPLOYED: Tue Aug  1 23:44:08 2023
NAMESPACE: monitoring
STATUS: deployed
REVISION: 1
TEST SUITE: None
NOTES:
prometheus-adapter has been deployed.
In a few minutes you should be able to list metrics using the following command(s):kubectl get --raw /apis/custom.metrics.k8s.io/v1beta1❝curl http://192.168.31.160:32478/metrics
❞
「2、查看组件安装是否成功:」
[root@k8s-01 ~]# kubectl get pod -n monitoring
NAME                                      READY   STATUS    RESTARTS   AGE
prometheus-adapter-76d8fb4549-6vzzg       1/1     Running   0          3m25s[root@k8s-01 ~]# kubectl get apiservices
NAME                                   SERVICE                          AVAILABLE   AGE
...
v1beta1.custom.metrics.k8s.io          monitoring/prometheus-adapter   True        2m28s[root@k8s-01 ~]# kubectl get --raw /apis/custom.metrics.k8s.io/v1beta1 |jq|more
{"kind": "APIResourceList","apiVersion": "v1","groupVersion": "custom.metrics.k8s.io/v1beta1","resources": [{"name": "namespaces/file_descriptors","singularName": "","namespaced": false,"kind": "MetricValueList","verbs": ["get"]},{"name": "namespaces/kube_ingress_annotations","singularName": "","namespaced": false,"kind": "MetricValueList","verbs": ["get"]},
...❝查看prometheus-adapter组件的日志,注意不要出现类似http://prometheus:9090/api/v1/series?match%5B%5D=%7B__name__%3D~%22%5Econtainer_.%2A%22%2Ccontainer%21%3D%22POD%22%2Cnamespace%21%3D%22%22%2Cpod%21%3D%22%22%7D&start=1690905427.938 timeout 这样错误。
❞
helm卸载操作如下:
[root@k8s-01 ~]# helm ls -n kube-system
NAME                    NAMESPACE       REVISION        UPDATED                                 STATUS          CHART                           APP VERSION
prometheus-adapter      kube-system     1               2023-08-01 23:44:08.027994527 +0800 CST deployed        prometheus-adapter-4.3.0        v0.11.0
[root@k8s-01 ~]# helm uninstall prometheus-adapter -n kube-system
release "prometheus-adapter" uninstalled
部署golang应用
「1、初始化golang项目工程:」
[root@swarm-manager ~]# mkdir metrics
[root@swarm-manager ~]# cd metrics/
[root@swarm-manager metrics]# go mod init metrics「2、编写metrics.go:」
package mainimport ("github.com/prometheus/client_golang/prometheus""github.com/prometheus/client_golang/prometheus/promhttp""net/http""strconv"
)func main() {metrics := prometheus.NewCounterVec(prometheus.CounterOpts{Name: "http_requests_total",Help: "Number of total http requests",},[]string{"status"},)prometheus.MustRegister(metrics)http.HandleFunc("/", func(w http.ResponseWriter, r *http.Request) {path := r.URL.PathstatusCode := 200switch path {case "/metrics":promhttp.Handler().ServeHTTP(w, r)default:w.WriteHeader(statusCode)w.Write([]byte("Hello World!"))}metrics.WithLabelValues(strconv.Itoa(statusCode)).Inc()})http.ListenAndServe(":3000", nil)
}❝该go项目主要通过/metrics端点暴露http_requests_total指标。
❞
「3、本地编译打包:」
[root@swarm-manager metrics]# go mod tidy
[root@swarm-manager metrics]# go build -o metrics metrics.go
「4、创建镜像,并推送docker hub上:」
编写Dockerfile:
FROM golang:latest
MAINTAINER simon "30743905@qq.com"
RUN mkdir -p /app
WORKDIR /app
COPY ./metrics /app
EXPOSE 3000RUN chmod +x ./metrics
ENTRYPOINT ["./metrics"]
构建镜像:
docker build -t metrics .「5、k8s部署:」
# sample-httpserver-deployment.yaml
apiVersion: apps/v1
kind: Deployment
metadata:labels:app: sample-httpservername: sample-httpservernamespace: default
spec:replicas: 1selector:matchLabels:app: sample-httpserverstrategy: {}template:metadata:annotations:prometheus.io/scrape: "true"prometheus.io/path: /metricsprometheus.io/port: "3000"labels:app: sample-httpserverspec:containers:- image: addozhang/httpserver-n-metrics:latestname: httpserver-n-metricsports:- containerPort: 3000resources:requests:memory: '300Mi'
---
apiVersion: v1
kind: Service
metadata:name: sample-httpserverlabels:app: sample-httpserver
spec:ports:- name: webport: 3000targetPort: 3000selector:app: sample-httpserver
「6、接口获取指标正常:」
[root@k8s-01 demo01]# kubectl get svc -n demo01
NAME                TYPE        CLUSTER-IP      EXTERNAL-IP   PORT(S)    AGE
nginx-service       ClusterIP   None            <none>        80/TCP     249d
sample-httpserver   ClusterIP   10.96.153.13    <none>        3000/TCP   32s
tomcat-service      ClusterIP   None            <none>        8080/TCP   249d
web                 ClusterIP   10.96.237.204   <none>        80/TCP     47h
[root@k8s-01 demo01]# curl 10.96.153.13:3000/metrics
# HELP go_gc_duration_seconds A summary of the pause duration of garbage collection cycles.
# TYPE go_gc_duration_seconds summary
go_gc_duration_seconds{quantile="0"} 3.5147e-05
go_gc_duration_seconds{quantile="0.25"} 3.8423e-05
go_gc_duration_seconds{quantile="0.5"} 4.1267e-05
go_gc_duration_seconds{quantile="0.75"} 5.0566e-05
go_gc_duration_seconds{quantile="1"} 9.0761e-05
go_gc_duration_seconds_sum 0.001240037
go_gc_duration_seconds_count 25
......
「7、prometheus配置抓取job:」
- job_name: 'app'kubernetes_sd_configs:- role: podrelabel_configs:- action: keepsource_labels: [__meta_kubernetes_pod_annotation_prometheus_io_scrape]regex: true- source_labels: [__meta_kubernetes_namespace]target_label: namespace- source_labels: [__meta_kubernetes_pod_name]target_label: pod「8、指标抓取验证:」
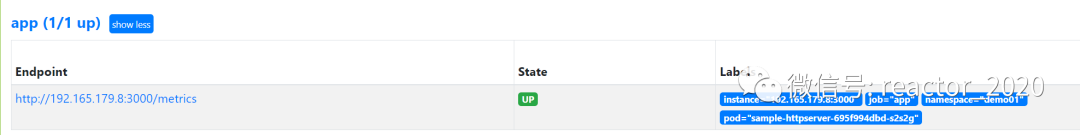
在prometheus target可以查看到部署的应用指标接入成功:
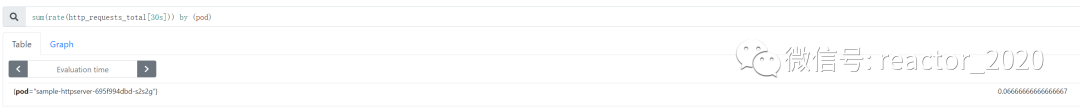
使用PromQL查询:sum(rate(http_requests_total[30s])) by (pod)
hpa资源创建
「1、创建hpa:」
# vi app-hpa-v2.yml
apiVersion: autoscaling/v2beta2
kind: HorizontalPodAutoscaler
metadata:name: metrics-app-hpa namespace: demo01
spec:scaleTargetRef:apiVersion: apps/v1kind: Deploymentname: sample-httpserverminReplicas: 1maxReplicas: 3metrics:- type: Podspods:metric:name: http_requests_qpstarget:type: AverageValueaverageValue: 2000m # 2000m 即2个/秒「2、prometheus-adapter组件配置自定义指标的计算规则,告诉prometheus-adapter如何从prometheus获取指标并计算出我们需要的指标:kubectl edit cm prometheus-adapter -n monitoring」
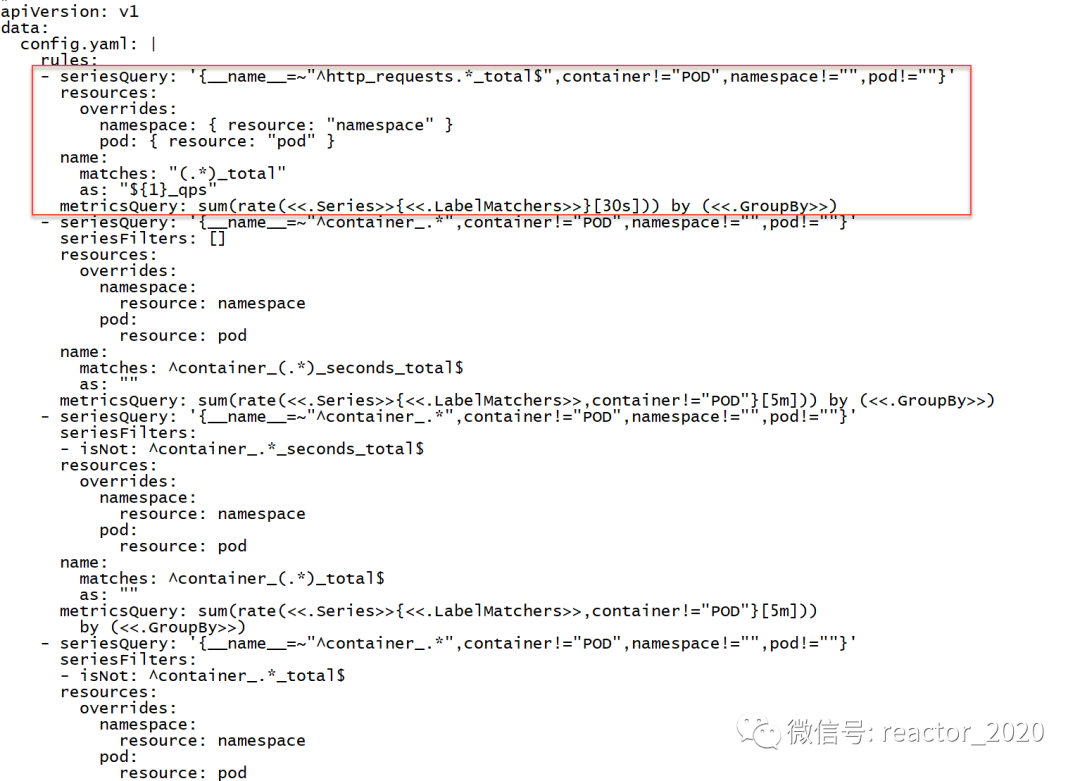
❝prometheus-adapter不能动态加载配置,需要kubectl delete pod prometheus-adapter-xx,让Pod重启加载最新配置。
❞
「3、可以访问api-server获取到prometheus-adapter计算生成的新指标:」
[root@k8s-01 ~]# kubectl get --raw '/apis/custom.metrics.k8s.io/v1beta1/namespaces/demo01/pods/*/http_requests_qps' | jq
{"kind": "MetricValueList","apiVersion": "custom.metrics.k8s.io/v1beta1","metadata": {"selfLink": "/apis/custom.metrics.k8s.io/v1beta1/namespaces/demo01/pods/%2A/http_requests_qps"},"items": [{"describedObject": {"kind": "Pod","namespace": "demo01","name": "sample-httpserver-695f994dbd-s2s2g","apiVersion": "/v1"},"metricName": "http_requests_qps","timestamp": "2023-08-02T15:32:56Z","value": "66m","selector": null}]
}❝「注意:这里的
❞value: 66m,值的后缀“m” 标识milli-requests per seconds,所以这里的 66m 的意思是 0.06/s 每秒0.06个请求。」
「4、prometheus-adapter有了指标数据,就可以创建hpa基于该指标:kubectl apply -f app-hpa-v2.yml」
# vi app-hpa-v2.yml
apiVersion: autoscaling/v2beta2
kind: HorizontalPodAutoscaler
metadata:name: metrics-app-hpanamespace: demo01
spec:scaleTargetRef:apiVersion: apps/v1kind: Deploymentname: sample-httpserverminReplicas: 1maxReplicas: 3metrics:- type: Podspods:metric:name: http_requests_qpstarget:type: AverageValueaverageValue: 2000m   # 2000m 即2个/秒
「5、查看hpa从prometheus-adapter组件获取指标正常:」

当前Pod副本数为1:
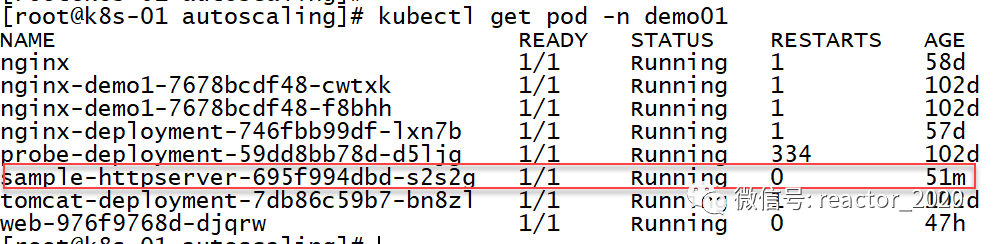
「6、接口压测:」
[root@k8s-01 ~]# kubectl get svc -n demo01
NAME                TYPE        CLUSTER-IP      EXTERNAL-IP   PORT(S)    AGE
nginx-service       ClusterIP   None            <none>        80/TCP     249d
sample-httpserver   ClusterIP   10.96.153.13    <none>        3000/TCP   8m11s
[root@k8s-01 ~]# ab -n 100000 -c 30  http://10.96.153.13:3000/metrics
This is ApacheBench, Version 2.3 <$Revision: 1430300 $>
Copyright 1996 Adam Twiss, Zeus Technology Ltd, http://www.zeustech.net/
Licensed to The Apache Software Foundation, http://www.apache.org/Benchmarking 10.96.153.13 (be patient)
Completed 10000 requests
Completed 20000 requests
「7、弹性伸缩验证:」
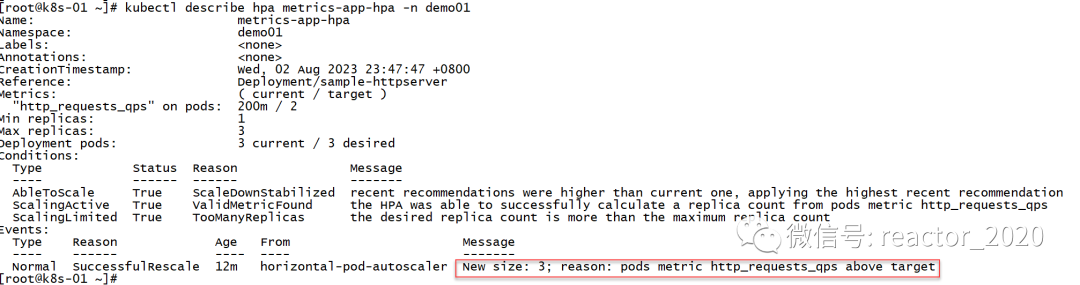
查看hpa状态,targets一栏显示当前指标到达10900m左右,斜杠后面2表示到达2就要弹性伸缩,10900m/1000=10左右,明显超过2,则replicas一栏显示当前进行扩容到最大副本数3:

查看hpa描述信息,可以看到有条Event清晰描述出有图http_requests_qps指标超过target设置的2,副本数设置为3:
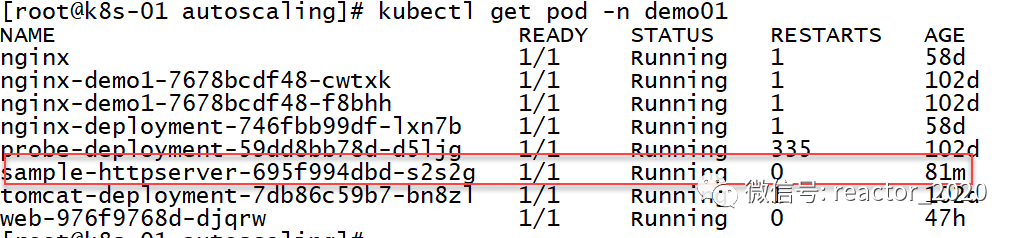
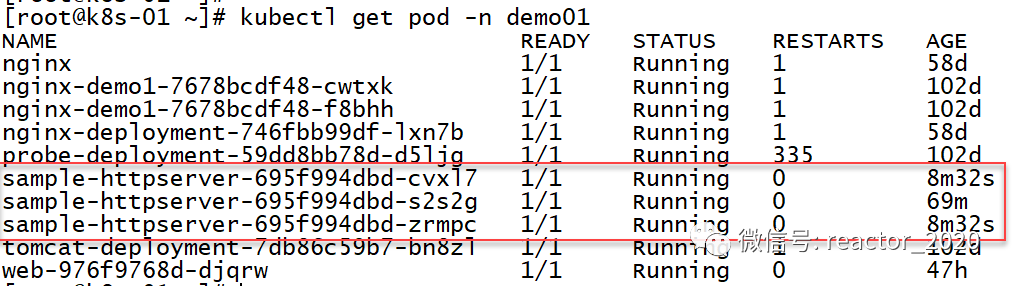
再来看pod信息,发现副本数确实扩容到3个:
「8、弹性缩容验证:」
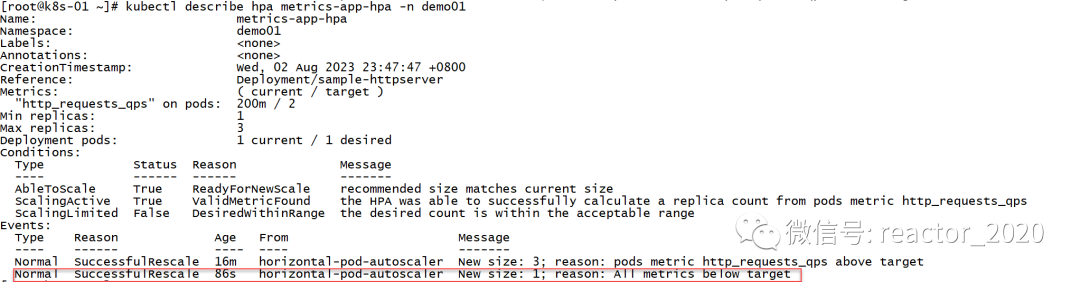
停止接口压测后,hpa指标下降,200m明显小于2,当大概平稳5分钟后,hpa开始进行缩容,将副本数从3降到1:

查看hpa描述信息,同样印证了hpa发生缩容:
再来确认下Pod已经变成1个了: