与图3.7的代码区别只在于原始信号的表达式对了一个时间偏移
代码复现如下:
clc
clear all
close all%参数设置
TBP = 100;                                              %时间带宽积
T = 10e-6;                                              %脉冲持续时间
tc = 1e-6;                                              %时间偏移量%参数计算
B = TBP/T;                                              %信号带宽
K = B/T;                                                %信号调频频率
alpha_os = 8;                                           %过采样率
F = alpha_os*B;                                         %采样率
N = 2*ceil(F*T/2);                                      %采样点数
dt = T/N;                                               %采样时间间隔
df = F/N;                                               %采样频率间隔%变量设置
t = -T/2:dt:T/2-dt;                                     %时间变量
f = -F/2:df:F/2-df;                                     %频率变量
t_out = linspace(2*t(1),2*t(end),2*length(t)-1);        %循环卷积后的信号长度%信号表达
st = exp(1j*pi*K*(t-tc).^2);                                 %chirp信号复数表达式
ht = conj(fliplr(st));                                  %时域匹配滤波器表达式
%在信号中加入高斯噪声的两种方式
% st_noise = awgn(st,-2.5,'measured');
st_noise = st+0.75*randn(1,N);
s_out_noise = conv(st_noise,ht);
s_out_noise_nor = s_out_noise/max(s_out_noise);
s_out_noise_log = 20*log10(abs(s_out_noise_nor)/max(abs(s_out_noise_nor))+eps);%绘图
figure
subplot(221),plot(t*1e+6,real(st)),axis([-3 3,-1.2 1.2])
subplot(222),plot(t_out*1e+6,s_out_noise_log),axis([-1 1,-30 5])
subplot(223),plot(t_out*1e+6,real(s_out_noise_nor)),axis([-3 3,-0.5 1.5])
subplot(224),plot(t_out*1e+6,angle(s_out_noise_nor)),axis([-0.7 0.7,-5 5])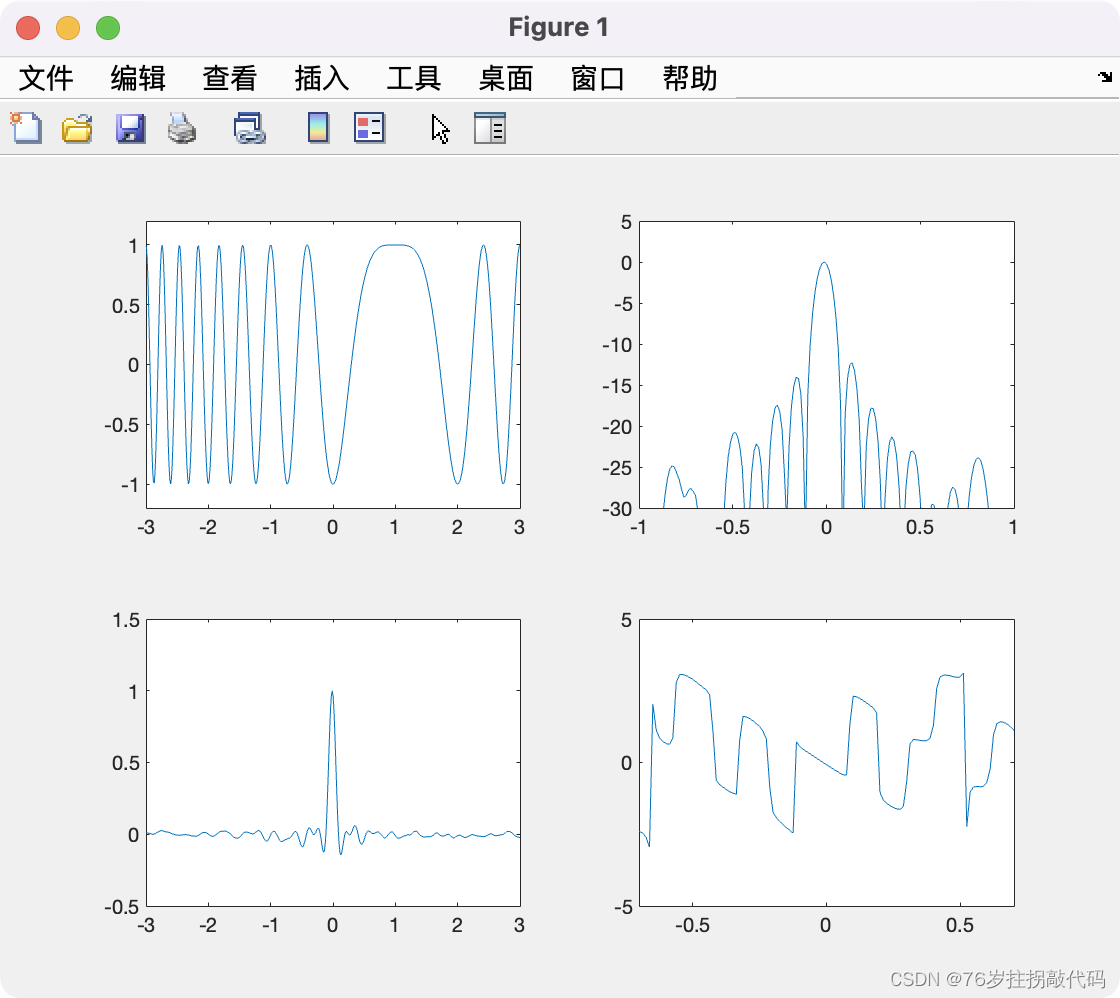



![【LeetCode】数据结构题解(9)[复制带随机指针的链表]](https://img-blog.csdnimg.cn/b7bced64771a4215967a8456aa34286d.png)

