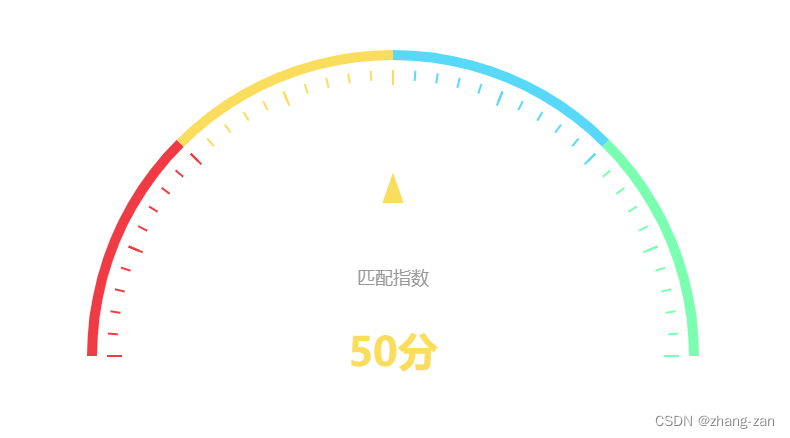
代码展示:
/**绘制仪表盘图表 */function drawInstrument(id) {setTimeout(()=> {var chart = echarts.init(document.getElementById(id)); var option = {series: [{name: '风险指数',type: 'gauge',center: ['50%', '60%'],radius: '90%',min: chartData.min,max: chartData.max,startAngle: 180,endAngle: 0,splitNumber: 8,axisLine: {lineStyle: {color: [[0.25, '#f03b44'],[0.5, '#fbdd5e'],[0.75, '#58d9f9'],[1, '#7afeaf'],],width: 10,},},splitLine: {// 分隔线show: true,length: 15,distance: 10,lineStyle: {width: 2,color: 'auto',},},axisTick: {// 刻度线样式(及短线样式)show: true,lineStyle: {width: 2,color: 'auto',},length: 10,distance: 10,},axisLabel: false,detail: {fontSize: '40',formatter: '{value}分',color: 'auto',offsetCenter: ['0', '0%'],},pointer: {icon: 'triangle',show: true,offsetCenter: [0, '-50%'],itemStyle: {color: 'auto',},length: '10%',width: '7%',},title: {// fontSize: 12,// offsetCenter: [0, -20],},data: [{value: chartData.value,name: '匹配指数',title: {show: true,color: '#999999',offsetCenter: [0, '-25%'],fontSize: 18,},},],},],};chart.setOption(option);window.addEventListener('resize', function(){chart.resize()}) },1000)}

