效果
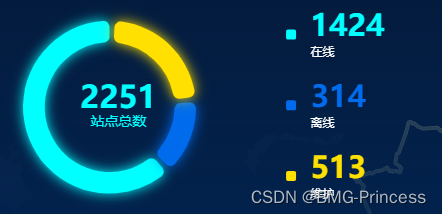
注意的点:
- title样式
- 颜色设置
- legend颜色设置
- legend textStyle 样式设置;formatter样式设置,文字拆分
代码:
<template><div style="width: 100%; height: 100%;"><div id="siteStatusStatisticChart" style="width: 100%; height: 100%;"></div></div>
</template>
<script>export default {data() {return {allItem: [{name: '在线',value: 1424,},{name: '离线',value: 314,},{name: '维护',value: 513,},],}},mounted() {this.initChart()},methods: {// getSelectAreaData(obj) {//     this.getRealDatas(obj)//   },//初始化echartinitChart() {let chartDom = document.getElementById("siteStatusStatisticChart");this.myChart = this.echarts.init(chartDom);let sum = this.allItem.reduce((cur, pre) => {return cur + pre.value;}, 0);let dataline = [];let legendData = [];var color = ['#00FFFF','#006CED','#FFE000',];for (var i = 0; i < this.allItem.length; i++) {let name = this.allItem[i].name + '/' + this.allItem[i].value;legendData.push(name);dataline.push({value: this.allItem[i].value,name: name,itemStyle: {borderWidth: 0,borderRadius: 5,shadowBlur: 10,borderColor: color[i],shadowColor: color[i],},}, {value: sum / 100, // 控制每个环形之间的间隙name: '',itemStyle: {label: {show: false,},labelLine: {show: false,},color: 'rgba(0, 0, 0, 0)',borderColor: 'rgba(0, 0, 0, 0)',borderWidth: 0,},});}let option = {title: {text: `{title|${sum}}\n{subtitle|站点总数}`,x: '17%',y: 'center',textStyle: {rich: {title: {color: '#00FFFF',fontSize: 31,fontWeight: 'normal',fontWeight: 'bold',align: 'center',},subtitle: {fontSize: 14,color: '#00FFFF',fontFamily: 'HarmonyOS Sans SC',fontWeight: '400',align: 'center',},}}},// title: [{//     text: sum,//     x: '18%',//     top: '38%',//     textStyle: {//      color: '#00FFFF',//      fontSize: 31,//      fontWeight: 'normal',//      fontWeight: 'bold',//     },//   },//   {//     text: '站点总数',//     x: '19%',//     top: '53%',//     textStyle: {//       fontSize: 14,//       color: '#00FFFF',//       fontFamily: 'HarmonyOS Sans SC',//       fontWeight: '400',//     },//   },// ],color: color,tooltip: {show: false,},legend: {icon: 'rect',itemWidth: 5,itemHeight: 5,itemStyle: {borderWidth: 3},orient: 'vertical',data: legendData,right: '12%',top: 'center',align: 'left',textStyle: {rich: {numStyle0: {padding: [3, 0, 0, 8],fontSize:30,color: '#00FFFF',fontWeight: 600,},numStyle1: {padding: [3, 0, 0, 8],fontSize: 30,color: '#006CED',fontWeight: 600,},numStyle2: {padding: [3, 0, 0, 8],fontSize:30,color: '#FFE000',fontWeight: 600,},nameStyle: {padding: [3, 0, 0, 8],verticalAlign: 'right',align: 'left',width: 60,fontSize: 12,color: '#ffffff',fontWeight: 400,},},},formatter: name => {for (let i = 0; i < legendData.length; i++) {if (name == legendData[i]) {return `{numStyle${i}|${name.substring(name.indexOf("\/")+1,name.length)}}\n{nameStyle|${name.substring(0,name.indexOf("/"))}}`}}},itemGap: 20, // 图例之间的间隔},toolbox: {show: false,},series: {type: 'pie',clockwise: false, //旋转顺序radius: ['60%', '80%'],center: ['25%', '50%'],emphasis: {scale: false,},label: {show: false,}, //箭头data: dataline,},};this.myChart.setOption(option)},}}</script>
<style scoped></style>







![8th参考文献:[8]许少辉.乡村振兴战略下传统村落文化旅游设计[M]北京:中国建筑出版传媒,2022.](https://img-blog.csdnimg.cn/08322314740f425daeb21e42a7d2c012.jpeg#pic_center)

