💥💥💞💞欢迎来到本博客❤️❤️💥💥
🏆博主优势:🌞🌞🌞博客内容尽量做到思维缜密,逻辑清晰,为了方便读者。
⛳️座右铭:行百里者,半于九十。
📋📋📋本文目录如下:🎁🎁🎁
目录
💥1 概述
📚2 运行结果
🎉3 参考文献
🌈4 Matlab代码实现
💥1 概述
-
使用信号处理算法过滤加速度数据并将其转换为速度和位移是研究物体运动的一个重要方法。在物理学、工程学、运动学等领域,这种方法被广泛应用于研究物体的运动状态和运动规律。
在这个方法中,首先需要采集物体的加速度数据,并将其加载到计算机中。然后,使用信号处理算法对加速度数据进行滤波,以去除噪声和干扰。常用的滤波方法包括低通滤波、高通滤波、带通滤波等。接着,将滤波后的加速度数据转换为速度和位移。可以使用积分计算的方法,将加速度数据转换为速度,再将速度数据转换为位移。
使用信号处理算法过滤加速度数据并将其转换为速度和位移的方法,可以帮助研究人员更加准确地描述物体的运动状态和运动规律。这种方法在运动学、生物力学、机械工程、航空航天等领域都有广泛的应用。例如,在运动学中,可以使用这种方法研究人体运动的规律和特点;在机械工程中,可以使用这种方法研究机械设备的运动状态和性能;在航空航天中,可以使用这种方法研究飞行器的运动状态和控制方法。
📚2 运行结果
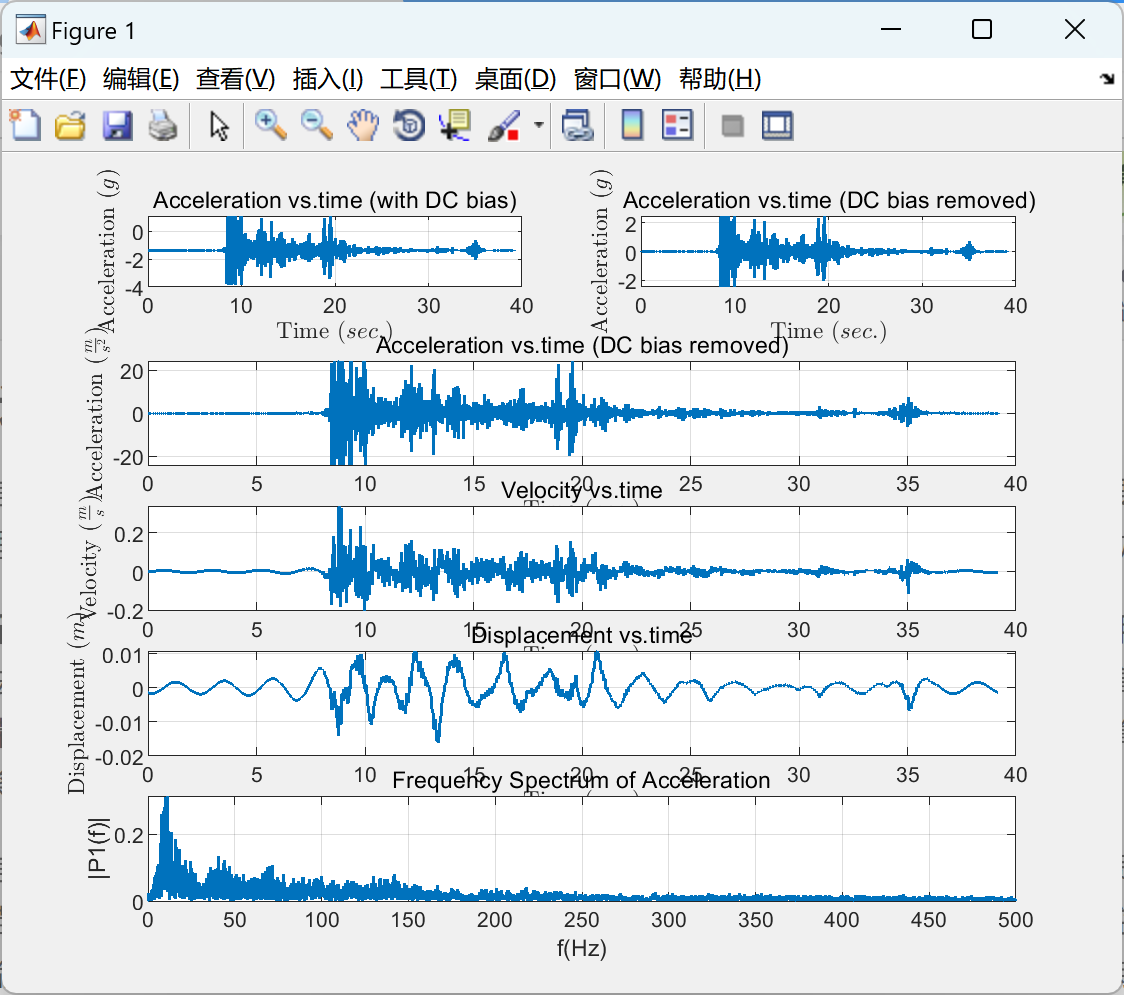
部分代码:
%% Plot Acceleration vs.time
%--------------------------------------------------------------------------
figure;
subplot(5,2,1)
ax1 = plot(time, accval_g, 'LineWidth', 1);
grid on
xlabel('Time ($sec.$)','Interpreter', 'latex');
ylabel('Acceleration ($g$)','Interpreter', 'latex');
title('Acceleration vs.time (with DC bias)')
ax2 = subplot(5,2,2);
plot(time, filtered_acc_g, 'LineWidth', 1)
grid on
xlabel('Time ($sec.$)','Interpreter', 'latex');
ylabel('Acceleration ($g$)','Interpreter', 'latex');
title('Acceleration vs.time (DC bias removed)')
ax3 = subplot(5,2,3:4);
plot(time,filtered_acc, 'LineWidth', 1)
grid on
xlabel('Time ($sec.$)','Interpreter', 'latex');
ylabel('Acceleration ($\frac{m}{s^2}$)','Interpreter', 'latex');
title('Acceleration vs.time (DC bias removed)')
ax4 = subplot(5,2,5:6);
plot(time,filtered_vel, 'LineWidth', 1)
grid on
xlabel('Time ($sec.$)','Interpreter', 'latex');
ylabel('Velocity ($\frac{m}{s}$)','Interpreter', 'latex');
title('Velocity vs.time')
ax5 = subplot(5,2,7:8);
plot(time,filtered_disp, 'LineWidth', 1)
grid on
xlabel('Time ($sec.$)','Interpreter', 'latex');
ylabel('Displacement ($m$)','Interpreter', 'latex');
title('Displacement vs.time')
ax6 = subplot(5,2,9:10);
plot(f,P1, 'LineWidth', 1)
grid on
title('Frequency Spectrum of Acceleration')
xlabel('f(Hz)')
ylabel('|P1(f)|')
%% Print the results
%--------------------------------------------------------------------------
% Extract the
[M,I] = max(P1);
% Frequency of the signal
fprintf('--------------------------------------------------------------------------\n');
fprintf('Frequency of the signal\n');
fprintf('--------------------------------------------------------------------------\n');
fprintf('Frequncy is: %.3fHz \n', f(I));
fprintf('\n\n\n');
% Peaks of the signals
fprintf('--------------------------------------------------------------------------\n');
fprintf('Peaks of the signals\n');
fprintf('--------------------------------------------------------------------------\n');
fprintf('Peak acceleration is: %.3f (g) \n', max(abs(filtered_acc))/9.81)
fprintf('Peak acceleration is: %.3f (m/s^2) \n', max(abs(filtered_acc)))
fprintf('Peak velocity is: %.3f (m/s) \n', max(abs(filtered_vel)))
fprintf('Peak displactment is: %.3f (m) \n', max(abs(filtered_disp)))
fprintf('\n\n\n');
%% End parameters
%--------------------------------------------------------------------------
Runtime = toc(Start);
fprintf('--------------------------------------------------------------------------\n');
fprintf('Computational Run time\n');
fprintf('--------------------------------------------------------------------------\n');
fprintf('Run time is: %.3f (sec.) \n', Runtime)
🎉3 参考文献
部分理论来源于网络,如有侵权请联系删除。
-
Winter, D. A. (2009). Biomechanics and Motor Control of Human Movement (4th ed.). Wiley.
-
Robertson, D. G. E., Caldwell, G. E., Hamill, J., Kamen, G., & Whittlesey, S. N. (2004). Research Methods in Biomechanics (2nd ed.). Human Kinetics.
-
Bland, J. M., & Altman, D. G. (1986). Statistical methods for assessing agreement between two methods of clinical measurement. The Lancet, 327(8476), 307-310.
-
Winter, D. A. (1990). Biomechanics of Human Movement. Wiley.
-
Cappozzo, A., Catani, F., Della Croce, U., & Leardini, A. (1995). Position and orientation in space of bones during movement: Anatomical frame definition and determination. Clinical Biomechanics, 10(4), 171-178.
-
Winter, D. A. (1991). The Biomechanics and Motor Control of Human Gait: Normal, Elderly and Pathological (2nd ed.). University of Waterloo Press.


