大家好,我是带我去滑雪!
判断肺部是否发生病变可以及早发现疾病、指导治疗和监测疾病进展,以及预防和促进肺部健康,定期进行肺部评估和检查对于保护肺健康、预防疾病和提高生活质量至关重要。本期将利用相关医学临床数据结合逻辑回归判断病人肺部是否发生病变,其中响应变量为group(1表示肺部发生病变,0表示正常),特征变量为ESR(表示红细胞沉降率)、CRP(表示C-反应蛋白)、ALB(表示白蛋白)、Anti-SSA(表示抗SSA抗体)、Glandular involvement(表示腺体受累)、gender(表示性别)、c-PSA(cancer-specific prostate-specific antigen)、CA 15-3(Cancer Antigen 15-3)、TH17(Th17细胞)、ANA(代表抗核抗体)、CA125(Cancer Antigen 125)、LDH(代表乳酸脱氢酶)。下面开始使用逻辑回归进行肺部病变判断。
(1)导入相关模块与数据
import pandas as pd
import matplotlib.pyplot as plt
from sklearn.linear_model import LogisticRegression
from sklearn.metrics import confusion_matrix
from sklearn.metrics import classification_report
from sklearn.metrics import cohen_kappa_score#导入包
import numpy as np
from scipy.stats import logistic
import matplotlib.pyplot as plt
titanic = pd.read_csv('filename1.csv')
titanic#导入数据输出结果:
data.Age impute.data.ESR..mean. impute.data.CRP..mean. impute.data.ALB..mean. impute.data.Anti.SSA..median. impute.data.Glandular.involvement..median. impute.data.Gender..median. impute.data.c.PSA..mean. impute.data.CA153..mean. impute.data.TH17..mean. impute.data.ANA..median. impute.data.CA125..mean. impute.data.LDH..mean. data.group 0 67 21.000000 4.810000 38.692661 0 0 0 0.300000 3.50000 10.330000 1 3.000000 212.210493 0 1 78 33.000000 12.089916 41.100000 0 0 0 0.610931 22.40000 7.465353 1 17.500000 485.000000 0 2 69 24.000000 2.250000 42.700000 0 0 0 0.300000 5.40000 8.020000 0 4.360000 236.000000 0 3 71 43.000000 21.800000 39.200000 0 0 0 0.300000 11.11000 5.500000 1 6.700000 166.000000 0 4 69 20.000000 2.430000 47.600000 3 0 0 0.300000 6.93000 4.310000 0 3.520000 223.000000 0 ... ... ... ... ... ... ... ... ... ... ... ... ... ... ... 954 63 40.274914 2.370000 40.300000 2 0 0 0.430000 6.10000 6.560000 0 7.720000 234.000000 0 955 68 27.000000 3.520000 41.000000 3 0 0 0.320000 7.52000 4.780000 1 7.150000 254.000000 0 956 61 40.274914 12.089916 40.700000 0 0 0 0.610931 12.46303 1.790000 1 9.392344 161.000000 0 957 60 27.000000 35.400000 38.300000 0 0 0 0.200000 7.68000 5.700000 0 9.290000 256.000000 0 958 68 30.000000 2.280000 44.400000 0 0 0 0.200000 5.32000 4.430000 0 4.710000 172.000000 0 959 rows × 14 columns
(2)数据处理
X = titanic.iloc[:,:-1]
y = titanic.iloc[:,-1]
X=pd.get_dummies(X,drop_first = True)
X
(3)划分训练集与测试集
from sklearn.model_selection import train_test_split
from sklearn.linear_model import LogisticRegression
X_train, X_test, y_train, y_test = train_test_split(X,y,test_size=0.2,stratify=None, random_state=0)#划分训练集和测试集
(4)拟合逻辑回归
model = LogisticRegression(C=1e10)
model.fit(X_train, y_train)model.intercept_ #模型截距
model.coef_ #模型回归系数输出结果:
array([[ 0.03899236, 0.00458312, 0.000863 , -0.10140358, -0.09681747,0.74167081, 0.56011254, 0.24636358, 0.0226635 , -0.02681392,0.4987412 , -0.01932326, 0.00211805]])
(5)使用逻辑回归测试集进行评价分类准确率
model.score(X_test, y_test)
输出结果:
0.6822916666666666
(6)测试集预测所有种类的概率
prob = model.predict_proba(X_test)
prob[:5]输出结果:
array([[0.71336774, 0.28663226],[0.34959506, 0.65040494],[0.91506198, 0.08493802],[0.24008149, 0.75991851],[0.55969043, 0.44030957]])
(7)模型预测
pred = model.predict(X_test)
pred[:5]#计算测试集的预测值,展示前五个值输出结果:
array([0, 1, 0, 1, 0], dtype=int64)
(8)计算混淆矩阵
table = pd.crosstab(y_test, pred, rownames=['Actual'], colnames=['Predicted'])
table输出结果:
Predicted 0 1 Actual 0 99 22 1 39 32
(9)计算基于混淆矩阵诸多评价指标
print(classification_report(y_test, pred, target_names=['yes', 'no']))
输出结果:
                precision    recall  f1-score   supportyes       0.72      0.82      0.76       121no       0.59      0.45      0.51        71accuracy                           0.68       192macro avg       0.65      0.63      0.64       192
weighted avg       0.67      0.68      0.67       192
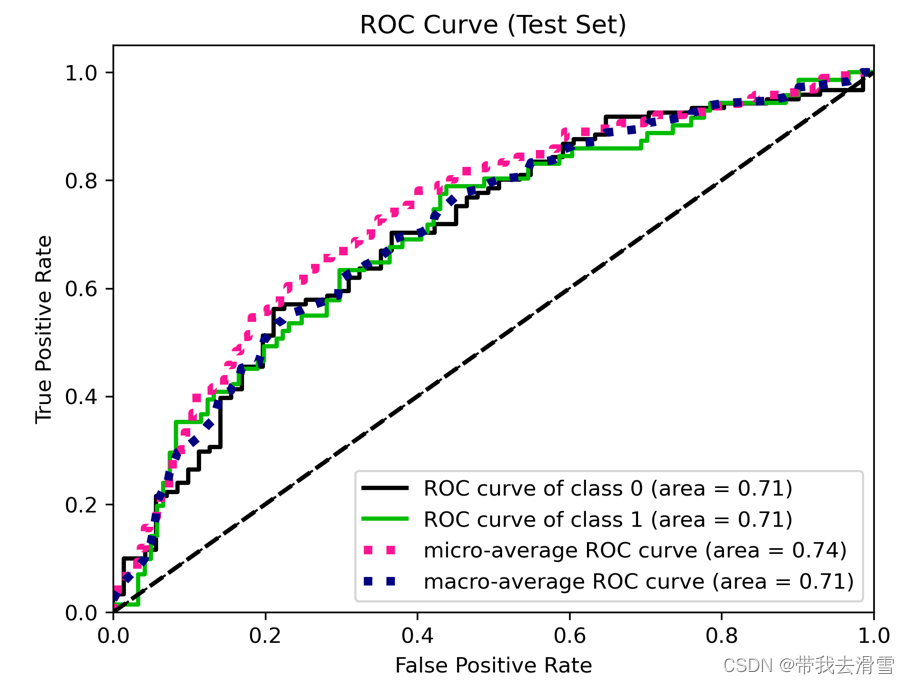
(10)绘制ROC曲线
from scikitplot.metrics import plot_roc
plot_roc(y_test, prob)
x = np.linspace(0, 1, 100)
plt.plot(x, x, 'k--', linewidth=1)
plt.title('ROC Curve (Test Set)')#画ROC曲线
plt.savefig("E:\工作\硕士\博客\squares1.png",
bbox_inches ="tight",
pad_inches = 1,
transparent = True,
facecolor ="w",
edgecolor ='w',
dpi=300,
orientation ='landscape')输出结果:
需要数据集的家人们可以去百度网盘(永久有效)获取:
链接:https://pan.baidu.com/s/1E59qYZuGhwlrx6gn4JJZTg?pwd=2138
提取码:2138
更多优质内容持续发布中,请移步主页查看。
点赞+关注,下次不迷路!
