文章目录
- 1. PrometheusOperator
- 1.1 优势
- 1.2 配置脚本
- 1.3 部署脚本
- 2. Granfana实现监控看板
- 2.1 Granfana核心特性
- 2.2 部署文件
- 3. prometheus-net收集自定义指标
- 3.1 组件包
- 3.2 使用场景
目前Kubernetes中最流行的监控解决方案是使用Prometheus和AlertManager
1. PrometheusOperator
1.1 优势
- 自动化安装
- 将配置资源化
- 灵活的扩展能力
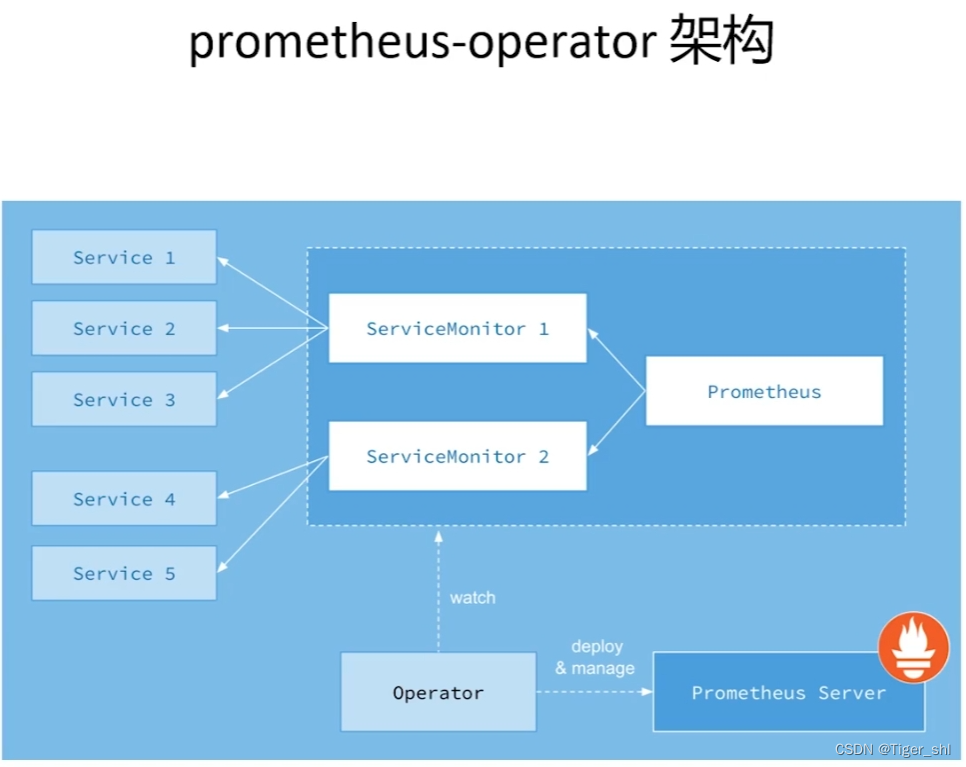
PrometheusOperator将整个监控系统抽象为ServiceMonitor和Prometheus对象
Prometheus对象则可以通过Helm文件配置出多个实例
ServiceMonitor的作用是桥接service和Prometheus,通过ServiceMonitor可以非常方便的通过Prometheus监控服务
Operator作用是监控ServiceMonitor的变化。当ServiceMonitor定义发生变化时,Operator会自动化热更新配置到PrometheusServer
1.2 配置脚本
部分values.yaml
alertmanager:## Deploy alertmanager##enabled: true## Api that prometheus will use to communicate with alertmanager. Possible values are v1, v2##apiVersion: v2## Service account for Alertmanager to use.## ref: https://kubernetes.io/docs/tasks/configure-pod-container/configure-service-account/##serviceAccount:create: truename: ""## Configure pod disruption budgets for Alertmanager## ref: https://kubernetes.io/docs/tasks/run-application/configure-pdb/#specifying-a-poddisruptionbudget## This configuration is immutable once created and will require the PDB to be deleted to be changed## https://github.com/kubernetes/kubernetes/issues/45398##podDisruptionBudget:enabled: falseminAvailable: 1maxUnavailable: ""## Alertmanager configuration directives## ref: https://prometheus.io/docs/alerting/configuration/#configuration-file##      https://prometheus.io/webtools/alerting/routing-tree-editor/##config:global:resolve_timeout: 5mroute:group_by: ['job']group_wait: 30sgroup_interval: 5mrepeat_interval: 12hreceiver: 'null'routes:- match:alertname: Watchdogreceiver: 'null'receivers:- name: 'null'## Pass the Alertmanager configuration directives through Helm's templating## engine. If the Alertmanager configuration contains Alertmanager templates,## they'll need to be properly escaped so that they are not interpreted by## Helm## ref: https://helm.sh/docs/developing_charts/#using-the-tpl-function##      https://prometheus.io/docs/alerting/configuration/#%3Ctmpl_string%3E##      https://prometheus.io/docs/alerting/notifications/##      https://prometheus.io/docs/alerting/notification_examples/tplConfig: false## Alertmanager template files to format alerts## ref: https://prometheus.io/docs/alerting/notifications/##      https://prometheus.io/docs/alerting/notification_examples/##templateFiles: {}### An example template:#   template_1.tmpl: |-#       {{ define "cluster" }}{{ .ExternalURL | reReplaceAll ".*alertmanager\\.(.*)" "$1" }}{{ end }}##       {{ define "slack.myorg.text" }}#       {{- $root := . -}}#       {{ range .Alerts }}#         *Alert:* {{ .Annotations.summary }} - `{{ .Labels.severity }}`#         *Cluster:*  {{ template "cluster" $root }}#         *Description:* {{ .Annotations.description }}#         *Graph:* <{{ .GeneratorURL }}|:chart_with_upwards_trend:>#         *Runbook:* <{{ .Annotations.runbook }}|:spiral_note_pad:>#         *Details:*#           {{ range .Labels.SortedPairs }} • *{{ .Name }}:* `{{ .Value }}`#           {{ end }}ingress:enabled: trueannotations: {}labels: {}## Hosts must be provided if Ingress is enabled.##hosts:- alertmanager.local## Paths to use for ingress rules - one path should match the alertmanagerSpec.routePrefix##paths: []# - /## TLS configuration for Alertmanager Ingress## Secret must be manually created in the namespace##tls: []# - secretName: alertmanager-general-tls#   hosts:#   - alertmanager.example.com## Configuration for Alertmanager secret##...
prometheus:enabled: true## Annotations for Prometheus##annotations: {}## Service account for Prometheuses to use.## ref: https://kubernetes.io/docs/tasks/configure-pod-container/configure-service-account/##serviceAccount:create: truename: ""## Configuration for Prometheus service##service:annotations: {}labels: {}clusterIP: ""## Port for Prometheus Service to listen on##port: 9090## To be used with a proxy extraContainer porttargetPort: 9090## List of IP addresses at which the Prometheus server service is available## Ref: https://kubernetes.io/docs/user-guide/services/#external-ips##externalIPs: []## Port to expose on each node## Only used if service.type is 'NodePort'##nodePort: 30090## Loadbalancer IP## Only use if service.type is "loadbalancer"loadBalancerIP: ""loadBalancerSourceRanges: []## Service type##type: ClusterIPsessionAffinity: ""## Configuration for creating a separate Service for each statefulset Prometheus replica##
...
## 自定义ServiceMonitors添加在这里
additionalServiceMonitors:- name: "hc"namespaceSelector:any: trueselector:matchLabels:geek: app-metricsendpoints:- path: /metricsport: http- name: ""namespaceSelector:any: trueselector:matchLabels:geek: app-metricsendpoints:- path: /metricsport: http...
1.3 部署脚本
helm repo add stable http://mirror.azure.cn/kubernetes/charts/
helm repo update
helm install prometheus-operator stable/prometheus-operator --version 8.10.0 --values .\prometheus-operator\values.yaml  --namespace kube-system
完整values.yaml
# Default values for prometheus-operator.
# This is a YAML-formatted file.
# Declare variables to be passed into your templates.## Provide a name in place of prometheus-operator for `app:` labels
##
nameOverride: ""## Provide a name to substitute for the full names of resources
##
fullnameOverride: ""## Labels to apply to all resources
##
commonLabels: {}
# scmhash: abc123
# myLabel: aakkmd## Create default rules for monitoring the cluster
##
defaultRules:create: truerules:alertmanager: trueetcd: truegeneral: truek8s: truekubeApiserver: truekubeApiserverError: truekubePrometheusNodeAlerting: truekubePrometheusNodeRecording: truekubernetesAbsent: truekubernetesApps: truekubernetesResources: truekubernetesStorage: truekubernetesSystem: truekubeScheduler: truenetwork: truenode: trueprometheus: trueprometheusOperator: truetime: true## Runbook url prefix for default rulesrunbookUrl: https://github.com/kubernetes-monitoring/kubernetes-mixin/tree/master/runbook.md### Reduce app namespace alert scopeappNamespacesTarget: ".*"## Labels for default ruleslabels: {}## Annotations for default rulesannotations: {}## Provide custom recording or alerting rules to be deployed into the cluster.
##
additionalPrometheusRules:- name: my-rule-filegroups:- name: my_grouprules:- record: my_recordexpr: 100 * my_record##
global:rbac:create: truepspEnabled: true## Reference to one or more secrets to be used when pulling images## ref: https://kubernetes.io/docs/tasks/configure-pod-container/pull-image-private-registry/##imagePullSecrets: []# - name: "image-pull-secret"## Configuration for alertmanager
## ref: https://prometheus.io/docs/alerting/alertmanager/
##
alertmanager:## Deploy alertmanager##enabled: true## Api that prometheus will use to communicate with alertmanager. Possible values are v1, v2##apiVersion: v2## Service account for Alertmanager to use.## ref: https://kubernetes.io/docs/tasks/configure-pod-container/configure-service-account/##serviceAccount:create: truename: ""## Configure pod disruption budgets for Alertmanager## ref: https://kubernetes.io/docs/tasks/run-application/configure-pdb/#specifying-a-poddisruptionbudget## This configuration is immutable once created and will require the PDB to be deleted to be changed## https://github.com/kubernetes/kubernetes/issues/45398##podDisruptionBudget:enabled: falseminAvailable: 1maxUnavailable: ""## Alertmanager configuration directives## ref: https://prometheus.io/docs/alerting/configuration/#configuration-file##      https://prometheus.io/webtools/alerting/routing-tree-editor/##config:global:resolve_timeout: 5mroute:group_by: ['job']group_wait: 30sgroup_interval: 5mrepeat_interval: 12hreceiver: 'null'routes:- match:alertname: Watchdogreceiver: 'null'receivers:- name: 'null'## Pass the Alertmanager configuration directives through Helm's templating## engine. If the Alertmanager configuration contains Alertmanager templates,## they'll need to be properly escaped so that they are not interpreted by## Helm## ref: https://helm.sh/docs/developing_charts/#using-the-tpl-function##      https://prometheus.io/docs/alerting/configuration/#%3Ctmpl_string%3E##      https://prometheus.io/docs/alerting/notifications/##      https://prometheus.io/docs/alerting/notification_examples/tplConfig: false## Alertmanager template files to format alerts## ref: https://prometheus.io/docs/alerting/notifications/##      https://prometheus.io/docs/alerting/notification_examples/##templateFiles: {}### An example template:#   template_1.tmpl: |-#       {{ define "cluster" }}{{ .ExternalURL | reReplaceAll ".*alertmanager\\.(.*)" "$1" }}{{ end }}##       {{ define "slack.myorg.text" }}#       {{- $root := . -}}#       {{ range .Alerts }}#         *Alert:* {{ .Annotations.summary }} - `{{ .Labels.severity }}`#         *Cluster:*  {{ template "cluster" $root }}#         *Description:* {{ .Annotations.description }}#         *Graph:* <{{ .GeneratorURL }}|:chart_with_upwards_trend:>#         *Runbook:* <{{ .Annotations.runbook }}|:spiral_note_pad:>#         *Details:*#           {{ range .Labels.SortedPairs }} • *{{ .Name }}:* `{{ .Value }}`#           {{ end }}ingress:enabled: trueannotations: {}labels: {}## Hosts must be provided if Ingress is enabled.##hosts:- alertmanager.local## Paths to use for ingress rules - one path should match the alertmanagerSpec.routePrefix##paths: []# - /## TLS configuration for Alertmanager Ingress## Secret must be manually created in the namespace##tls: []# - secretName: alertmanager-general-tls#   hosts:#   - alertmanager.example.com## Configuration for Alertmanager secret##secret:annotations: {}## Configuration for Alertmanager service##service:annotations: {}labels: {}clusterIP: ""## Port for Alertmanager Service to listen on##port: 9093## Port to expose on each node## Only used if service.type is 'NodePort'##nodePort: 30903## List of IP addresses at which the Prometheus server service is available## Ref: https://kubernetes.io/docs/user-guide/services/#external-ips##externalIPs: []loadBalancerIP: ""loadBalancerSourceRanges: []## Service type##type: ClusterIP## If true, create a serviceMonitor for alertmanager##serviceMonitor:## Scrape interval. If not set, the Prometheus default scrape interval is used.##interval: ""selfMonitor: true## 	metric relabel configs to apply to samples before ingestion.##metricRelabelings: []# - action: keep#   regex: 'kube_(daemonset|deployment|pod|namespace|node|statefulset).+'#   sourceLabels: [__name__]# 	relabel configs to apply to samples before ingestion.##relabelings: []# - sourceLabels: [__meta_kubernetes_pod_node_name]#   separator: ;#   regex: ^(.*)$#   targetLabel: nodename#   replacement: $1#   action: replace## Settings affecting alertmanagerSpec## ref: https://github.com/coreos/prometheus-operator/blob/master/Documentation/api.md#alertmanagerspec##alertmanagerSpec:## Standard object’s metadata. More info: https://github.com/kubernetes/community/blob/master/contributors/devel/sig-architecture/api-conventions.md#metadata## Metadata Labels and Annotations gets propagated to the Alertmanager pods.##podMetadata: {}## Image of Alertmanager##image:repository: quay.io/prometheus/alertmanagertag: v0.20.0## If true then the user will be responsible to provide a secret with alertmanager configuration## So when true the config part will be ignored (including templateFiles) and the one in the secret will be used##useExistingSecret: false## Secrets is a list of Secrets in the same namespace as the Alertmanager object, which shall be mounted into the## Alertmanager Pods. The Secrets are mounted into /etc/alertmanager/secrets/.##secrets: []## ConfigMaps is a list of ConfigMaps in the same namespace as the Alertmanager object, which shall be mounted into the Alertmanager Pods.## The ConfigMaps are mounted into /etc/alertmanager/configmaps/.##configMaps: []## ConfigSecret is the name of a Kubernetes Secret in the same namespace as the Alertmanager object, which contains configuration for## this Alertmanager instance. Defaults to 'alertmanager-' The secret is mounted into /etc/alertmanager/config.### configSecret:## Define Log Format# Use logfmt (default) or json-formatted logginglogFormat: logfmt## Log level for Alertmanager to be configured with.##logLevel: info## Size is the expected size of the alertmanager cluster. The controller will eventually make the size of the## running cluster equal to the expected size.replicas: 1## Time duration Alertmanager shall retain data for. Default is '120h', and must match the regular expression## [0-9]+(ms|s|m|h) (milliseconds seconds minutes hours).##retention: 120h## Storage is the definition of how storage will be used by the Alertmanager instances.## ref: https://github.com/coreos/prometheus-operator/blob/master/Documentation/user-guides/storage.md##storage: {}# volumeClaimTemplate:#   spec:#     storageClassName: gluster#     accessModes: ["ReadWriteOnce"]#     resources:#       requests:#         storage: 50Gi#   selector: {}## 	The external URL the Alertmanager instances will be available under. This is necessary to generate correct URLs. This is necessary if Alertmanager is not served from root of a DNS name.	string	false##externalUrl:## 	The route prefix Alertmanager registers HTTP handlers for. This is useful, if using ExternalURL and a proxy is rewriting HTTP routes of a request, and the actual ExternalURL is still true,## but the server serves requests under a different route prefix. For example for use with kubectl proxy.##routePrefix: /## If set to true all actions on the underlying managed objects are not going to be performed, except for delete actions.##paused: false## Define which Nodes the Pods are scheduled on.## ref: https://kubernetes.io/docs/user-guide/node-selection/##nodeSelector: {}## Define resources requests and limits for single Pods.## ref: https://kubernetes.io/docs/user-guide/compute-resources/##resources: {}# requests:#   memory: 400Mi## Pod anti-affinity can prevent the scheduler from placing Prometheus replicas on the same node.## The default value "soft" means that the scheduler should *prefer* to not schedule two replica pods onto the same node but no guarantee is provided.## The value "hard" means that the scheduler is *required* to not schedule two replica pods onto the same node.## The value "" will disable pod anti-affinity so that no anti-affinity rules will be configured.##podAntiAffinity: ""## If anti-affinity is enabled sets the topologyKey to use for anti-affinity.## This can be changed to, for example, failure-domain.beta.kubernetes.io/zone##podAntiAffinityTopologyKey: kubernetes.io/hostname## Assign custom affinity rules to the alertmanager instance## ref: https://kubernetes.io/docs/concepts/configuration/assign-pod-node/##affinity: {}# nodeAffinity:#   requiredDuringSchedulingIgnoredDuringExecution:#     nodeSelectorTerms:#     - matchExpressions:#       - key: kubernetes.io/e2e-az-name#         operator: In#         values:#         - e2e-az1#         - e2e-az2## If specified, the pod's tolerations.## ref: https://kubernetes.io/docs/concepts/configuration/taint-and-toleration/##tolerations: []# - key: "key"#   operator: "Equal"#   value: "value"#   effect: "NoSchedule"## SecurityContext holds pod-level security attributes and common container settings.## This defaults to non root user with uid 1000 and gid 2000.	*v1.PodSecurityContext	false## ref: https://kubernetes.io/docs/tasks/configure-pod-container/security-context/##securityContext:runAsNonRoot: truerunAsUser: 1000fsGroup: 2000## ListenLocal makes the Alertmanager server listen on loopback, so that it does not bind against the Pod IP.## Note this is only for the Alertmanager UI, not the gossip communication.##listenLocal: false## Containers allows injecting additional containers. This is meant to allow adding an authentication proxy to an Alertmanager pod.##containers: []## Priority class assigned to the Pods##priorityClassName: ""## AdditionalPeers allows injecting a set of additional Alertmanagers to peer with to form a highly available cluster.##additionalPeers: []## PortName to use for Alert Manager.##portName: "web"## Using default values from https://github.com/helm/charts/blob/master/stable/grafana/values.yaml
##
grafana:enabled: true## Deploy default dashboards.##defaultDashboardsEnabled: trueadminPassword: adminingress:## If true, Grafana Ingress will be created##enabled: true## Annotations for Grafana Ingress##annotations: {}# kubernetes.io/ingress.class: nginx# kubernetes.io/tls-acme: "true"## Labels to be added to the Ingress##labels: {}## Hostnames.## Must be provided if Ingress is enable.##hosts:- grafana.local## Path for grafana ingresspath: /## TLS configuration for grafana Ingress## Secret must be manually created in the namespace##tls: []# - secretName: grafana-general-tls#   hosts:#   - grafana.example.comsidecar:dashboards:enabled: truelabel: grafana_dashboarddatasources:enabled: truedefaultDatasourceEnabled: true## Annotations for Grafana datasource configmaps##annotations: {}## Create datasource for each Pod of Prometheus StatefulSet;## this uses headless service `prometheus-operated` which is## created by Prometheus Operator## ref: https://git.io/fjaBScreatePrometheusReplicasDatasources: falselabel: grafana_datasourceextraConfigmapMounts: []# - name: certs-configmap#   mountPath: /etc/grafana/ssl/#   configMap: certs-configmap#   readOnly: true## Configure additional grafana datasources## ref: http://docs.grafana.org/administration/provisioning/#datasourcesadditionalDataSources: []# - name: prometheus-sample#   access: proxy#   basicAuth: true#   basicAuthPassword: pass#   basicAuthUser: daco#   editable: false#   jsonData:#       tlsSkipVerify: true#   orgId: 1#   type: prometheus#   url: https://prometheus.svc:9090#   version: 1## Passed to grafana subchart and used by servicemonitor below##service:portName: service## If true, create a serviceMonitor for grafana##serviceMonitor:## Scrape interval. If not set, the Prometheus default scrape interval is used.##interval: ""selfMonitor: true## 	metric relabel configs to apply to samples before ingestion.##metricRelabelings: []# - action: keep#   regex: 'kube_(daemonset|deployment|pod|namespace|node|statefulset).+'#   sourceLabels: [__name__]# 	relabel configs to apply to samples before ingestion.##relabelings: []# - sourceLabels: [__meta_kubernetes_pod_node_name]#   separator: ;#   regex: ^(.*)$#   targetLabel: nodename#   replacement: $1#   action: replace## Component scraping the kube api server
##
kubeApiServer:enabled: truetlsConfig:serverName: kubernetesinsecureSkipVerify: false## If your API endpoint address is not reachable (as in AKS) you can replace it with the kubernetes service##relabelings: []# - sourceLabels:#     - __meta_kubernetes_namespace#     - __meta_kubernetes_service_name#     - __meta_kubernetes_endpoint_port_name#   action: keep#   regex: default;kubernetes;https# - targetLabel: __address__#   replacement: kubernetes.default.svc:443serviceMonitor:## Scrape interval. If not set, the Prometheus default scrape interval is used.##interval: ""jobLabel: componentselector:matchLabels:component: apiserverprovider: kubernetes## 	metric relabel configs to apply to samples before ingestion.##metricRelabelings: []# - action: keep#   regex: 'kube_(daemonset|deployment|pod|namespace|node|statefulset).+'#   sourceLabels: [__name__]## Component scraping the kubelet and kubelet-hosted cAdvisor
##
kubelet:enabled: truenamespace: kube-systemserviceMonitor:## Scrape interval. If not set, the Prometheus default scrape interval is used.##interval: ""## Enable scraping the kubelet over https. For requirements to enable this see## https://github.com/coreos/prometheus-operator/issues/926##https: true## Metric relabellings to apply to samples before ingestion##cAdvisorMetricRelabelings: []# - sourceLabels: [__name__, image]#   separator: ;#   regex: container_([a-z_]+);#   replacement: $1#   action: drop# - sourceLabels: [__name__]#   separator: ;#   regex: container_(network_tcp_usage_total|network_udp_usage_total|tasks_state|cpu_load_average_10s)#   replacement: $1#   action: drop# 	relabel configs to apply to samples before ingestion.#   metrics_path is required to match upstream rules and charts##cAdvisorRelabelings:- sourceLabels: [__metrics_path__]targetLabel: metrics_path# - sourceLabels: [__meta_kubernetes_pod_node_name]#   separator: ;#   regex: ^(.*)$#   targetLabel: nodename#   replacement: $1#   action: replacemetricRelabelings: []# - sourceLabels: [__name__, image]#   separator: ;#   regex: container_([a-z_]+);#   replacement: $1#   action: drop# - sourceLabels: [__name__]#   separator: ;#   regex: container_(network_tcp_usage_total|network_udp_usage_total|tasks_state|cpu_load_average_10s)#   replacement: $1#   action: drop# 	relabel configs to apply to samples before ingestion.#   metrics_path is required to match upstream rules and charts##relabelings:- sourceLabels: [__metrics_path__]targetLabel: metrics_path# - sourceLabels: [__meta_kubernetes_pod_node_name]#   separator: ;#   regex: ^(.*)$#   targetLabel: nodename#   replacement: $1#   action: replace## Component scraping the kube controller manager
##
kubeControllerManager:enabled: true## If your kube controller manager is not deployed as a pod, specify IPs it can be found on##endpoints: []# - 10.141.4.22# - 10.141.4.23# - 10.141.4.24## If using kubeControllerManager.endpoints only the port and targetPort are used##service:port: 10252targetPort: 10252# selector:#   component: kube-controller-managerserviceMonitor:## Scrape interval. If not set, the Prometheus default scrape interval is used.##interval: ""## Enable scraping kube-controller-manager over https.## Requires proper certs (not self-signed) and delegated authentication/authorization checks##https: false# Skip TLS certificate validation when scrapinginsecureSkipVerify: null# Name of the server to use when validating TLS certificateserverName: null## 	metric relabel configs to apply to samples before ingestion.##metricRelabelings: []# - action: keep#   regex: 'kube_(daemonset|deployment|pod|namespace|node|statefulset).+'#   sourceLabels: [__name__]# 	relabel configs to apply to samples before ingestion.##relabelings: []# - sourceLabels: [__meta_kubernetes_pod_node_name]#   separator: ;#   regex: ^(.*)$#   targetLabel: nodename#   replacement: $1#   action: replace## Component scraping coreDns. Use either this or kubeDns
##
coreDns:enabled: trueservice:port: 9153targetPort: 9153# selector:#   k8s-app: kube-dnsserviceMonitor:## Scrape interval. If not set, the Prometheus default scrape interval is used.##interval: ""## 	metric relabel configs to apply to samples before ingestion.##metricRelabelings: []# - action: keep#   regex: 'kube_(daemonset|deployment|pod|namespace|node|statefulset).+'#   sourceLabels: [__name__]# 	relabel configs to apply to samples before ingestion.##relabelings: []# - sourceLabels: [__meta_kubernetes_pod_node_name]#   separator: ;#   regex: ^(.*)$#   targetLabel: nodename#   replacement: $1#   action: replace## Component scraping kubeDns. Use either this or coreDns
##
kubeDns:enabled: falseservice:dnsmasq:port: 10054targetPort: 10054skydns:port: 10055targetPort: 10055# selector:#   k8s-app: kube-dnsserviceMonitor:## Scrape interval. If not set, the Prometheus default scrape interval is used.##interval: ""## 	metric relabel configs to apply to samples before ingestion.##metricRelabelings: []# - action: keep#   regex: 'kube_(daemonset|deployment|pod|namespace|node|statefulset).+'#   sourceLabels: [__name__]# 	relabel configs to apply to samples before ingestion.##relabelings: []# - sourceLabels: [__meta_kubernetes_pod_node_name]#   separator: ;#   regex: ^(.*)$#   targetLabel: nodename#   replacement: $1#   action: replacednsmasqMetricRelabelings: []# - action: keep#   regex: 'kube_(daemonset|deployment|pod|namespace|node|statefulset).+'#   sourceLabels: [__name__]# 	relabel configs to apply to samples before ingestion.##dnsmasqRelabelings: []# - sourceLabels: [__meta_kubernetes_pod_node_name]#   separator: ;#   regex: ^(.*)$#   targetLabel: nodename#   replacement: $1#   action: replace## Component scraping etcd
##
kubeEtcd:enabled: true## If your etcd is not deployed as a pod, specify IPs it can be found on##endpoints: []# - 10.141.4.22# - 10.141.4.23# - 10.141.4.24## Etcd service. If using kubeEtcd.endpoints only the port and targetPort are used##service:port: 2379targetPort: 2379# selector:#   component: etcd## Configure secure access to the etcd cluster by loading a secret into prometheus and## specifying security configuration below. For example, with a secret named etcd-client-cert#### serviceMonitor:##   scheme: https##   insecureSkipVerify: false##   serverName: localhost##   caFile: /etc/prometheus/secrets/etcd-client-cert/etcd-ca##   certFile: /etc/prometheus/secrets/etcd-client-cert/etcd-client##   keyFile: /etc/prometheus/secrets/etcd-client-cert/etcd-client-key##serviceMonitor:## Scrape interval. If not set, the Prometheus default scrape interval is used.##interval: ""scheme: httpinsecureSkipVerify: falseserverName: ""caFile: ""certFile: ""keyFile: ""## 	metric relabel configs to apply to samples before ingestion.##metricRelabelings: []# - action: keep#   regex: 'kube_(daemonset|deployment|pod|namespace|node|statefulset).+'#   sourceLabels: [__name__]# 	relabel configs to apply to samples before ingestion.##relabelings: []# - sourceLabels: [__meta_kubernetes_pod_node_name]#   separator: ;#   regex: ^(.*)$#   targetLabel: nodename#   replacement: $1#   action: replace## Component scraping kube scheduler
##
kubeScheduler:enabled: true## If your kube scheduler is not deployed as a pod, specify IPs it can be found on##endpoints: []# - 10.141.4.22# - 10.141.4.23# - 10.141.4.24## If using kubeScheduler.endpoints only the port and targetPort are used##service:port: 10251targetPort: 10251# selector:#   component: kube-schedulerserviceMonitor:## Scrape interval. If not set, the Prometheus default scrape interval is used.##interval: ""## Enable scraping kube-scheduler over https.## Requires proper certs (not self-signed) and delegated authentication/authorization checks##https: false## Skip TLS certificate validation when scrapinginsecureSkipVerify: null## Name of the server to use when validating TLS certificateserverName: null## 	metric relabel configs to apply to samples before ingestion.##metricRelabelings: []# - action: keep#   regex: 'kube_(daemonset|deployment|pod|namespace|node|statefulset).+'#   sourceLabels: [__name__]# 	relabel configs to apply to samples before ingestion.##relabelings: []# - sourceLabels: [__meta_kubernetes_pod_node_name]#   separator: ;#   regex: ^(.*)$#   targetLabel: nodename#   replacement: $1#   action: replace## Component scraping kube proxy
##
kubeProxy:enabled: true## If your kube proxy is not deployed as a pod, specify IPs it can be found on##endpoints: []# - 10.141.4.22# - 10.141.4.23# - 10.141.4.24service:port: 10249targetPort: 10249# selector:#   k8s-app: kube-proxyserviceMonitor:## Scrape interval. If not set, the Prometheus default scrape interval is used.##interval: ""## Enable scraping kube-proxy over https.## Requires proper certs (not self-signed) and delegated authentication/authorization checks##https: false## 	metric relabel configs to apply to samples before ingestion.##metricRelabelings: []# - action: keep#   regex: 'kube_(daemonset|deployment|pod|namespace|node|statefulset).+'#   sourceLabels: [__name__]# 	relabel configs to apply to samples before ingestion.##relabelings: []# - action: keep#   regex: 'kube_(daemonset|deployment|pod|namespace|node|statefulset).+'#   sourceLabels: [__name__]## Component scraping kube state metrics
##
kubeStateMetrics:enabled: trueserviceMonitor:## Scrape interval. If not set, the Prometheus default scrape interval is used.##interval: ""## 	metric relabel configs to apply to samples before ingestion.##metricRelabelings: []# - action: keep#   regex: 'kube_(daemonset|deployment|pod|namespace|node|statefulset).+'#   sourceLabels: [__name__]# 	relabel configs to apply to samples before ingestion.##relabelings: []# - sourceLabels: [__meta_kubernetes_pod_node_name]#   separator: ;#   regex: ^(.*)$#   targetLabel: nodename#   replacement: $1#   action: replace## Configuration for kube-state-metrics subchart
##
kube-state-metrics:rbac:create: truepodSecurityPolicy:enabled: true## Deploy node exporter as a daemonset to all nodes
##
nodeExporter:enabled: true## Use the value configured in prometheus-node-exporter.podLabels##jobLabel: jobLabelserviceMonitor:## Scrape interval. If not set, the Prometheus default scrape interval is used.##interval: ""## How long until a scrape request times out. If not set, the Prometheus default scape timeout is used.##scrapeTimeout: ""## 	metric relabel configs to apply to samples before ingestion.##metricRelabelings: []# - sourceLabels: [__name__]#   separator: ;#   regex: ^node_mountstats_nfs_(event|operations|transport)_.+#   replacement: $1#   action: drop## 	relabel configs to apply to samples before ingestion.##relabelings: []# - sourceLabels: [__meta_kubernetes_pod_node_name]#   separator: ;#   regex: ^(.*)$#   targetLabel: nodename#   replacement: $1#   action: replace## Configuration for prometheus-node-exporter subchart
##
prometheus-node-exporter:podLabels:## Add the 'node-exporter' label to be used by serviceMonitor to match standard common usage in rules and grafana dashboards##jobLabel: node-exporterextraArgs:- --collector.filesystem.ignored-mount-points=^/(dev|proc|sys|var/lib/docker/.+)($|/)- --collector.filesystem.ignored-fs-types=^(autofs|binfmt_misc|cgroup|configfs|debugfs|devpts|devtmpfs|fusectl|hugetlbfs|mqueue|overlay|proc|procfs|pstore|rpc_pipefs|securityfs|sysfs|tracefs)$## Manages Prometheus and Alertmanager components
##
prometheusOperator:enabled: true# If true prometheus operator will create and update its CRDs on startupmanageCrds: truetlsProxy:enabled: trueimage:repository: squareup/ghostunneltag: v1.5.2pullPolicy: IfNotPresentresources: {}## Admission webhook support for PrometheusRules resources added in Prometheus Operator 0.30 can be enabled to prevent incorrectly formatted## rules from making their way into prometheus and potentially preventing the container from startingadmissionWebhooks:failurePolicy: Failenabled: true## If enabled, generate a self-signed certificate, then patch the webhook configurations with the generated data.## On chart upgrades (or if the secret exists) the cert will not be re-generated. You can use this to provide your own## certs ahead of time if you wish.##patch:enabled: trueimage:repository: jettech/kube-webhook-certgentag: v1.0.0pullPolicy: IfNotPresentresources: {}## Provide a priority class name to the webhook patching job##priorityClassName: ""podAnnotations: {}nodeSelector: {}affinity: {}tolerations: []## Namespaces to scope the interaction of the Prometheus Operator and the apiserver (allow list).## This is mutually exclusive with denyNamespaces. Setting this to an empty object will disable the configuration##namespaces: {}# releaseNamespace: true# additional:# - kube-system## Namespaces not to scope the interaction of the Prometheus Operator (deny list).##denyNamespaces: []## Service account for Alertmanager to use.## ref: https://kubernetes.io/docs/tasks/configure-pod-container/configure-service-account/##serviceAccount:create: truename: ""## Configuration for Prometheus operator service##service:annotations: {}labels: {}clusterIP: ""## Port to expose on each node## Only used if service.type is 'NodePort'##nodePort: 30080nodePortTls: 30443## Additional ports to open for Prometheus service## ref: https://kubernetes.io/docs/concepts/services-networking/service/#multi-port-services##additionalPorts: []## Loadbalancer IP## Only use if service.type is "loadbalancer"##loadBalancerIP: ""loadBalancerSourceRanges: []## Service type## NodePort, ClusterIP, loadbalancer##type: ClusterIP## List of IP addresses at which the Prometheus server service is available## Ref: https://kubernetes.io/docs/user-guide/services/#external-ips##externalIPs: []## Deploy CRDs used by Prometheus Operator.##createCustomResource: true## Attempt to clean up CRDs created by Prometheus Operator.##cleanupCustomResource: false## Labels to add to the operator pod##podLabels: {}## Annotations to add to the operator pod##podAnnotations: {}## Assign a PriorityClassName to pods if set# priorityClassName: ""## Define Log Format# Use logfmt (default) or json-formatted logging# logFormat: logfmt## Decrease log verbosity to errors only# logLevel: error## If true, the operator will create and maintain a service for scraping kubelets## ref: https://github.com/coreos/prometheus-operator/blob/master/helm/prometheus-operator/README.md##kubeletService:enabled: truenamespace: kube-system## Create a servicemonitor for the operator##serviceMonitor:## Scrape interval. If not set, the Prometheus default scrape interval is used.##interval: ""selfMonitor: true## 	metric relabel configs to apply to samples before ingestion.##metricRelabelings: []# - action: keep#   regex: 'kube_(daemonset|deployment|pod|namespace|node|statefulset).+'#   sourceLabels: [__name__]# 	relabel configs to apply to samples before ingestion.##relabelings: []# - sourceLabels: [__meta_kubernetes_pod_node_name]#   separator: ;#   regex: ^(.*)$#   targetLabel: nodename#   replacement: $1#   action: replace## Resource limits & requests##resources: {}# limits:#   cpu: 200m#   memory: 200Mi# requests:#   cpu: 100m#   memory: 100Mi## Define which Nodes the Pods are scheduled on.## ref: https://kubernetes.io/docs/user-guide/node-selection/##nodeSelector: {}## Tolerations for use with node taints## ref: https://kubernetes.io/docs/concepts/configuration/taint-and-toleration/##tolerations: []# - key: "key"#   operator: "Equal"#   value: "value"#   effect: "NoSchedule"## Assign custom affinity rules to the prometheus operator## ref: https://kubernetes.io/docs/concepts/configuration/assign-pod-node/##affinity: {}# nodeAffinity:#   requiredDuringSchedulingIgnoredDuringExecution:#     nodeSelectorTerms:#     - matchExpressions:#       - key: kubernetes.io/e2e-az-name#         operator: In#         values:#         - e2e-az1#         - e2e-az2securityContext:runAsNonRoot: truerunAsUser: 65534## Prometheus-operator image##image:repository: quay.io/coreos/prometheus-operatortag: v0.36.0pullPolicy: IfNotPresent## Configmap-reload image to use for reloading configmaps##configmapReloadImage:repository: quay.io/coreos/configmap-reloadtag: v0.0.1## Prometheus-config-reloader image to use for config and rule reloading##prometheusConfigReloaderImage:repository: quay.io/coreos/prometheus-config-reloadertag: v0.36.0## Set the prometheus config reloader side-car CPU limit##configReloaderCpu: 100m## Set the prometheus config reloader side-car memory limit##configReloaderMemory: 25Mi## Hyperkube image to use when cleaning up##hyperkubeImage:repository: k8s.gcr.io/hyperkubetag: v1.12.1pullPolicy: IfNotPresent## Deploy a Prometheus instance
##
prometheus:enabled: true## Annotations for Prometheus##annotations: {}## Service account for Prometheuses to use.## ref: https://kubernetes.io/docs/tasks/configure-pod-container/configure-service-account/##serviceAccount:create: truename: ""## Configuration for Prometheus service##service:annotations: {}labels: {}clusterIP: ""## Port for Prometheus Service to listen on##port: 9090## To be used with a proxy extraContainer porttargetPort: 9090## List of IP addresses at which the Prometheus server service is available## Ref: https://kubernetes.io/docs/user-guide/services/#external-ips##externalIPs: []## Port to expose on each node## Only used if service.type is 'NodePort'##nodePort: 30090## Loadbalancer IP## Only use if service.type is "loadbalancer"loadBalancerIP: ""loadBalancerSourceRanges: []## Service type##type: ClusterIPsessionAffinity: ""## Configuration for creating a separate Service for each statefulset Prometheus replica##servicePerReplica:enabled: falseannotations: {}## Port for Prometheus Service per replica to listen on##port: 9090## To be used with a proxy extraContainer porttargetPort: 9090## Port to expose on each node## Only used if servicePerReplica.type is 'NodePort'##nodePort: 30091## Loadbalancer source IP ranges## Only used if servicePerReplica.type is "loadbalancer"loadBalancerSourceRanges: []## Service type##type: ClusterIP## Configure pod disruption budgets for Prometheus## ref: https://kubernetes.io/docs/tasks/run-application/configure-pdb/#specifying-a-poddisruptionbudget## This configuration is immutable once created and will require the PDB to be deleted to be changed## https://github.com/kubernetes/kubernetes/issues/45398##podDisruptionBudget:enabled: falseminAvailable: 1maxUnavailable: ""ingress:enabled: trueannotations: {}labels: {}## Hostnames.## Must be provided if Ingress is enabled.##hosts:- prometheus.local## Paths to use for ingress rules - one path should match the prometheusSpec.routePrefix##paths: []# - /## TLS configuration for Prometheus Ingress## Secret must be manually created in the namespace##tls: []# - secretName: prometheus-general-tls#   hosts:#     - prometheus.example.com## Configuration for creating an Ingress that will map to each Prometheus replica service## prometheus.servicePerReplica must be enabled##ingressPerReplica:enabled: falseannotations: {}labels: {}## Final form of the hostname for each per replica ingress is## {{ ingressPerReplica.hostPrefix }}-{{ $replicaNumber }}.{{ ingressPerReplica.hostDomain }}#### Prefix for the per replica ingress that will have `-$replicaNumber`## appended to the endhostPrefix: ""## Domain that will be used for the per replica ingresshostDomain: ""## Paths to use for ingress rules##paths: []# - /## Secret name containing the TLS certificate for Prometheus per replica ingress## Secret must be manually created in the namespacetlsSecretName: ""## Configure additional options for default pod security policy for Prometheus## ref: https://kubernetes.io/docs/concepts/policy/pod-security-policy/podSecurityPolicy:allowedCapabilities: []serviceMonitor:## Scrape interval. If not set, the Prometheus default scrape interval is used.##interval: ""selfMonitor: true## scheme: HTTP scheme to use for scraping. Can be used with `tlsConfig` for example if using istio mTLS.scheme: ""## tlsConfig: TLS configuration to use when scraping the endpoint. For example if using istio mTLS.## Of type: https://github.com/coreos/prometheus-operator/blob/master/Documentation/api.md#tlsconfigtlsConfig: {}bearerTokenFile:## 	metric relabel configs to apply to samples before ingestion.##metricRelabelings: []# - action: keep#   regex: 'kube_(daemonset|deployment|pod|namespace|node|statefulset).+'#   sourceLabels: [__name__]# 	relabel configs to apply to samples before ingestion.##relabelings: []# - sourceLabels: [__meta_kubernetes_pod_node_name]#   separator: ;#   regex: ^(.*)$#   targetLabel: nodename#   replacement: $1#   action: replace## Settings affecting prometheusSpec## ref: https://github.com/coreos/prometheus-operator/blob/master/Documentation/api.md#prometheusspec##prometheusSpec:## If true, pass --storage.tsdb.max-block-duration=2h to prometheus. This is already done if using Thanos##disableCompaction: false## APIServerConfig## ref: https://github.com/coreos/prometheus-operator/blob/master/Documentation/api.md#apiserverconfig##apiserverConfig: {}## Interval between consecutive scrapes.##scrapeInterval: ""## Interval between consecutive evaluations.##evaluationInterval: ""## ListenLocal makes the Prometheus server listen on loopback, so that it does not bind against the Pod IP.##listenLocal: false## EnableAdminAPI enables Prometheus the administrative HTTP API which includes functionality such as deleting time series.## This is disabled by default.## ref: https://prometheus.io/docs/prometheus/latest/querying/api/#tsdb-admin-apis##enableAdminAPI: false## Image of Prometheus.##image:repository: quay.io/prometheus/prometheustag: v2.15.2## Tolerations for use with node taints## ref: https://kubernetes.io/docs/concepts/configuration/taint-and-toleration/##tolerations: []#  - key: "key"#    operator: "Equal"#    value: "value"#    effect: "NoSchedule"## Alertmanagers to which alerts will be sent## ref: https://github.com/coreos/prometheus-operator/blob/master/Documentation/api.md#alertmanagerendpoints#### Default configuration will connect to the alertmanager deployed as part of this release##alertingEndpoints: []# - name: ""#   namespace: ""#   port: http#   scheme: http#   pathPrefix: ""#   tlsConfig: {}#   bearerTokenFile: ""#   apiVersion: v2## External labels to add to any time series or alerts when communicating with external systems##externalLabels: {}## Name of the external label used to denote replica name##replicaExternalLabelName: ""## If true, the Operator won't add the external label used to denote replica name##replicaExternalLabelNameClear: false## Name of the external label used to denote Prometheus instance name##prometheusExternalLabelName: ""## If true, the Operator won't add the external label used to denote Prometheus instance name##prometheusExternalLabelNameClear: false## External URL at which Prometheus will be reachable.##externalUrl: ""## Define which Nodes the Pods are scheduled on.## ref: https://kubernetes.io/docs/user-guide/node-selection/##nodeSelector: {}## Secrets is a list of Secrets in the same namespace as the Prometheus object, which shall be mounted into the Prometheus Pods.## The Secrets are mounted into /etc/prometheus/secrets/. Secrets changes after initial creation of a Prometheus object are not## reflected in the running Pods. To change the secrets mounted into the Prometheus Pods, the object must be deleted and recreated## with the new list of secrets.##secrets: []## ConfigMaps is a list of ConfigMaps in the same namespace as the Prometheus object, which shall be mounted into the Prometheus Pods.## The ConfigMaps are mounted into /etc/prometheus/configmaps/.##configMaps: []## QuerySpec defines the query command line flags when starting Prometheus.## ref: https://github.com/coreos/prometheus-operator/blob/master/Documentation/api.md#queryspec##query: {}## Namespaces to be selected for PrometheusRules discovery.## If nil, select own namespace. Namespaces to be selected for ServiceMonitor discovery.## See https://github.com/coreos/prometheus-operator/blob/master/Documentation/api.md#namespaceselector for usage##ruleNamespaceSelector: {}## If true, a nil or {} value for prometheus.prometheusSpec.ruleSelector will cause the## prometheus resource to be created with selectors based on values in the helm deployment,## which will also match the PrometheusRule resources created##ruleSelectorNilUsesHelmValues: true## PrometheusRules to be selected for target discovery.## If {}, select all ServiceMonitors##ruleSelector: {}## Example which select all prometheusrules resources## with label "prometheus" with values any of "example-rules" or "example-rules-2"# ruleSelector:#   matchExpressions:#     - key: prometheus#       operator: In#       values:#         - example-rules#         - example-rules-2### Example which select all prometheusrules resources with label "role" set to "example-rules"# ruleSelector:#   matchLabels:#     role: example-rules## If true, a nil or {} value for prometheus.prometheusSpec.serviceMonitorSelector will cause the## prometheus resource to be created with selectors based on values in the helm deployment,## which will also match the servicemonitors created##serviceMonitorSelectorNilUsesHelmValues: true## ServiceMonitors to be selected for target discovery.## If {}, select all ServiceMonitors##serviceMonitorSelector: {}## Example which selects ServiceMonitors with label "prometheus" set to "somelabel"# serviceMonitorSelector:#   matchLabels:#     prometheus: somelabel## Namespaces to be selected for ServiceMonitor discovery.## See https://github.com/coreos/prometheus-operator/blob/master/Documentation/api.md#namespaceselector for usage##serviceMonitorNamespaceSelector: {}## If true, a nil or {} value for prometheus.prometheusSpec.podMonitorSelector will cause the## prometheus resource to be created with selectors based on values in the helm deployment,## which will also match the podmonitors created##podMonitorSelectorNilUsesHelmValues: true## PodMonitors to be selected for target discovery.## If {}, select all PodMonitors##podMonitorSelector: {}## Example which selects PodMonitors with label "prometheus" set to "somelabel"# podMonitorSelector:#   matchLabels:#     prometheus: somelabel## Namespaces to be selected for PodMonitor discovery.## See https://github.com/coreos/prometheus-operator/blob/master/Documentation/api.md#namespaceselector for usage##podMonitorNamespaceSelector: {}## How long to retain metrics##retention: 10d## Maximum size of metrics##retentionSize: ""## Enable compression of the write-ahead log using Snappy.##walCompression: false## If true, the Operator won't process any Prometheus configuration changes##paused: false## Number of Prometheus replicas desired##replicas: 1## Log level for Prometheus be configured in##logLevel: info## Log format for Prometheus be configured in##logFormat: logfmt## Prefix used to register routes, overriding externalUrl route.## Useful for proxies that rewrite URLs.##routePrefix: /## Standard object’s metadata. More info: https://github.com/kubernetes/community/blob/master/contributors/devel/sig-architecture/api-conventions.md#metadata## Metadata Labels and Annotations gets propagated to the prometheus pods.##podMetadata: {}# labels:#   app: prometheus#   k8s-app: prometheus## Pod anti-affinity can prevent the scheduler from placing Prometheus replicas on the same node.## The default value "soft" means that the scheduler should *prefer* to not schedule two replica pods onto the same node but no guarantee is provided.## The value "hard" means that the scheduler is *required* to not schedule two replica pods onto the same node.## The value "" will disable pod anti-affinity so that no anti-affinity rules will be configured.podAntiAffinity: ""## If anti-affinity is enabled sets the topologyKey to use for anti-affinity.## This can be changed to, for example, failure-domain.beta.kubernetes.io/zone##podAntiAffinityTopologyKey: kubernetes.io/hostname## Assign custom affinity rules to the prometheus instance## ref: https://kubernetes.io/docs/concepts/configuration/assign-pod-node/##affinity: {}# nodeAffinity:#   requiredDuringSchedulingIgnoredDuringExecution:#     nodeSelectorTerms:#     - matchExpressions:#       - key: kubernetes.io/e2e-az-name#         operator: In#         values:#         - e2e-az1#         - e2e-az2## The remote_read spec configuration for Prometheus.## ref: https://github.com/coreos/prometheus-operator/blob/master/Documentation/api.md#remotereadspecremoteRead: []# - url: http://remote1/read## The remote_write spec configuration for Prometheus.## ref: https://github.com/coreos/prometheus-operator/blob/master/Documentation/api.md#remotewritespecremoteWrite: []# - url: http://remote1/push## Enable/Disable Grafana dashboards provisioning for prometheus remote write featureremoteWriteDashboards: false## Resource limits & requests##resources: {}# requests:#   memory: 400Mi## Prometheus StorageSpec for persistent data## ref: https://github.com/coreos/prometheus-operator/blob/master/Documentation/user-guides/storage.md##storageSpec: {}#  volumeClaimTemplate:#    spec:#      storageClassName: gluster#      accessModes: ["ReadWriteOnce"]#      resources:#        requests:#          storage: 50Gi#    selector: {}## AdditionalScrapeConfigs allows specifying additional Prometheus scrape configurations. Scrape configurations## are appended to the configurations generated by the Prometheus Operator. Job configurations must have the form## as specified in the official Prometheus documentation:## https://prometheus.io/docs/prometheus/latest/configuration/configuration/#scrape_config. As scrape configs are## appended, the user is responsible to make sure it is valid. Note that using this feature may expose the possibility## to break upgrades of Prometheus. It is advised to review Prometheus release notes to ensure that no incompatible## scrape configs are going to break Prometheus after the upgrade.#### The scrape configuraiton example below will find master nodes, provided they have the name .*mst.*, relabel the## port to 2379 and allow etcd scraping provided it is running on all Kubernetes master nodes##additionalScrapeConfigs: []# - job_name: kube-etcd#   kubernetes_sd_configs:#     - role: node#   scheme: https#   tls_config:#     ca_file:   /etc/prometheus/secrets/etcd-client-cert/etcd-ca#     cert_file: /etc/prometheus/secrets/etcd-client-cert/etcd-client#     key_file:  /etc/prometheus/secrets/etcd-client-cert/etcd-client-key#   relabel_configs:#   - action: labelmap#     regex: __meta_kubernetes_node_label_(.+)#   - source_labels: [__address__]#     action: replace#     targetLabel: __address__#     regex: ([^:;]+):(\d+)#     replacement: ${1}:2379#   - source_labels: [__meta_kubernetes_node_name]#     action: keep#     regex: .*mst.*#   - source_labels: [__meta_kubernetes_node_name]#     action: replace#     targetLabel: node#     regex: (.*)#     replacement: ${1}#   metric_relabel_configs:#   - regex: (kubernetes_io_hostname|failure_domain_beta_kubernetes_io_region|beta_kubernetes_io_os|beta_kubernetes_io_arch|beta_kubernetes_io_instance_type|failure_domain_beta_kubernetes_io_zone)#     action: labeldrop## additionalPrometheusSecretsAnnotations allows to add annotations to the kubernetes secret. This can be useful## when deploying via spinnaker to disable versioning on the secret, strategy.spinnaker.io/versioned: 'false'additionalPrometheusSecretsAnnotations: {}## AdditionalAlertManagerConfigs allows for manual configuration of alertmanager jobs in the form as specified## in the official Prometheus documentation https://prometheus.io/docs/prometheus/latest/configuration/configuration/#<alertmanager_config>.## AlertManager configurations specified are appended to the configurations generated by the Prometheus Operator.## As AlertManager configs are appended, the user is responsible to make sure it is valid. Note that using this## feature may expose the possibility to break upgrades of Prometheus. It is advised to review Prometheus release## notes to ensure that no incompatible AlertManager configs are going to break Prometheus after the upgrade.##additionalAlertManagerConfigs: []# - consul_sd_configs:#   - server: consul.dev.test:8500#     scheme: http#     datacenter: dev#     tag_separator: ','#     services:#       - metrics-prometheus-alertmanager## AdditionalAlertRelabelConfigs allows specifying Prometheus alert relabel configurations. Alert relabel configurations specified are appended## to the configurations generated by the Prometheus Operator. Alert relabel configurations specified must have the form as specified in the## official Prometheus documentation: https://prometheus.io/docs/prometheus/latest/configuration/configuration/#alert_relabel_configs.## As alert relabel configs are appended, the user is responsible to make sure it is valid. Note that using this feature may expose the## possibility to break upgrades of Prometheus. It is advised to review Prometheus release notes to ensure that no incompatible alert relabel## configs are going to break Prometheus after the upgrade.##additionalAlertRelabelConfigs: []# - separator: ;#   regex: prometheus_replica#   replacement: $1#   action: labeldrop## SecurityContext holds pod-level security attributes and common container settings.## This defaults to non root user with uid 1000 and gid 2000.## https://github.com/coreos/prometheus-operator/blob/master/Documentation/api.md##securityContext:runAsNonRoot: truerunAsUser: 1000fsGroup: 2000## 	Priority class assigned to the Pods##priorityClassName: ""## Thanos configuration allows configuring various aspects of a Prometheus server in a Thanos environment.## This section is experimental, it may change significantly without deprecation notice in any release.## This is experimental and may change significantly without backward compatibility in any release.## ref: https://github.com/coreos/prometheus-operator/blob/master/Documentation/api.md#thanosspec##thanos: {}## Containers allows injecting additional containers. This is meant to allow adding an authentication proxy to a Prometheus pod.##  if using proxy extraContainer  update targetPort with proxy container portcontainers: []## Enable additional scrape configs that are managed externally to this chart. Note that the prometheus## will fail to provision if the correct secret does not exist.## This option requires that you are maintaining a secret in the same namespace as Prometheus with## a name of 'prometheus-operator-prometheus-scrape-confg' and a key of 'additional-scrape-configs.yaml' that## contains a list of scrape_config's. The name of the secret may vary if you utilize the "fullnameOverride".## This feature cannot be used in conjunction with the additionalScrapeConfigs attribute (the helm-generated## secret will overwrite your self-maintained secret).#### scrape_config docs: https://prometheus.io/docs/prometheus/latest/configuration/configuration/#scrape_config## explanation of "confg" typo: https://github.com/helm/charts/issues/13368additionalScrapeConfigsExternal: false## PortName to use for Prometheus.##portName: "web"additionalServiceMonitors:- name: "hc"namespaceSelector:any: trueselector:matchLabels:geek: app-metricsendpoints:- path: /metricsport: http- name: ""namespaceSelector:any: trueselector:matchLabels:geek: app-metricsendpoints:- path: /metricsport: http## Name of the ServiceMonitor to create### - name: ""## Additional labels to set used for the ServiceMonitorSelector. Together with standard labels from## the chart### additionalLabels: {}## Service label for use in assembling a job name of the form <label value>-<port>## If no label is specified, the service name is used.### jobLabel: ""## labels to transfer from the kubernetes service to the target### targetLabels: ""## Label selector for services to which this ServiceMonitor applies### selector: {}## Namespaces from which services are selected### namespaceSelector:## Match any namespace### any: false## Explicit list of namespace names to select### matchNames: []## Endpoints of the selected service to be monitored### endpoints: []## Name of the endpoint's service port## Mutually exclusive with targetPort# - port: ""## Name or number of the endpoint's target port## Mutually exclusive with port# - targetPort: ""## File containing bearer token to be used when scraping targets###   bearerTokenFile: ""## Interval at which metrics should be scraped###   interval: 30s## HTTP path to scrape for metrics###   path: /metrics## HTTP scheme to use for scraping###   scheme: http## TLS configuration to use when scraping the endpoint###   tlsConfig:## Path to the CA file### caFile: ""## Path to client certificate file### certFile: ""## Skip certificate verification### insecureSkipVerify: false## Path to client key file### keyFile: ""## Server name used to verify host name### serverName: ""additionalPodMonitors: []## Name of the PodMonitor to create### - name: ""## Additional labels to set used for the PodMonitorSelector. Together with standard labels from## the chart### additionalLabels: {}## Pod label for use in assembling a job name of the form <label value>-<port>## If no label is specified, the pod endpoint name is used.### jobLabel: ""## Label selector for pods to which this PodMonitor applies### selector: {}## PodTargetLabels transfers labels on the Kubernetes Pod onto the target.### podTargetLabels: {}## SampleLimit defines per-scrape limit on number of scraped samples that will be accepted.### sampleLimit: 0## Namespaces from which pods are selected### namespaceSelector:## Match any namespace### any: false## Explicit list of namespace names to select### matchNames: []## Endpoints of the selected pods to be monitored## https://github.com/coreos/prometheus-operator/blob/master/Documentation/api.md#podmetricsendpoint### podMetricsEndpoints: []
总结
在prometheus-operator架构中ServiceMonitor是比较核心的对象,这个对象可以通过values.yaml文件中additionServiceMonitors去配置,通过matchLabels去定义服务的selector策略。需要注意的是path和port,
port的名称需要与service定义的是相同的
2. Granfana实现监控看板
2.1 Granfana核心特性
- 支持各种主流数据源
- 丰富的图形组件
- 灵活的看板组织方式
- 灵活的权限支持
- 支持OAuth账户支持
2.2 部署文件
grafana:enabled: true## Deploy default dashboards.##defaultDashboardsEnabled: trueadminPassword: adminingress:## If true, Grafana Ingress will be created##enabled: true## Annotations for Grafana Ingress##annotations: {}# kubernetes.io/ingress.class: nginx# kubernetes.io/tls-acme: "true"## Labels to be added to the Ingress##labels: {}## Hostnames.## Must be provided if Ingress is enable.##hosts:- grafana.local## Path for grafana ingresspath: /## TLS configuration for grafana Ingress## Secret must be manually created in the namespace##tls: []# - secretName: grafana-general-tls# hosts:# - grafana.example.com...// 在默认的prometheus作为数据源的基础上再添加其他数据源additionalDataSources: []# - name: prometheus-sample# access: proxy# basicAuth: true# basicAuthPassword: pass# basicAuthUser: daco# editable: false# jsonData:# tlsSkipVerify: true# orgId: 1# type: prometheus# url: https://prometheus.svc:9090# version: 13. prometheus-net收集自定义指标
prometheus-net是开源组件,
项目地址:prometheus-net Github地址
3.1 组件包
- prometheus-net
- prometheus-net.AspNetCore
3.2 使用场景
- 应用运行状况指标
- 自定义指标
// startup
public void Configure(IApplicationBuilder app, IWebHostEnvironment env)
{...endpoints.MapMetrics();// 将metrics映射出来...
}// 输出自定义指标
[HttpGet]
public async Task GetMetricsAsync()
{var r = Metric.NewCustomRegistry();MetricFactory f = Metric.WithCustomRegistry(r);r.AddBeforeCollectCallback(() =>{f.CreateCounter("counter_v1", "").Inc(100);});Response.ContentType = PrometheusConstants.ExporterContentType;Response.StatusCode = 200;await r.CollectAndExportAsTextAsync(Response.Body, HttpContext.RequestAborted);
}