推荐:使用 NSDT场景编辑器 快速搭建3D应用场景
Pandas AI 是一个 Python 库,它利用生成 AI 的强大功能来增强流行的数据分析库 Pandas。只需一个简单的提示,Pandas AI 就可以让你执行复杂的数据清理、分析和可视化,而这以前需要很多行代码。
除了处理数字之外,Pandas AI还理解自然语言。您可以用简单的英语询问有关数据的问题,它将以日常语言提供摘要和见解,使您免于破译复杂的图形和表格。
在下面的示例中,我们提供了一个 Pandas 数据帧,并要求生成 AI 创建条形图。结果令人印象深刻。
pandas_ai.run(df, prompt='Plot the bar chart of type of media for each year release, using different colors.')
注意:代码示例来自 Pandas AI:您的生成式 AI 驱动的数据分析指南教程。
在这篇文章中,我们将使用LlamaIndex来创建类似的工具,这些工具可以理解Pandas数据框架并产生复杂的结果,如上所示。
LlamaIndex支持通过聊天和代理对数据进行自然语言查询。它允许大型语言模型大规模解释私有数据,而无需对新数据进行重新训练。它将大型语言模型与各种数据源和工具集成在一起。LlamaIndex是一个数据框架,只需几行代码即可轻松创建带有PDF应用程序的聊天。
建立
您可以使用该命令安装 Python 库。pip
pip install llama-index默认情况下,LlamaIndex使用OpenAI模型进行文本生成以及检索和嵌入。为了轻松运行代码,我们必须设置 .我们可以在新的 API 令牌页面上免费注册并获取 API 密钥。gpt-3.5-turbotext-embedding-ada-002OPENAI_API_KEY
import os
os.environ["OPENAI_API_KEY"] = "sk-xxxxxx"
它们还支持Anthropic,Hugging Face,PaLM和更多模型的集成。您可以通过阅读模块的文档来了解有关它的所有信息。
熊猫查询引擎
让我们进入创建自己的PandasAI的主要主题。安装库并设置 API 密钥后,我们将创建一个简单的城市数据帧,以城市名称和人口作为列。
import pandas as pd
from llama_index.query_engine.pandas_query_engine import PandasQueryEngine
df = pd.DataFrame({"city": ["New York", "Islamabad", "Mumbai"], "population": [8804190, 1009832, 12478447]}
)使用 ,我们将创建一个查询引擎来加载数据帧并为其编制索引。PandasQueryEngine
之后,我们将编写一个查询并显示响应。
query_engine = PandasQueryEngine(df=df)response = query_engine.query("What is the city with the lowest population?",
)
如我们所见,它开发了 Python 代码,用于在数据帧中显示人口最少的城市。
> Pandas Instructions:
```
eval("df.loc[df['population'].idxmin()]['city']")
```
eval("df.loc[df['population'].idxmin()]['city']")
> Pandas Output: Islamabad
而且,如果你打印回复,你会得到“伊斯兰堡”。这很简单,但令人印象深刻。您不必提出自己的逻辑或围绕代码进行实验。只需输入问题,您就会得到答案。
print(response)Islamabad您还可以使用响应元数据打印结果背后的代码。
print(response.metadata["pandas_instruction_str"])eval("df.loc[df['population'].idxmin()]['city']")全球优酷统计分析
在第二个示例中,我们将从 Kaggle 加载 2023 年全球 YouTube 统计数据集并执行一些基本面分析。这是从简单示例迈出的一步。
我们将用于将数据集加载到查询引擎中。然后我们将编写提示,仅显示具有缺失值和缺失值数量的列。read_csv
df_yt = pd.read_csv("Global YouTube Statistics.csv")
query_engine = PandasQueryEngine(df=df_yt, verbose=True)response = query_engine.query("List the columns with missing values and the number of missing values. Only show missing values columns.",
)
> Pandas Instructions:
```
df.isnull().sum()[df.isnull().sum() > 0]
```
df.isnull().sum()[df.isnull().sum() > 0]
> Pandas Output: category 46
Country 122
Abbreviation 122
channel_type 30
video_views_rank 1
country_rank 116
channel_type_rank 33
video_views_for_the_last_30_days 56
subscribers_for_last_30_days 337
created_year 5
created_month 5
created_date 5
Gross tertiary education enrollment (%) 123
Population 123
Unemployment rate 123
Urban_population 123
Latitude 123
Longitude 123
dtype: int64现在,我们将直接询问有关流行频道类型的问题。在我看来,LlamdaIndex查询引擎非常准确,还没有产生任何幻觉。
response = query_engine.query("Which channel type have the most views.",
)
> Pandas Instructions:
```
eval("df.groupby('channel_type')['video views'].sum().idxmax()")
```
eval("df.groupby('channel_type')['video views'].sum().idxmax()")
> Pandas Output: Entertainment
Entertainment最后,我们将要求它可视化barchat,结果是惊人的。
response = query_engine.query("Visualize barchat of top ten youtube channels based on subscribers and add the title.",
)
> Pandas Instructions:
```
eval("df.nlargest(10, 'subscribers')[['Youtuber', 'subscribers']].plot(kind='bar', x='Youtuber', y='subscribers', title='Top Ten YouTube Channels Based on Subscribers')")
```
eval("df.nlargest(10, 'subscribers')[['Youtuber', 'subscribers']].plot(kind='bar', x='Youtuber', y='subscribers', title='Top Ten YouTube Channels Based on Subscribers')")
> Pandas Output: AxesSubplot(0.125,0.11;0.775x0.77)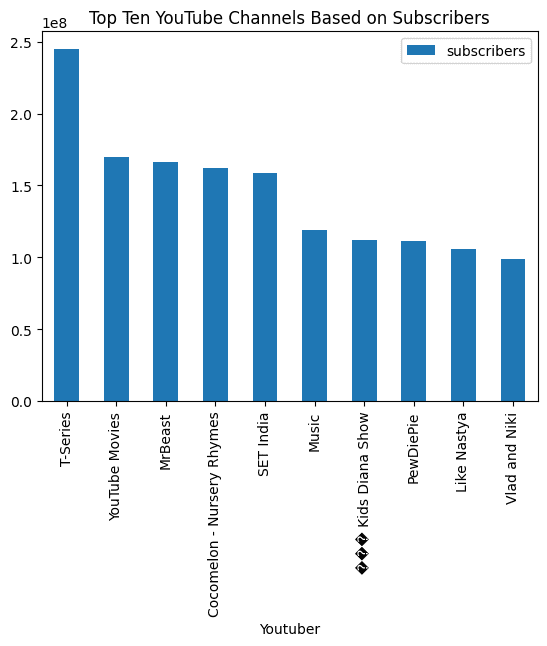
通过简单的提示和查询引擎,我们可以自动化数据分析并执行复杂的任务。喇嘛指数还有更多。我强烈建议您阅读官方文档并尝试构建令人惊叹的东西。
结论
总之,LlamaIndex是一个令人兴奋的新工具,它允许开发人员创建自己的PandasAI - 利用大型语言模型的强大功能进行直观的数据分析和对话。通过使用 LlamaIndex 索引和嵌入数据集,您可以对私有数据启用高级自然语言功能,而不会影响安全性或重新训练模型。
这只是一个开始,使用LlamaIndex,您可以构建文档,聊天机器人,自动化AI,知识图谱,AI SQL查询引擎,全栈Web应用程序的问答,并构建私有生成AI应用程序。
原文链接:使用LlamaIndex构建自己的PandasAI (mvrlink.com)

