今日已办
Docker Monitoring with cAdvisor, Prometheus and Grafana
- Docker Monitoring with cAdvisor, Prometheus and Grafana | by Mertcan Simsek | Medium
- Monitoring Docker container metrics using cAdvisor | Prometheus
prometheus.yml
global:scrape_interval: 10s # Set the scrape interval to every 15 seconds. Default is every 1 minute.evaluation_interval: 10s # Evaluate rules every 15 seconds. The default is every 1 minute.# scrape_timeout is set to the global default (10s).scrape_configs:- job_name: aggregated-trace-metricsstatic_configs:- targets: [ 'otel_collector:8889' ]- job_name: cadvisormetrics_path: /cadvisor/metricsstatic_configs:- targets: [ 'cadvisor:8080' ]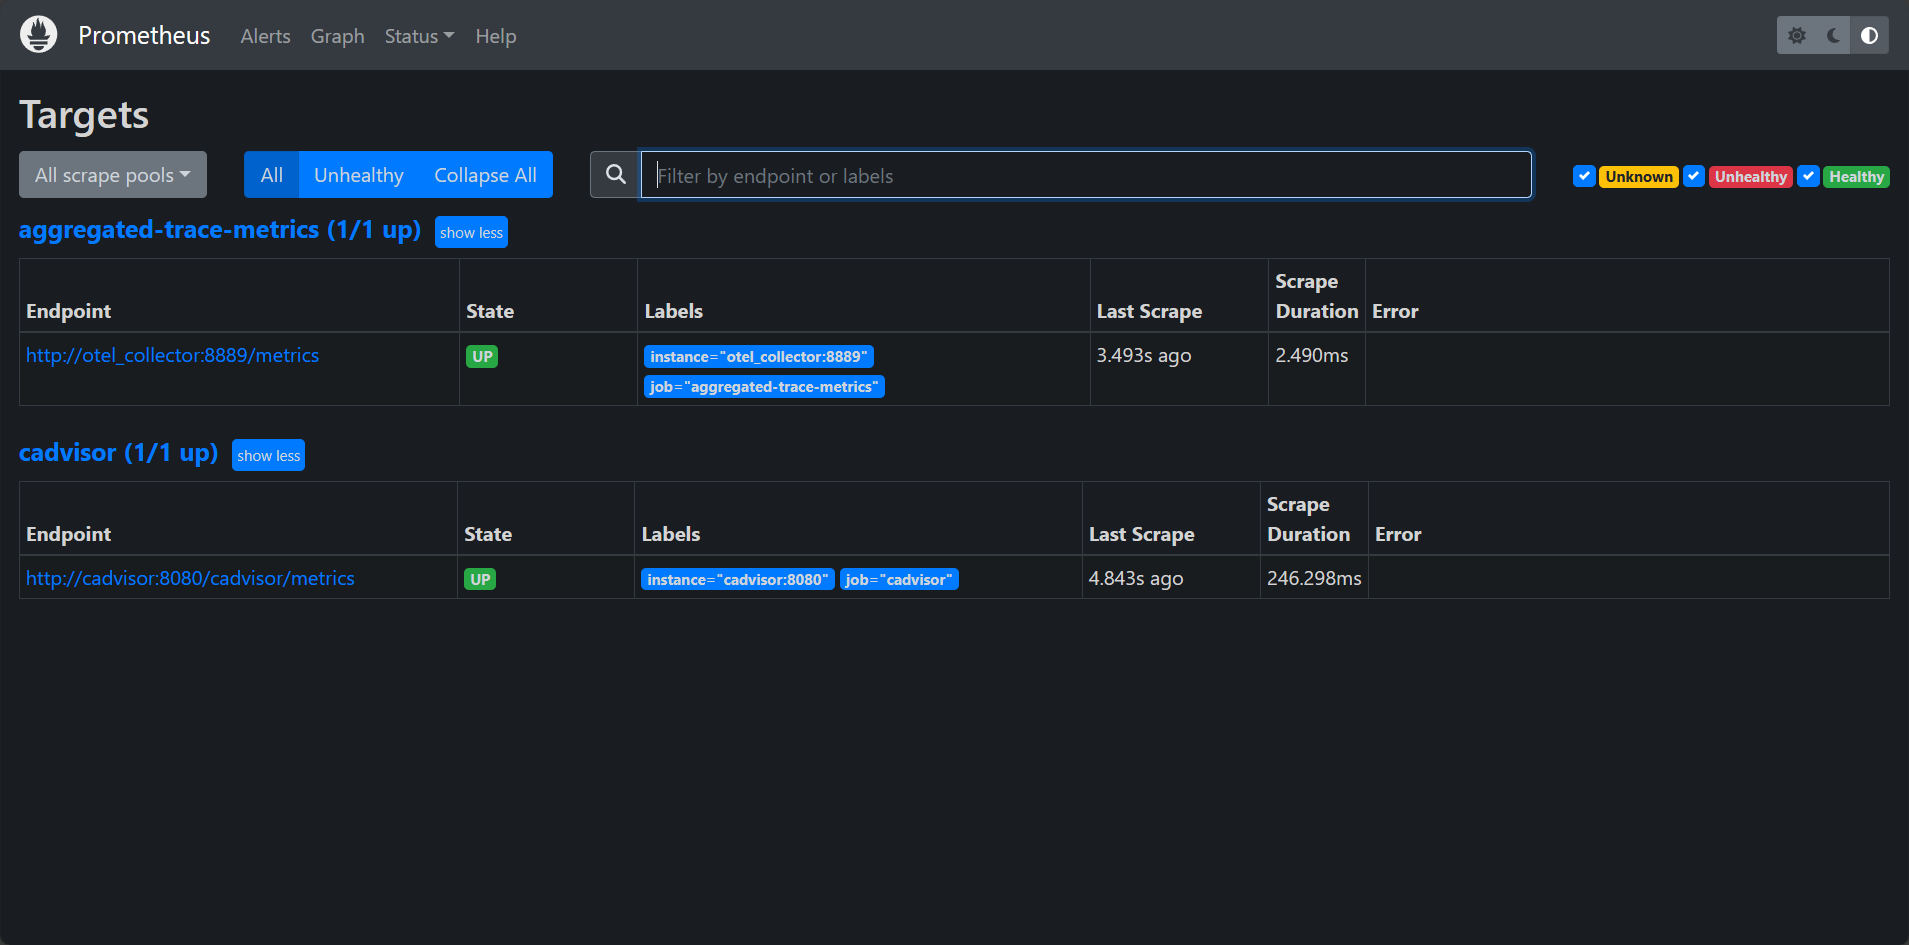
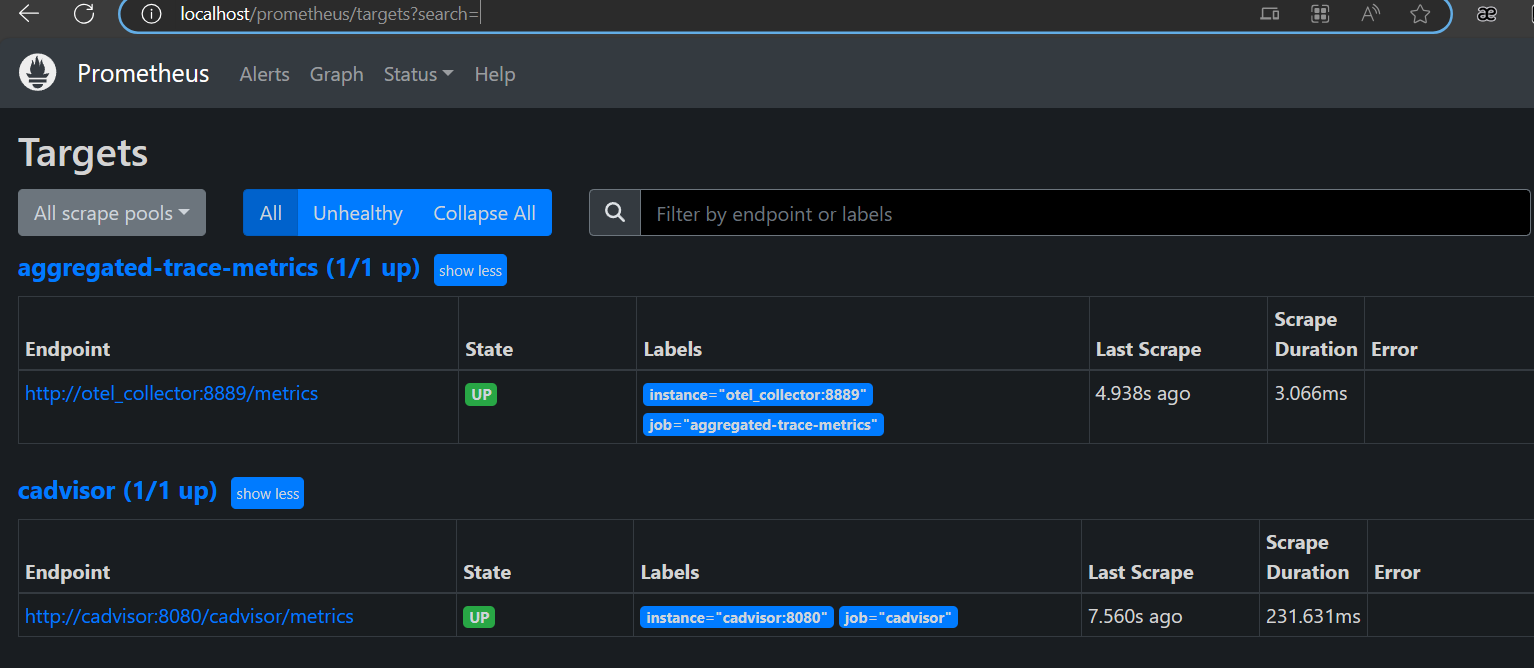
可以收集到 cadvisor 监控的各个容器的指标
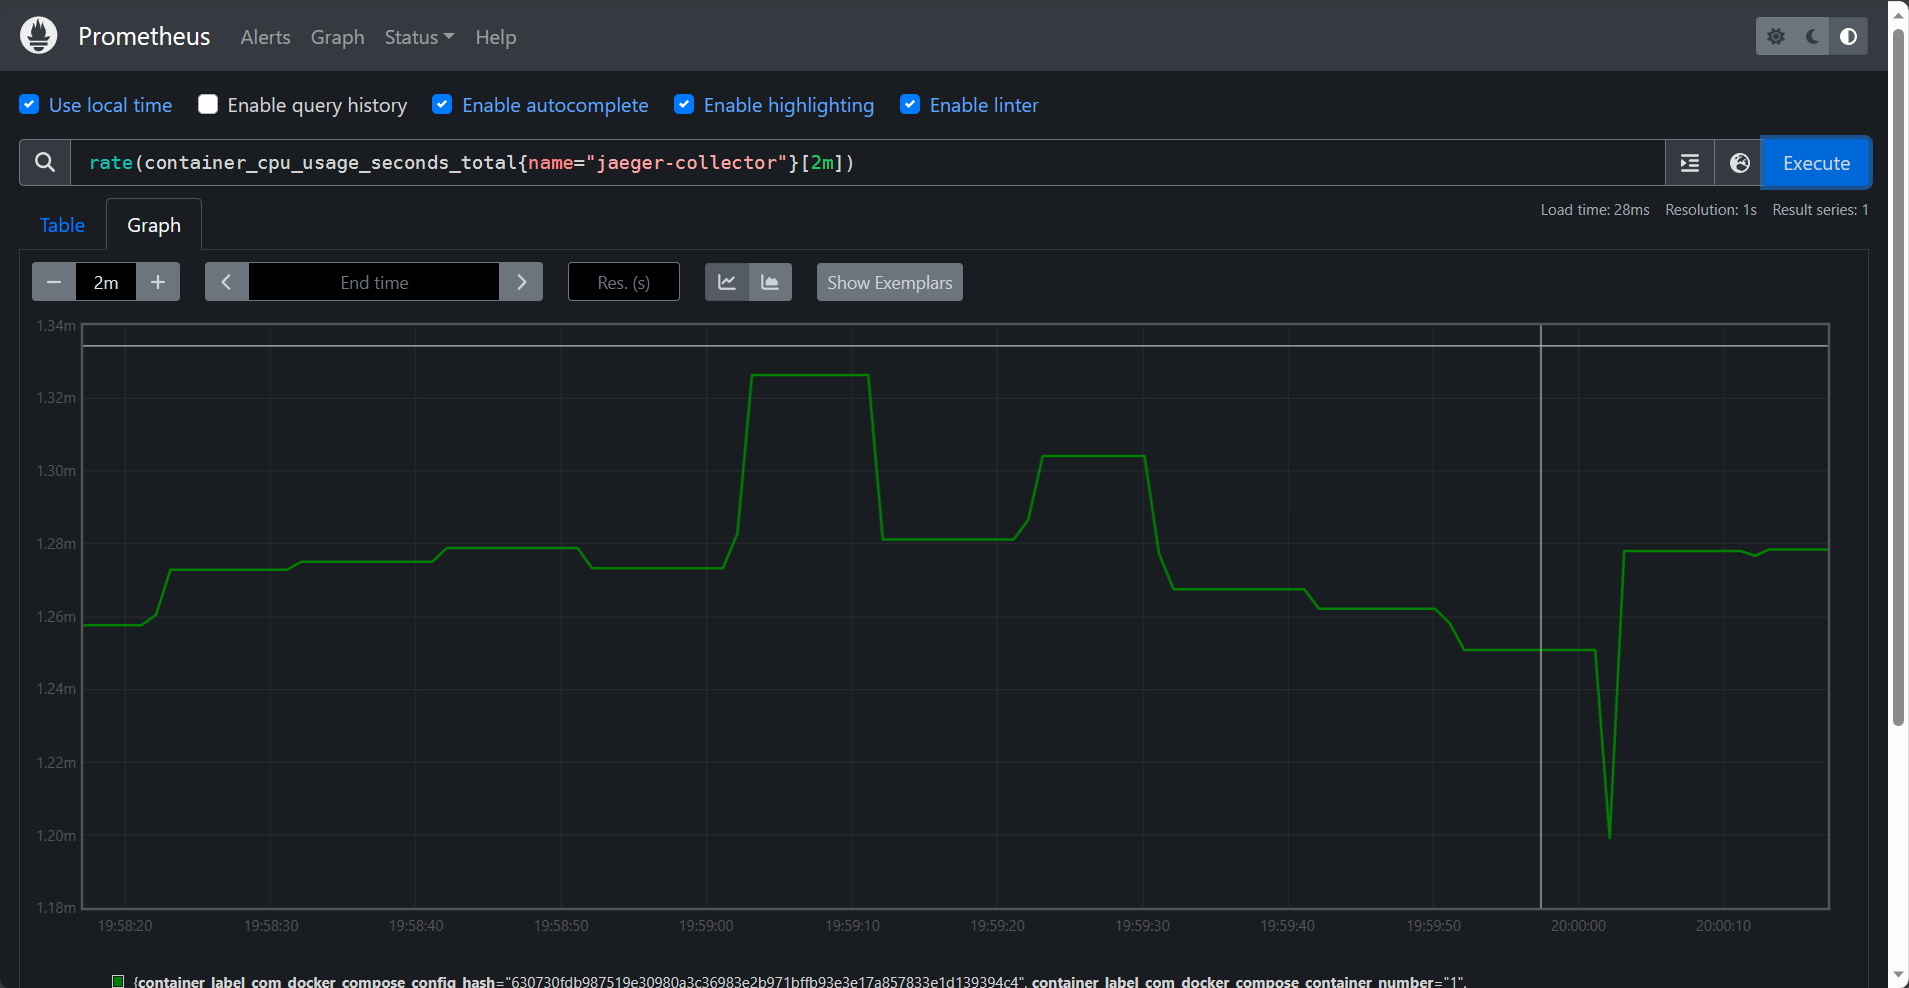
- cadvisor/docs/api.md at master · google/cadvisor (github.com)
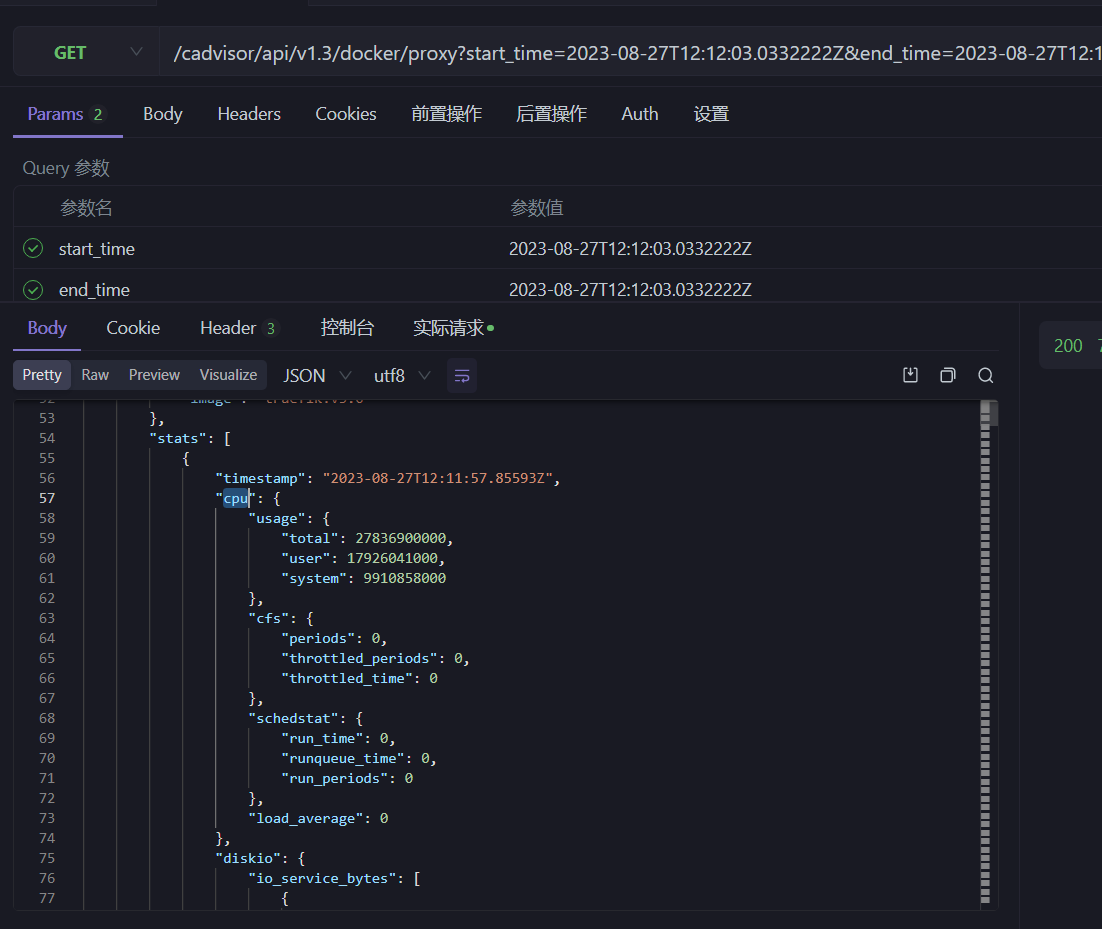
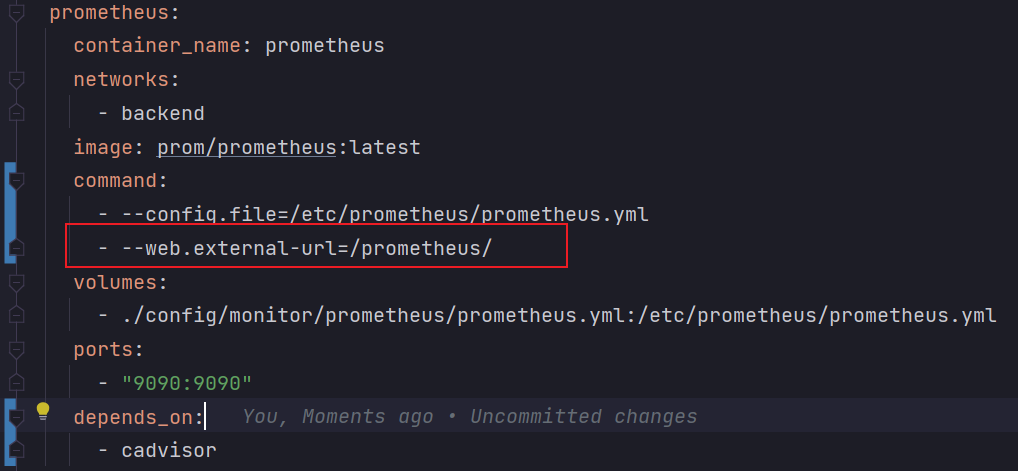
修复了 Prometheus 修改 web 前缀的问题
-
[Using external URLs and proxies with Prometheus – Robust Perception | Prometheus Monitoring Experts](https://www.robustperception.io/using-external-urls-and-proxies-with-prometheus/#:~:text=prometheus --web.external-url %3A19090%2Fprometheus%2F You should be aware that,The %2Fmetrics will be on %3A9090%2Fprometheus%2Fmetrics for example.)
-
Prometheus Routing and Routing Configuration with Nginx Reverse Proxy - SoByte
成功使用 traefik 代理
明日待办
- 完成课程报告
- 制作PPT






![[LLM+AIGC] 01.应用篇之中文ChatGPT初探及利用ChatGPT润色论文对比浅析(文心一言 | 讯飞星火)](https://img-blog.csdnimg.cn/884dddb999f9445187be8174b7f6b9e3.jpeg#pic_center)
