Figure 窗口初始化
figure 使用默认属性值创建一个新的图窗窗口。生成的图窗为当前图窗。f = figure(___) 返回 Figure 对象。可使用 f 在创建图窗后查询或修改其属性。figure(f) 将 f 指定的图窗作为当前图窗,并将其显示在其他所有图窗的上面。
figure(n) 查找 Number 属性等于 n 的图窗,并将其作为当前图窗。如果不存在具有该属性值的图窗,MATLAB® 将创建一个新图窗并将其 Number 属性设置为 n。
指定图窗标题
创建一个图窗并指定 Name 属性。默认情况下,生成的标题包含图窗编号。
figure('Name','Measured Data');
再次指定 Name 属性,但这次将 NumberTitle 属性设置为 ‘off’。生成的标题不包含图窗编号。
figure('Name','Measured Data','NumberTitle','off');
将背景色设置为白色
figure('Color','white')
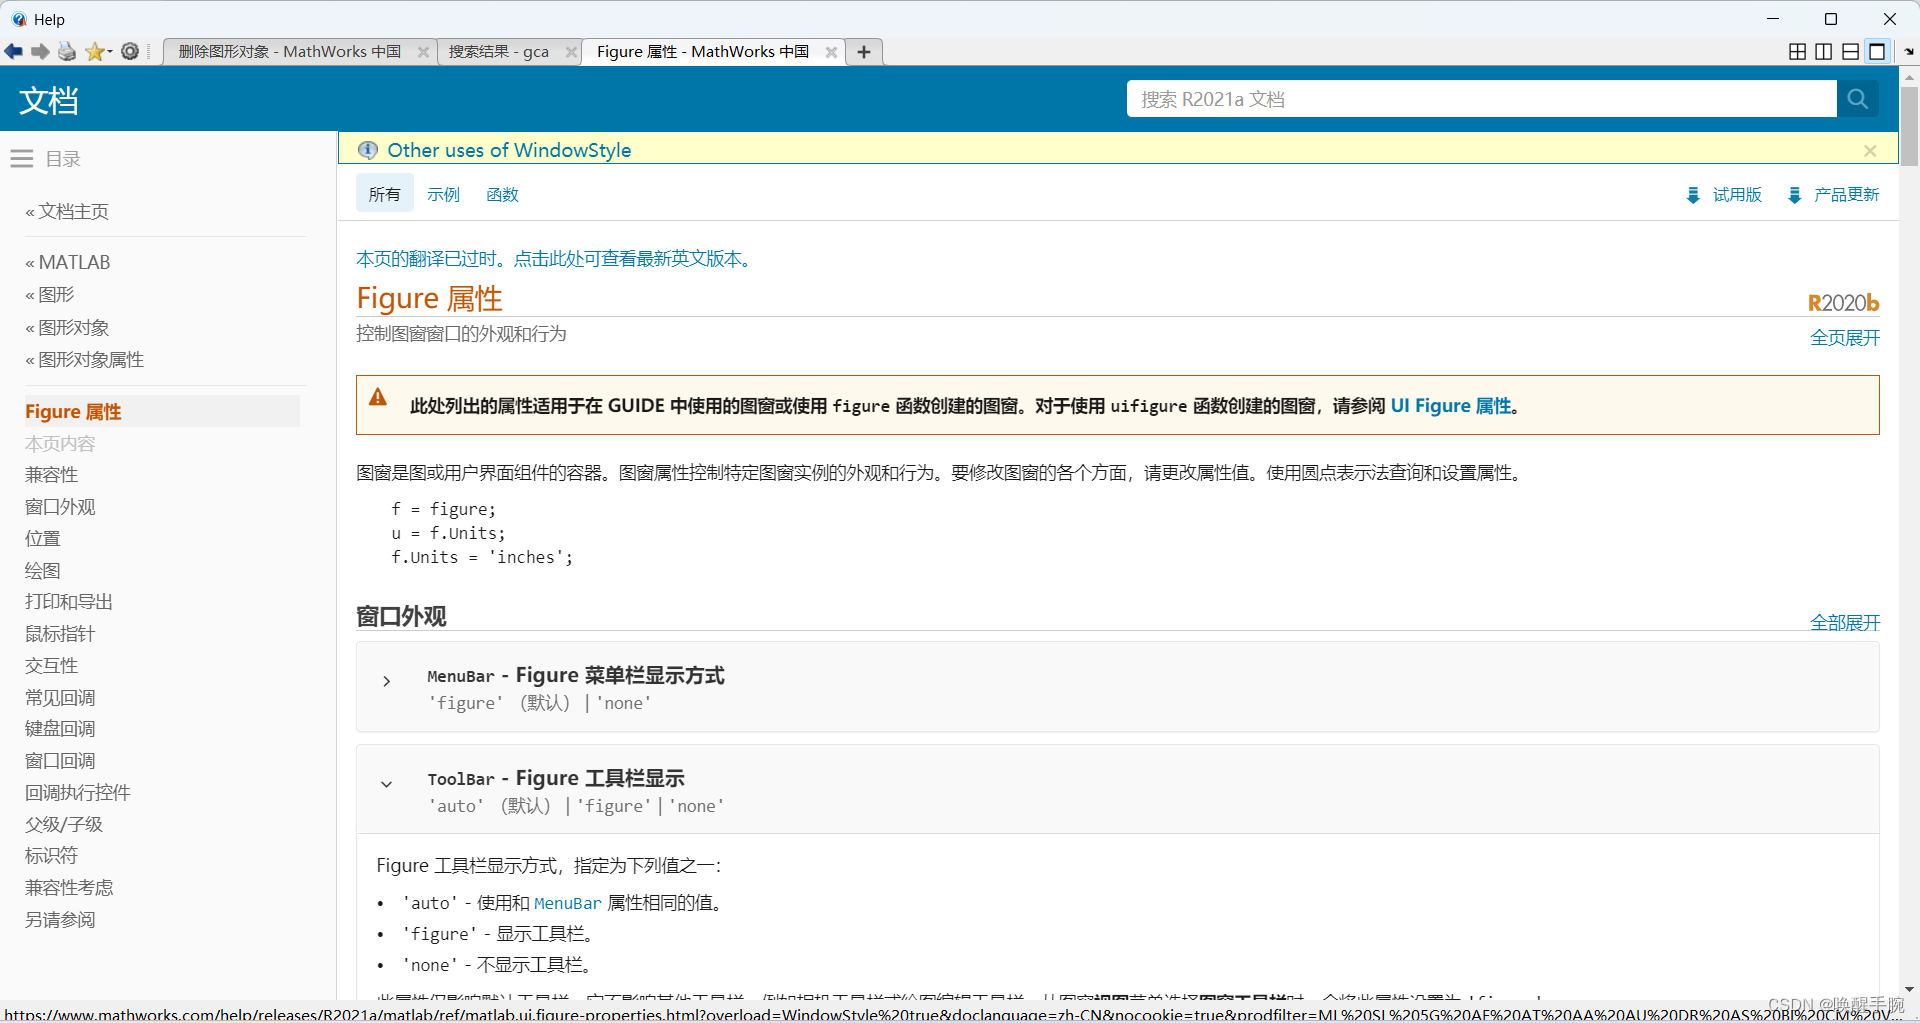
figure 属性
Alphamap: [1×64 double]BeingDeleted: offBusyAction: 'queue'ButtonDownFcn: ''Children: [0×0 GraphicsPlaceholder]Clipping: onCloseRequestFcn: 'closereq'Color: [0.9400 0.9400 0.9400]Colormap: [256×3 double]ContextMenu: [0×0 GraphicsPlaceholder]CreateFcn: ''CurrentAxes: [0×0 GraphicsPlaceholder]CurrentCharacter: ''CurrentObject: [0×0 GraphicsPlaceholder]CurrentPoint: [0 0]DeleteFcn: ''DockControls: onFileName: ''GraphicsSmoothing: onHandleVisibility: 'on'Icon: ''InnerPosition: [488 342 560 420]IntegerHandle: onInterruptible: onInvertHardcopy: onKeyPressFcn: ''KeyReleaseFcn: ''MenuBar: 'figure' (默认) | 'none'Name: 'Measured Data'NextPlot: 'add'Number: 2NumberTitle: onOuterPosition: [481 334.6000 574.4000 508.8000]PaperOrientation: 'portrait'PaperPosition: [1.3333 3.3125 5.8333 4.3750]PaperPositionMode: 'auto'PaperSize: [8.5000 11]PaperType: 'usletter'PaperUnits: 'inches'Parent: [1×1 Root]Pointer: 'arrow'PointerShapeCData: [16×16 double]PointerShapeHotSpot: [1 1]Position: [488 342 560 420]Renderer: 'opengl'RendererMode: 'auto'Resize: onScrollable: offSelectionType: 'normal'SizeChangedFcn: ''Tag: ''ToolBar: 'auto'Type: 'figure'Units: 'pixels'UserData: []Visible: onWindowButtonDownFcn: ''WindowButtonMotionFcn: ''WindowButtonUpFcn: ''WindowKeyPressFcn: ''WindowKeyReleaseFcn: ''WindowScrollWheelFcn: ''WindowState: 'normal' (默认) | 'minimized' | 'maximized' | 'fullscreen'WindowStyle: 'normal' (默认) | 'modal' | 'docked'Figure gca 坐标轴
ALim: [0 1]ALimMode: 'auto'AlphaScale: 'linear'Alphamap: [1×64 double]AmbientLightColor: [1 1 1]BeingDeleted: offBox: offBoxStyle: 'back'BusyAction: 'queue'ButtonDownFcn: ''CLim: [0 1]CLimMode: 'auto'CameraPosition: [0.5000 0.5000 9.1603]CameraPositionMode: 'auto'CameraTarget: [0.5000 0.5000 0.5000]CameraTargetMode: 'auto'CameraUpVector: [0 1 0]CameraUpVectorMode: 'auto'CameraViewAngle: 6.6086CameraViewAngleMode: 'auto'Children: [0×0 GraphicsPlaceholder]Clipping: onClippingStyle: '3dbox'Color: [1 1 1]ColorOrder: [7×3 double]ColorOrderIndex: 1ColorScale: 'linear'Colormap: [256×3 double]ContextMenu: [0×0 GraphicsPlaceholder]CreateFcn: ''CurrentPoint: [2×3 double]DataAspectRatio: [1 1 1]DataAspectRatioMode: 'auto'DeleteFcn: ''FontAngle: 'normal'FontName: 'Helvetica'FontSize: 10FontSizeMode: 'auto'FontSmoothing: onFontUnits: 'points'FontWeight: 'normal'GridAlpha: 0.1500GridAlphaMode: 'auto'GridColor: [0.1500 0.1500 0.1500]GridColorMode: 'auto'GridLineStyle: '-'HandleVisibility: 'on'HitTest: onInnerPosition: [0.1300 0.1100 0.7750 0.8150]Interactions: [1×1 matlab.graphics.interaction.interface.DefaultAxesInteractionSet]Interruptible: onLabelFontSizeMultiplier: 1.1000Layer: 'bottom'Layout: [0×0 matlab.ui.layout.LayoutOptions]Legend: [0×0 GraphicsPlaceholder]LineStyleOrder: '-'LineStyleOrderIndex: 1LineWidth: 0.5000MinorGridAlpha: 0.2500MinorGridAlphaMode: 'auto'MinorGridColor: [0.1000 0.1000 0.1000]MinorGridColorMode: 'auto'MinorGridLineStyle: ':'NextPlot: 'replace'NextSeriesIndex: 1OuterPosition: [0 0 1 1]Parent: [1×1 Figure]PickableParts: 'visible'PlotBoxAspectRatio: [1 0.7882 0.7882]PlotBoxAspectRatioMode: 'auto'Position: [0.1300 0.1100 0.7750 0.8150]PositionConstraint: 'outerposition'Projection: 'orthographic'Selected: offSelectionHighlight: onSortMethod: 'childorder'Subtitle: [1×1 Text]SubtitleFontWeight: 'normal'Tag: ''TickDir: 'in'TickDirMode: 'auto'TickLabelInterpreter: 'tex'TickLength: [0.0100 0.0250]TightInset: [0.0438 0.0527 0.0171 0.0200]Title: [1×1 Text]TitleFontSizeMultiplier: 1.1000TitleFontWeight: 'bold'TitleHorizontalAlignment: 'center'Toolbar: [1×1 AxesToolbar]Type: 'axes'Units: 'normalized'UserData: []View: [0 90]Visible: onXAxis: [1×1 NumericRuler]XAxisLocation: 'bottom'XColor: [0.1500 0.1500 0.1500]XColorMode: 'auto'XDir: 'normal'XGrid: offXLabel: [1×1 Text]XLim: [0 1]XLimMode: 'auto'XLimitMethod: 'tickaligned'XMinorGrid: offXMinorTick: offXScale: 'linear'XTick: [1×11 double]XTickLabel: {11×1 cell}XTickLabelMode: 'auto'XTickLabelRotation: 0XTickMode: 'auto'YAxis: [1×1 NumericRuler]YAxisLocation: 'left'YColor: [0.1500 0.1500 0.1500]YColorMode: 'auto'YDir: 'normal'YGrid: offYLabel: [1×1 Text]YLim: [0 1]YLimMode: 'auto'YLimitMethod: 'tickaligned'YMinorGrid: offYMinorTick: offYScale: 'linear'YTick: [1×11 double]YTickLabel: {11×1 cell}YTickLabelMode: 'auto'YTickLabelRotation: 0YTickMode: 'auto'ZAxis: [1×1 NumericRuler]ZColor: [0.1500 0.1500 0.1500]ZColorMode: 'auto'ZDir: 'normal'ZGrid: offZLabel: [1×1 Text]ZLim: [0 1]ZLimMode: 'auto'ZLimitMethod: 'tickaligned'ZMinorGrid: offZMinorTick: offZScale: 'linear'ZTick: [0 0.5000 1]ZTickLabel: ''ZTickLabelMode: 'auto'ZTickLabelRotation: 0ZTickMode: 'auto'
Figure 窗口监听鼠标事件
MATLAB 中 Figure 窗口可以监听鼠标事件。常见的鼠标事件:
鼠标按下:WindowButtonDownFcn
set(fig, 'WindowButtonDownFcn', @mouseButtonDownCallback);
鼠标松开:WindowButtonUpFcn
set(fig, 'WindowButtonUpFcn', @mouseButtonUpCallback);
鼠标移动:WindowButtonMotionFcn
set(fig, 'WindowButtonMotionFcn', @mouseMoveCallback);
鼠标进入:WindowEnterFcn
set(fig, 'WindowEnterFcn', @mouseEnterCallback);
鼠标离开:WindowExitFcn
set(fig, 'WindowExitFcn', @mouseExitCallback);
鼠标滚轮滚动:WindowScrollWheelFcn
set(fig, 'WindowScrollWheelFcn', @mouseScrollWheelCallback);
以上的示例中,fig 是你的 Figure 句柄,而 mouseButtonDownCallback、mouseButtonUpCallback、等等是相应事件触发时要执行的回调函数。你可以根据需要选择性地设置这些属性,以实现相应的鼠标事件处理。
Figure 窗口监听鼠标点击事件
要在 MATLAB 中监听鼠标点击事件,你可以使用 ButtonDownFcn 属性。简单的例子:
% 创建一个新的 Figure
figure;% 设置 ButtonDownFcn 属性
set(gcf, 'ButtonDownFcn', @mouseClickCallback);% 回调函数,处理鼠标点击事件
function mouseClickCallback(~, ~)% 获取当前鼠标位置currentPoint = get(gca, 'CurrentPoint');x = currentPoint(1, 1);y = currentPoint(1, 2);% 在命令窗口显示鼠标点击位置fprintf('Mouse Clicked at: x = %f, y = %f\n', x, y);
end
这个例子创建了一个新的 Figure,并设置了 ButtonDownFcn 属性为名为 mouseClickCallback 的回调函数。当鼠标在 Figure 上点击时,该回调函数会被调用,并显示当前鼠标的 x 和 y 坐标。
Figure 窗口监听鼠标移动事件
在 MATLAB 中,你可以使用 WindowButtonMotionFcn 属性来监听鼠标在 Figure 上的移动事件。简单的例子:
% 创建一个新的 Figure
figure;% 设置 WindowButtonMotionFcn 属性
set(gcf, 'WindowButtonMotionFcn', @mouseMoveCallback);% 回调函数,处理鼠标移动事件
function mouseMoveCallback(~, ~)% 获取当前鼠标位置currentPoint = get(gca, 'CurrentPoint');x = currentPoint(1, 1);y = currentPoint(1, 2);% 在命令窗口显示鼠标位置fprintf('Mouse Position: x = %f, y = %f\n', x, y);
end
这个例子创建了一个新的 Figure,并设置了 WindowButtonMotionFcn 属性为名为 mouseMoveCallback 的回调函数。当鼠标在 Figure 上移动时,该回调函数会被调用,并显示当前鼠标的 x 和 y 坐标。
Figure 窗口监听鼠标鼠标按下和松开事件
要同时监听 MATLAB Figure 上的鼠标按下和松开事件,你可以使用 WindowButtonDownFcn 和 WindowButtonUpFcn 属性。示例:
% 创建一个新的 Figure
figure;% 设置 WindowButtonDownFcn 和 WindowButtonUpFcn 属性
set(gcf, 'WindowButtonDownFcn', @mouseButtonDownCallback);
set(gcf, 'WindowButtonUpFcn', @mouseButtonUpCallback);% 鼠标按下回调函数
function mouseButtonDownCallback(~, ~)disp('Mouse Button Down');
end% 鼠标松开回调函数
function mouseButtonUpCallback(~, ~)disp('Mouse Button Up');
end
这个例子创建了一个新的 Figure,并分别设置了 WindowButtonDownFcn 和 WindowButtonUpFcn 属性为两个不同的回调函数。当鼠标在 Figure 上按下时,mouseButtonDownCallback 函数会被调用,而当鼠标松开时,mouseButtonUpCallback 函数会被调用。


