(1)简单的一排或者对称的多排,使用patchwork即可。/表示分行,|表示分列
library(patchwork)
pp1<-ggplot(mtcars) + geom_point(aes(mpg, disp))
pp2<-ggplot(mtcars) + geom_boxplot(aes(gear, disp, group = gear))
pp3 <- ggplot(mtcars) + geom_bar(aes(gear)) + facet_wrap(~cyl)
pp1 /((pp2|pp3) +plot_layout(ncol = 2,#1列guides='collect'))+plot_annotation(tag_levels = c('A', '1'))+#标注A\B\C#plot_annotation(tag_levels = list(c('&', '%'), '1'))#标注特殊符号
(2)使用customLayout包:可以实现自由设定画布分布。
#创建画布
library(customLayout)
help(package="customLayout")
lay1 <- lay_new(matrix(1:6, nr = 3), widths = c(3,3),heights = c(3,3,3))
lay2 <- lay_new(matrix(1, nr = 1), widths = c(1),heights = c(9))
#合并
slay1<-lay_bind_col(lay1,lay2,widths = c(2,1))
lay_show(slay1)
#拆分
l1 <- lay_new(matrix(c(1:4), ncol = 2), widths = c(4, 1))
l2 <- lay_new(matrix(c(1:4), ncol = 2), widths = c(1, 1))
l3 <- lay_split_field(l1, l2, 2)
lay_show(l2)
#填充图形
#plot直接绘制即可
#ggplot需要使用list
library(ggplot2)
l1 <- lay_new(matrix(1:2, ncol = 1), heights = c(2, 3))
l2 <- lay_new(matrix(1:2, ncol = 1), heights = c(1, 3))
l3 <- lay_bind_col(l1, l2)
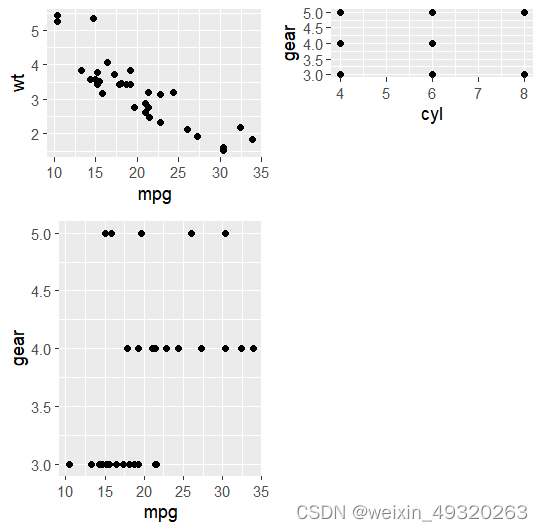
pl1 <- qplot(mpg, wt, data = mtcars)
pl2 <- qplot(mpg, gear, data = mtcars)
pl3 <- qplot(cyl, gear, data = mtcars)
pl4 <- qplot(qsec, am, data = mtcars)
lay_grid(list(pl1, pl2, pl3, pl4), l3)

