echarts插件-liquidFill(水球图)
- 1.下载
- 2.引入:
- 3.使用
1.下载
echarts.js下载:https://cdnjs.com/libraries/echarts
echarts-liquidfill.js下载:https://github.com/ecomfe/echarts-liquidfill
2.引入:
<script src='echarts.js'></script>
<script src='echarts-liquidfill.js'></script>
3.使用
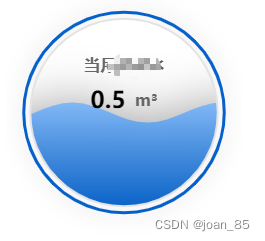
option = {series: [{type: 'liquidFill',amplitude: -10,//水面振幅waveAnimation: true,//静止水面// color:['#0460CA'],//设置波颜色,radius: '85%',outline: {//最外层边框设置sshow: true,borderDistance: 5,//最外层挨着的白色区域itemStyle: {color: 'none',borderColor: '#0460CA',//外边框颜色borderWidth: 3,//最外层宽度shadowBlur: 20,shadowColor: 'rgba(0, 0, 0, 0.25)'}},backgroundStyle: {color: '#ffffff', // 内部球背景颜色borderWidth: 2, // 内部球边框宽度borderColor: '#e3e3e3' // 内部球边框颜色},shape: 'circle',//'circle', 'rect', 'roundRect', 'triangle', 'diamond', 'pin', 'arrow' 或者 svg路径data: [{value:0.5,itemStyle: {normal: {color: new echarts.graphic.LinearGradient(0, 0, 0, 1, [{offset: 0,//0%时的颜色 从上往下看 最上面是0%color: '#7DB6F7'}, {offset: 1,//100%时的颜色 从上往下看 最上面是0%color: '#015FC9'}],),}}},],label: {position: ['50%', '36%'],formatter: function(params) {//自定义样式console.log(params,222);return '当月xxx' +'\n\n' +'{value|'+params.data.value+'}'+' m³';},fontSize: 16,color: '#666666',rich: { //特定样式value: {fontSize: 23, fontWeight: 'bolder',color: '#000000',},},}}]};
