左右滚动条的效果
此项的具体配置可参考 https://echarts.apache.org/zh/option.html#dataZoom-inside.moveOnMouseWheel
dataZoom: [{id: 'dataZoomX',type: 'inside',// start: 0,// end: this.xAxis.length > 5 ? 10 : 100,startValue: this.xAxis.length > 5 ? 5 : 0,//数据窗口范围的起始数值(绝对数值)。如果设置了dataZoom-inside.start 则startValue失效。具体可以参考echarte中的配置项endValue: this.xAxis.length > 5 ? 9 : 100,zoomOnMouseWheel: false,//表示不按任何功能键,鼠标滚轮能触发缩放moveOnMouseMove: true,//表示不按任何功能键,鼠标移动能触发数据窗口平移moveOnMouseWheel: true//表示不按任何功能键,鼠标移动能触发数据窗口平移。}],
数据堆叠效果
{name: '累计收入',type: 'bar',// 数据堆叠stack: 'total', // 柱形图宽度barMaxWidth:8,// barGap:"50%",itemStyle:{color: '#FF7F50'},data:this.dataItem.accumulatedIncome},
svg生成lengend图标
legend: {top: 14,// right:3,itemHeight:10,itemWidth:12,textStyle:{fontSize:14,color:"#000"},data: [{name:"累计收入",icon:"path://m 0 -1 h 10 v 10 h -10z"},{name:"预计收入",icon:"path://m 0 -1 h 10 v 10 h -10z"},{name:"累计实际收入",icon:"path://m 0 -1 h 10 v 2 h -12z"},{name:"累计预计收入",icon:"path://m 0 -1 h 10 v 2 h -12z"}]},
demo代码
<!-- eslint-disable eqeqeq -->
<!-- eslint-disable no-undef -->
<template><div><div ref='demo5' style="width:800px;height: 600px;"></div></div>
</template>
<script>
import * as echarts from "echarts";
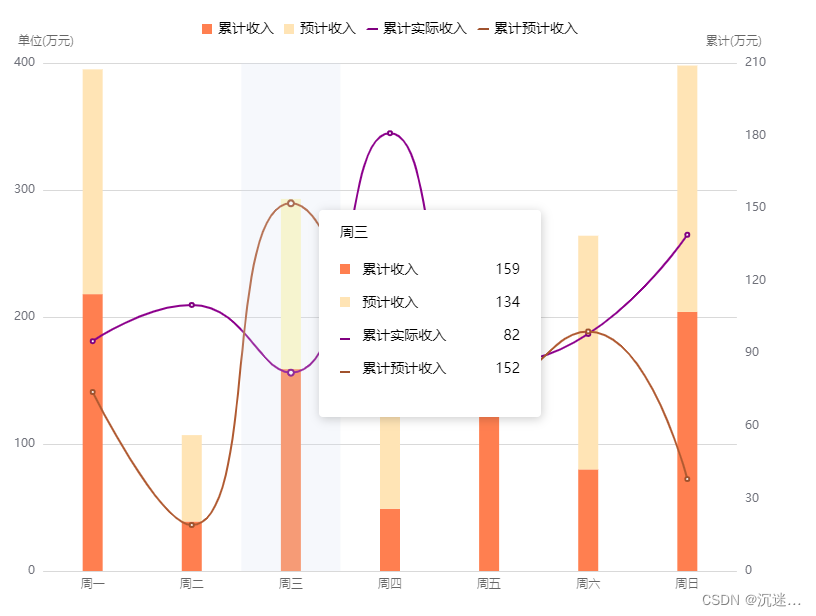
export default {data() {return {xAxis:['周一','周二','周三','周四','周五','周六','周日'],//横坐标dataItem:{accumulatedEstimate:[74, 19, 152, 101, 77, 99, 38],//累计预计收入accumulatedActual:[95, 110, 82, 181, 86, 98, 139],//累计实际收入expectedRevenue:[177, 68, 134, 202, 24, 184, 194],// 预计收入accumulatedIncome:[218, 39, 159, 49, 186, 80, 204],// 累计收入}}},async mounted() {this.initChart()},methods: {initChart() {let myChart = echarts.init(this.$refs.demo5);let option = {title:{show:false},tooltip: {trigger: 'axis',axisPointer: {type: 'shadow'},// 格式化弹窗中的内容formatter:(params)=>{let dateTime = params[0].axisValue// 生成let element = params.map(item => {let width = '10px'let height = '2px'if (['累计收入','预计收入'].includes(item.seriesName)) {width = '10px'height = '10px'}return `<div style="padding-top: 12px;display: flex;justify-content: space-between;"><div><span style="display: inline-block;width: ${width};height: ${height};background-color: ${item.color};margin-right: 8px;"></span><span>${item.seriesName}</span></div><div>${item.value}</div></div>`}).join("");// 渲染return `<div style="width: 180px;height: 175px;font-size: 14px;color: #000;padding:0 10px 10px"><header style="margin-bottom: 4px;">${dateTime}</header><main>${element}</main></div>`},confine: true},legend: {top: 14,// right:3,itemHeight:10,itemWidth:12,textStyle:{fontSize:14,color:"#000"},data: [{name:"累计收入",icon:"path://m 0 -1 h 10 v 10 h -10z"},{name:"预计收入",icon:"path://m 0 -1 h 10 v 10 h -10z"},{name:"累计实际收入",icon:"path://m 0 -1 h 10 v 2 h -12z"},{name:"累计预计收入",icon:"path://m 0 -1 h 10 v 2 h -12z"}]},grid: {left: '3%',right: '3%',bottom: '2%',containLabel: true},// dataZoom: [{//   id: 'dataZoomX',//   type: 'inside',//   // start: 0,//   // end: this.xAxis.length > 5 ? 10 : 100,//   startValue: this.xAxis.length > 5 ? 5 : 0,//数据窗口范围的起始数值(绝对数值)。如果设置了dataZoom-inside.start 则startValue失效。//   endValue: this.xAxis.length > 5 ? 9 : 100,//   zoomOnMouseWheel: false,//   moveOnMouseMove: true,//   moveOnMouseWheel: true// }],xAxis: [{type: 'category',splitLine:{show:false,},axisTick:{show:false,},axisLine:{show:false,},axisPointer: {type: 'shadow'},nameTextStyle:{color: 'rgba(0,0,0,0.6)',fontWeight: 400,fontSize: 12 },axisLabel:{color: 'rgba(0,0,0,0.6)',fontWeight: 400,fontSize: 12 },data:this.xAxis}],yAxis: [{name: "单位(万元)",type: 'value',min: 0,// max: 200000,// interval: 40000,axisPointer:{show:false,},// y轴名字的配置项nameTextStyle:{align:'left',padding: [0,0,0,-25],color: 'rgba(0,0,0,0.6)',fontWeight: 400,fontSize: 12 },nameGap: 15,splitLine :{lineStyle:{type:'solid',//虚线color: 'rgba(0,0,0,0.15)',width: 1,},show: true //隐藏}},{type: 'value',name: "累计(万元)",min: 0,// max: 100,// interval: 20,axisLabel: {formatter: '{value}'},splitLine:{show:false,},axisPointer:{show:false,},// y轴名字的配置项nameTextStyle:{align:'right',padding: [0,-25,0,0],color: 'rgba(0,0,0,0.6)',fontWeight: 400,fontSize: 12 },nameGap: 15,}],series: (()=>{let series = [{name: '累计收入',type: 'bar',// 数据堆叠stack: 'total', // 柱形图宽度barMaxWidth:20,// barGap:"50%",itemStyle:{color: '#FF7F50'},data:this.dataItem.accumulatedIncome},{name: '预计收入',type: 'bar',// 数据堆叠stack: 'total',// 柱形图宽度barMaxWidth:20,// barGap:"50%",itemStyle:{color: '#FFE4B5'},data:this.dataItem.expectedRevenue},{name: '累计实际收入',type: 'line',smooth: true, // 平滑曲线// stack: 'total',// barMaxWidth:8,// barGap:"50%",itemStyle:{color: '#800080',width: 2},// 使用双y轴的时候那些数据使用那个轴yAxisIndex: 1,data:this.dataItem.accumulatedActual},{name: '累计预计收入',type: 'line',smooth: true, // 平滑曲线// stack: 'total',// barMaxWidth:8,// barGap:"50%",itemStyle:{color:'#A0522D',width: 2},yAxisIndex: 1,data:this.dataItem.accumulatedEstimate},]return series})()}myChart.setOption(option, true);},},}
</script><style lang="scss" scoped></style>
效果如下
