Package paleobioDB version 0.7.0
paleobioDB 包在2020年已经停止更新,该包依赖PBDB v1 API。
可以选择在Index of /src/contrib/Archive/paleobioDB (r-project.org)下载安装包后,执行本地安装。
Usage
pbdb_subtaxa (data, do.plot, col)Arguments
参数【data】:输入的数据,数据帧格式。可以通过 pbdb_occurrences() 函数获得数据。
参数【do.plot】:TRUE/FALSE。默认为 TRUE。
参数【col】:改变图中柱子的颜色。默认为 skyblue2。
Value
返回一张图和一个数据帧,展示了数据中的子类群数量。
Example
library(paleobioDB)
library(RCurl)options(RCurlOptions = list(cainfo = system.file("CurlSSL", "cacert.pem", package = "RCurl")))canidae_quat<-  pbdb_occurrences (limit="all",
base_name="Canidae",  interval="Quaternary",
show=c("coords", "phylo", "ident"))pbdb_subtaxa (canidae_quat)
species genera families orders classes phyla
1 0 29 1 1 1 1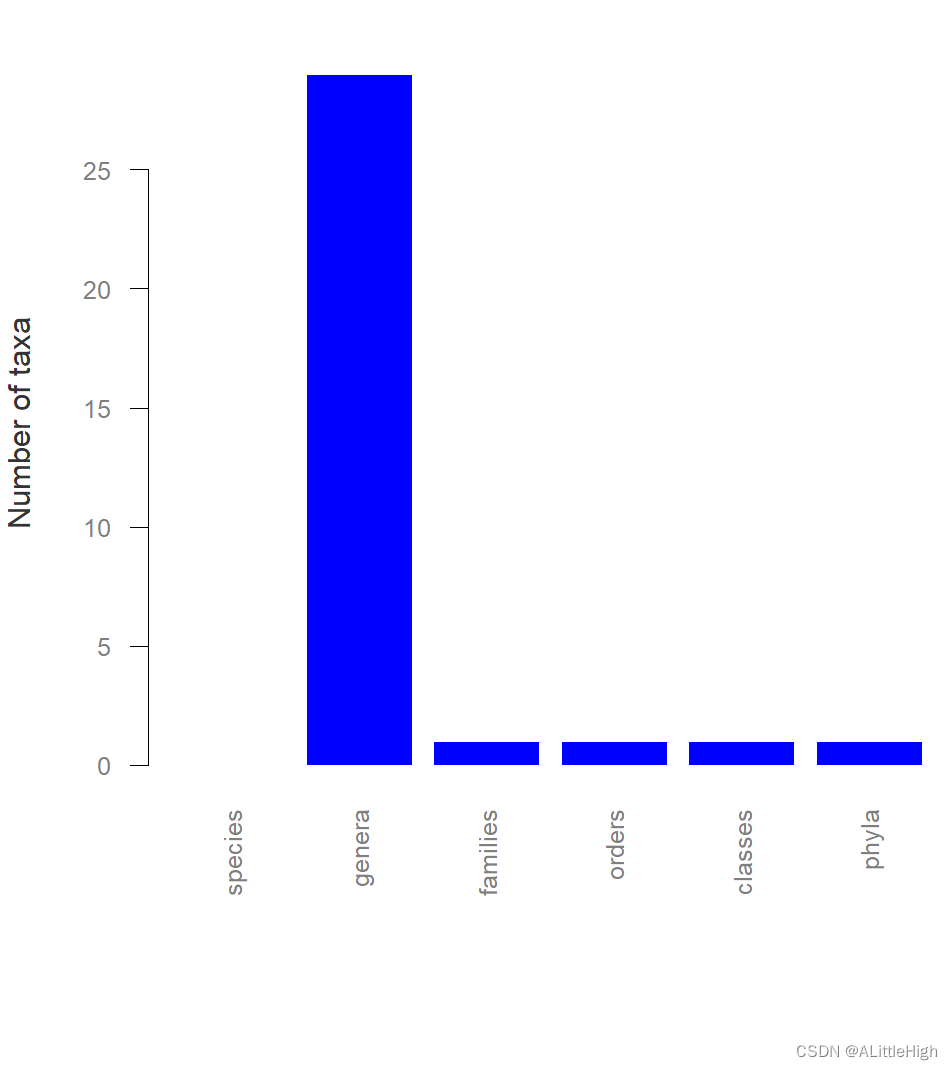
Page
function (data, do.plot = TRUE, col = "#0000FF")
{species <- nrow(pbdb_temp_range(data = data, rank = "species", do.plot = FALSE))genera <- nrow(pbdb_temp_range(data = data, rank = "genus", do.plot = FALSE))families <- nrow(pbdb_temp_range(data = data, rank = "family", do.plot = FALSE))orders <- nrow(pbdb_temp_range(data = data, rank = "order", do.plot = FALSE))classes <- nrow(pbdb_temp_range(data = data, rank = "class", do.plot = FALSE))phyla <- nrow(pbdb_temp_range(data = data, rank = "phylum", do.plot = FALSE))subtaxa <- data.frame(species, genera, families, orders, classes, phyla)if (do.plot == TRUE) {par(mar = c(8, 4, 2, 0))barplot(unlist(subtaxa), beside = T, horiz = F, col = col, border = F, las = 2, ylab = "Number of taxa")}return(subtaxa)
}
