当数据库出现严重的性能问题或者hang了的时候, 可能最常用的办法就是重启数据库,简单有效解决问题;但是重启后如何追踪问题的根本原因成了难题,很多信息随着重启也消失不见了,让追查问题变的十分棘手,这时就需要oracle systemstate dump来帮忙,可以很短的时间内收集到数据库的各种信息,可以在收集后再重启,既可以及时的解决问题,又相当于快照了数据库的瞬时状态,方便追踪数据库hang死的根本原因,本文将介绍oracle systemsate dump ,gdb,dbx 数据库的dump工具的用法和示例
**
1. oracle systemstate dump
**
这里一般可以分为两类一种是hang分析 一种是系统dump
Hanganalyze 用于分析是否真的卡死还是只是慢,并做一个一致性的快照
Systemstate dump 会记录下当前所有的数据库进程在做什么
理论上systemstate会比hanganalyze记录更多
Hanganalyze levels:
Level 3: In 11g onwards, level 3 also collects a short stack for relevant processes in hang chain --最常用
Level 4: Collects everything from level 3 and dumps leaf nodes (blockers) in wait chains
Level 5: Collects everything from level 4 and dumps all processes involved in wait chains
Systemstate levels:
1. level2:dump(不包括lock element)
2. level10:dump
3. level11:dump+global cache of rac --会产生大量的trc,并耗时较久,不建议使用
4. level256:short stack(函数堆栈)
5. level258:level256+level2 —可以快速dump 但是会丢失部分锁信息
6. level266:level56+level10 —较为常用 速度较快根据系统负载一般20-60s,收集的信息也足够
7. level267:level256+level11 —和level11类似耗时久 trc大
如果sqlplus / as sysdba也卡死无法登陆 可以使用sqlplus -prelim “/as sysdba”
hanganalyze 步骤如下
[oracle@YCSMLTEST01 ~]$ sqlplus  / as sysdba
SQL*Plus: Release 19.0.0.0.0 - Production on Mon Feb 5 10:20:02 2024
Version 19.3.0.0.0
Copyright (c) 1982, 2019, Oracle.  All rights reserved.
Connected to:
Oracle Database 19c Enterprise Edition Release 19.0.0.0.0 - Production
Version 19.3.0.0.0
SQL> oradebug hanganalyze 3 ##这里相当于直接分析当前pid
Hang Analysis in /u01/app/oracle/diag/rdbms/ycsmtestdb/ycsmtestdb/trace/ycsmtestdb_ora_30625.trc
SQL>
也可以不使用当前pid 选择已有的进程如后台进程smon/pmon等
ps -ef|grep pmon
oracle   16979     1  0 Jan30 ?        00:00:29 ora_pmon_ycsmtestdb
oracle   30890 30624  0 10:24 pts/1    00:00:00 /bin/bash -c ps -ef|grep pmon
oracle   30892 30890  0 10:24 pts/1    00:00:00 grep pmon[oracle@YCSMLTEST01 ~]$ sqlplus -prelim "/as sysdba"SQL*Plus: Release 19.0.0.0.0 - Production on Mon Feb 5 10:24:50 2024
Version 19.3.0.0.0Copyright (c) 1982, 2019, Oracle.  All rights reserved.SQL> oradebug setospid 16979
Oracle pid: 2, Unix process pid: 16979, image: oracle@YCSMLTEST01 (PMON)
SQL> oradebug hanganalyze 3
Statement processed.
SQL> oradebug tracefile_name
/u01/app/oracle/diag/rdbms/ycsmtestdb/ycsmtestdb/trace/ycsmtestdb_pmon_16979.trc
SQL> exit
Disconnected from ORACLE
[oracle@YCSMLTEST01 ~]$ [oracle@YCSMLTEST01 ~]$ more /u01/app/oracle/diag/rdbms/ycsmtestdb/ycsmtestdb/trace/ycsmtestdb_pmon_16979.trc
Trace file /u01/app/oracle/diag/rdbms/ycsmtestdb/ycsmtestdb/trace/ycsmtestdb_pmon_16979.trc
Oracle Database 19c Enterprise Edition Release 19.0.0.0.0 - Production
Version 19.3.0.0.0
Build label:    RDBMS_19.3.0.0.0DBRU_LINUX.X64_190417
ORACLE_HOME:    /u01/app/oracle/product/19.3.0/db
System name:    Linux
Node name:      YCSMLTEST01
Release:        3.10.0-1160.el7.x86_64
Version:        #1 SMP Mon Oct 19 16:18:59 UTC 2020
Machine:        x86_64
Instance name: ycsmtestdb
Redo thread mounted by this instance: 1
Oracle process number: 2
Unix process pid: 16979, image: oracle@YCSMLTEST01 (PMON)*** 2024-02-04T15:26:28.090081+08:00 (CDB$ROOT(1))
*** SESSION ID:(383.7949) 2024-02-04T15:26:28.090122+08:00
*** CLIENT ID:() 2024-02-04T15:26:28.090127+08:00
*** SERVICE NAME:(SYS$BACKGROUND) 2024-02-04T15:26:28.090131+08:00
*** MODULE NAME:() 2024-02-04T15:26:28.090135+08:00
*** ACTION NAME:() 2024-02-04T15:26:28.090137+08:00
*** CLIENT DRIVER:() 2024-02-04T15:26:28.090140+08:00
*** CONTAINER ID:(1) 2024-02-04T15:26:28.090144+08:00Marked process 0xc43dd008 pid=115 serial=9 ospid=29301 newly dead
User session information :sid: 589 ser: 19719client details:O/S info: user: v_hang.kong, term: unknown, ospid: 1234machine: YCSMWTEST01 program: DBeaver 23?2?2 ? SQLEditor ?Script?32?sql?application name: DBeaver 23?2?2 ? SQLEditor ?Script?32?sql?, hash value=3172444350*** 2024-02-04T15:51:23.552873+08:00 (CDB$ROOT(1))
Marked process 0xc24b7588 pid=114 serial=12 ospid=29299 newly dead
User session information :sid: 395 ser: 41776client details:O/S info: user: v_hang.kong, term: unknown, ospid: 1234machine: YCSMWTEST01 program: DBeaver 23?2?2 ? SQLEditor ?Script?30?sql?application name: DBeaver 23?2?2 ? SQLEditor ?Script?30?sql?, hash value=1023625068*** 2024-02-05T10:26:03.304253+08:00 (CDB$ROOT(1))
Received ORADEBUG command (#5) 'tracefile_name' from process '30920'*** 2024-02-05T10:26:03.304393+08:00 (CDB$ROOT(1))
Finished processing ORADEBUG command (#5) 'tracefile_name'
[oracle@YCSMLTEST01 ~]$
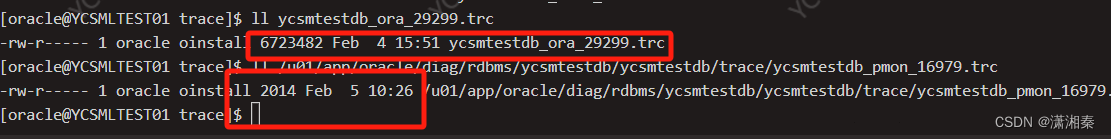
##因为当前我这个测试实例没有hang 所以trc信息较少,即使是hang住的系统,相比较systemstate的信息也是会少很多
例如这次实验的两个trc,hanganalyze的trc 2k,systemstate的dump 6M
systemstate dump步骤如下
[oracle@xxxx01 ~]$ sqlplus -prelim "/as sysdba"
SQL*Plus: Release 19.0.0.0.0 - Production on Sun Feb 4 15:08:19 2024
Version 19.3.0.0.0
Copyright (c) 1982, 2019, Oracle.  All rights reserved.
SQL> oradebug setmypid
Statement processed.
SQL> oradebug dump systemstate 266  --收集266级别的dump
Statement processed.
SQL>  oradebug dump systemstate 266
Statement processed.
SQL> oradebug tracefile_name  --显示出trace文件的路径
/u01/app/oracle/diag/rdbms/xxxxdb/xxxxdb/trace/xxxxdb_ora_20397.trc
SQL>
**
2. gdb 介绍(Linux,Solaris)
**
gdb(GNU Debugger)是Linux系统中一个强大的调试工具,它用于分析程序的运行过程,帮助开发者识别和修复程序中的错误。
当数据库已经非常慢或者数据库hang到sqlplus -prelim "/as sysdba"也无法连接时,就可以使用gdb来收集系统的dump信息
1. Find the Oracle OS process to be tracedps -ef | grep  orcl (LOCAL=NO)2 . Using the OS process id, run the gdb utilityExample: process id 3846$ gdb $ORACLE_HOME/bin/oracle 3846
(output of this command will return to the screen)3.  Print the output to a trace file(gdb) print ksudss(258)4. Review the trace file which is found in the user_dump_dest directory.  It should be named trace <SID>_ora_<process id> .trc   e.g. orcl_ora_3846.trc
范例
[oracle@YCSMLTEST01 ~]$ ps -ef|grep LOCAL=NO ##选择需要dump的pid,不要选择oracle后台进程oracle 29295 1 0 Jan31 ? 00:00:00 oracleycsmtestdb (LOCAL=NO)oracle 29297 1 0 Jan31 ? 00:00:00 oracleycsmtestdb (LOCAL=NO)oracle 29299 1 0 Jan31 ? 00:00:00 oracleycsmtestdb (LOCAL=NO)[oracle@YCSMLTEST01 ~]$ gdb $ORALE_HOME/bin/oracle 29299 GNU gdb (GDB) Red Hat Enterprise Linux 7.6.1-120.el7Copyright (C) 2013 Free Software Foundation, Inc.License GPLv3+: GNU GPL version 3 or later <http://gnu.org/licenses/gpl.html>This is free software: you are free to change and redistribute it.There is NO WARRANTY, to the extent permitted by law. Type "show copying"and "show warranty" for details.This GDB was configured as "x86_64-redhat-linux-gnu".For bug reporting instructions, please see:<http://www.gnu.org/software/gdb/bugs/>.../bin/oracle: No such file or directory.Attaching to process 29299Reading symbols from /u01/app/oracle/product/19.3.0/db/bin/oracle...(no debugging symbols found)...done.Reading symbols from /u01/app/oracle/product/19.3.0/db/lib/libodm19.so...(no debugging symbols found)...done.Loaded symbols for /u01/app/oracle/product/19.3.0/db/lib/libodm19.soReading symbols from /u01/app/oracle/product/19.3.0/db/lib/libofs.so...(no debugging symbols found)...done.Loaded symbols for /u01/app/oracle/product/19.3.0/db/lib/libofs.soReading symbols from /u01/app/oracle/product/19.3.0/db/lib/libcell19.so...done.Loaded symbols for /u01/app/oracle/product/19.3.0/db/lib/libcell19.soReading symbols from /u01/app/oracle/product/19.3.0/db/lib/libskgxp19.so...(no debugging symbols found)...done.Loaded symbols for /u01/app/oracle/product/19.3.0/db/lib/libskgxp19.soReading symbols from /u01/app/oracle/product/19.3.0/db/lib/libskjcx19.so...(no debugging symbols found)...done.Loaded symbols for /u01/app/oracle/product/19.3.0/db/lib/libskjcx19.soReading symbols from /lib64/librt.so.1...(no debugging symbols found)...done.Loaded symbols for /lib64/librt.so.1Reading symbols from /u01/app/oracle/product/19.3.0/db/lib/libclsra19.so...(no debugging symbols found)...done.Loaded symbols for /u01/app/oracle/product/19.3.0/db/lib/libclsra19.soReading symbols from /u01/app/oracle/product/19.3.0/db/lib/libdbcfg19.so...(no debugging symbols found)...done.Loaded symbols for /u01/app/oracle/product/19.3.0/db/lib/libdbcfg19.soReading symbols from /u01/app/oracle/product/19.3.0/db/lib/libhasgen19.so...(no debugging symbols found)...done.Loaded symbols for /u01/app/oracle/product/19.3.0/db/lib/libhasgen19.soReading symbols from /u01/app/oracle/product/19.3.0/db/lib/libskgxn2.so...(no debugging symbols found)...done.Loaded symbols for /u01/app/oracle/product/19.3.0/db/lib/libskgxn2.soReading symbols from /u01/app/oracle/product/19.3.0/db/lib/libocr19.so...done.Loaded symbols for /u01/app/oracle/product/19.3.0/db/lib/libocr19.soReading symbols from /u01/app/oracle/product/19.3.0/db/lib/libocrb19.so...done.Loaded symbols for /u01/app/oracle/product/19.3.0/db/lib/libocrb19.soReading symbols from /u01/app/oracle/product/19.3.0/db/lib/libocrutl19.so...done.Loaded symbols for /u01/app/oracle/product/19.3.0/db/lib/libocrutl19.soReading symbols from /lib64/libaio.so.1...Reading symbols from /lib64/libaio.so.1...(no debugging symbols found)...done.(no debugging symbols found)...done.Loaded symbols for /lib64/libaio.so.1Reading symbols from /u01/app/oracle/product/19.3.0/db/lib/libons.so...(no debugging symbols found)...done.Loaded symbols for /u01/app/oracle/product/19.3.0/db/lib/libons.soReading symbols from /u01/app/oracle/product/19.3.0/db/lib/libmql1.so...(no debugging symbols found)...done.Loaded symbols for /u01/app/oracle/product/19.3.0/db/lib/libmql1.soReading symbols from /u01/app/oracle/product/19.3.0/db/lib/libipc1.so...(no debugging symbols found)...done.Loaded symbols for /u01/app/oracle/product/19.3.0/db/lib/libipc1.soReading symbols from /lib64/libdl.so.2...(no debugging symbols found)...done.Loaded symbols for /lib64/libdl.so.2Reading symbols from /lib64/libm.so.6...(no debugging symbols found)...done.Loaded symbols for /lib64/libm.so.6Reading symbols from /lib64/libpthread.so.0...(no debugging symbols found)...done.[Thread debugging using libthread_db enabled]Using host libthread_db library "/lib64/libthread_db.so.1".Loaded symbols for /lib64/libpthread.so.0Reading symbols from /lib64/libnsl.so.1...(no debugging symbols found)...done.Loaded symbols for /lib64/libnsl.so.1Reading symbols from /lib64/libresolv.so.2...(no debugging symbols found)...done.Loaded symbols for /lib64/libresolv.so.2Reading symbols from /lib64/libc.so.6...(no debugging symbols found)...done.Loaded symbols for /lib64/libc.so.6Reading symbols from /lib64/ld-linux-x86-64.so.2...(no debugging symbols found)...done.Loaded symbols for /lib64/ld-linux-x86-64.so.2Reading symbols from /usr/lib64/libnuma.so.1...Reading symbols from /usr/lib64/libnuma.so.1...(no debugging symbols found)...done.(no debugging symbols found)...done.Loaded symbols for /usr/lib64/libnuma.so.1Reading symbols from /lib64/libgcc_s.so.1...(no debugging symbols found)...done.Loaded symbols for /lib64/libgcc_s.so.1Reading symbols from /lib64/libnss_files.so.2...(no debugging symbols found)...done.Loaded symbols for /lib64/libnss_files.so.2Reading symbols from /u01/app/oracle/product/19.3.0/db/lib/libshpkavx51219.so...(no debugging symbols found)...done.Loaded symbols for /u01/app/oracle/product/19.3.0/db/lib/libshpkavx51219.soReading symbols from /u01/app/oracle/product/19.3.0/db/lib/libnque19.so...(no debugging symbols found)...done.Loaded symbols for /u01/app/oracle/product/19.3.0/db/lib/libnque19.so0x00007f1b0dd67740 in __read_nocancel () from /lib64/libpthread.so.0Missing separate debuginfos, use: debuginfo-install glibc-2.17-326.el7_9.x86_64 libaio-0.3.109-13.el7.x86_64 libgcc-4.8.5-44.el7.x86_64 numactl-libs-2.0.12-5.el7.x86_64(gdb) print ksudss(258) ##258为dump的levelProgram received signal SIGSEGV, Segmentation fault.0x0000000012838ff5 in slaac_int ()The program being debugged was signaled while in a function called from GDB.GDB remains in the frame where the signal was received.To change this behavior use "set unwindonsignal on".Evaluation of the expression containing the function(ksudss) will be abandoned.When the function is done executing, GDB will silently stop.(gdb) detach ##脱离进程Detaching from program: /u01/app/oracle/product/19.3.0/db/bin/oracle, process 29299[Inferior 1 (process 29299) detached](gdb) exitUndefined command: "exit". Try "help".(gdb) quit[oracle@YCSMLTEST01 ~]$ cd $ORACLE_BASE/diag/rdbms/ycsmtestdb/ycsmtestdb/trace ##参数的trace文件路径 也就是alertlog的路径[oracle@YCSMLTEST01 trace]$ ll|grep 29299-rw-r----- 1 oracle oinstall 6723482 Feb 4 15:51 ycsmtestdb_ora_29299.trc ##文件名为 oraclesid_ora_pid.trc-rw-r----- 1 oracle oinstall 1168250 Feb 4 15:51 ycsmtestdb_ora_29299.trm[oracle@YCSMLTEST01 trace]$ more ycsmtestdb_ora_29299.trcTrace file /u01/app/oracle/diag/rdbms/ycsmtestdb/ycsmtestdb/trace/ycsmtestdb_ora_29299.trcOracle Database 19c Enterprise Edition Release 19.0.0.0.0 - ProductionVersion 19.3.0.0.0Build label: RDBMS_19.3.0.0.0DBRU_LINUX.X64_190417ORACLE_HOME: /u01/app/oracle/product/19.3.0/dbSystem name: LinuxNode name: YCSMLTEST01Release: 3.10.0-1160.el7.x86_64Version: #1 SMP Mon Oct 19 16:18:59 UTC 2020Machine: x86_64Instance name: ycsmtestdbRedo thread mounted by this instance: 1Oracle process number: 114Unix process pid: 29299, image: oracle@YCSMLTEST01*** 2024-02-04T15:50:20.534003+08:00 (CDB$ROOT(1))*** SESSION ID:(395.41776) 2024-02-04T15:50:20.534034+08:00*** CLIENT ID:() 2024-02-04T15:50:20.534039+08:00*** SERVICE NAME:(ycsmtestdb) 2024-02-04T15:50:20.534043+08:00*** MODULE NAME:(DBeaver 23?2?2 ? SQLEditor ?Script?30?sql?) 2024-02-04T15:50:20.534046+08:00*** ACTION NAME:() 2024-02-04T15:50:20.534050+08:00*** CLIENT DRIVER:(jdbcthin : 12.2.0.1.0) 2024-02-04T15:50:20.534052+08:00*** CONTAINER ID:(1) 2024-02-04T15:50:20.534056+08:00===================================================SYSTEM STATE (level=2, with short stacks)------------Dumping the Process Summary1: PSEUDO process2: PMON ospid 16979 sid 383 ser 7949, waiting for 'pmon timer' ##详细记录的oracle每个进程的状态 已经在等待什么3: CLMN ospid 16981 sid 574 ser 6565, waiting for 'pmon timer'4: PSP0 ospid 16983 sid 765 ser 10072, waiting for 'rdbms ipc message'5: VKTM ospid 16986 sid 956 ser 39766, waiting for 'VKTM Logical Idle Wait'6: GEN0 ospid 16990 sid 1147 ser 45884, waiting for 'rdbms ipc message'7: MMAN ospid 16992 sid 1339 ser 2353, waiting for 'rdbms ipc message'8: USER ospid 21317 sid 1 ser 65427, waiting for 'SQL*Net message from client'9: GEN1 ospid 16996_16997 sid 192 ser 35369, waiting for 'rdbms ipc message'10: SCMN ospid 16996_16996 sid 384 ser 39404, waiting for 'watchdog main loop'11: DIAG ospid 16999 sid 575 ser 43616, waiting for 'DIAG idle wait'12: OFSD ospid 17001_17002 sid 766 ser 57462, waiting for 'OFS idle'13: SCMN ospid 17001_17001 sid 957 ser 43257, waiting for 'watchdog main loop'14: DBRM ospid 17004 sid 1148 ser 51844, waiting for 'rdbms ipc message'15: VKRM ospid 17006 sid 1340 ser 4774, waiting for 'VKRM Idle'16: SVCB ospid 17008 sid 2 ser 61373, waiting for 'wait for unread message on broadcast channel'17: PMAN ospid 17010 sid 193 ser 3214, waiting for 'pman timer'18: DIA0 ospid 17012 sid 385 ser 20085, waiting for 'DIAG idle wait'19: DBW0 ospid 17014 sid 576 ser 30939, waiting for 'rdbms ipc message'20: LGWR ospid 17016 sid 767 ser 51608, waiting for 'rdbms ipc message'21: CKPT ospid 17018 sid 958 ser 45038, waiting for 'rdbms ipc message'22: LG00 ospid 17020 sid 1149 ser 59696, waiting for 'LGWR worker group idle'23: SMON ospid 17022 sid 1341 ser 54712, waiting for 'smon timer'24: LG01 ospid 17024 sid 3 ser 54873, waiting for 'LGWR worker group idle'25: SMCO ospid 17026 sid 194 ser 57138, waiting for 'rdbms ipc message'26: RECO ospid 17028 sid 386 ser 36148, waiting for 'rdbms ipc message'27: W000 ospid 17030 sid 577 ser 31068, waiting for 'Space Manager: slave idle wait'28: LREG ospid 17032 sid 768 ser 49983, waiting for 'lreg timer'29: W001 ospid 17034 sid 959 ser 34328, waiting for 'Space Manager: slave idle wait'30: PXMN ospid 17036 sid 1150 ser 50619, waiting for 'rdbms ipc message'31: MMNL ospid 17042 sid 1342 ser 6493, waiting for 'rdbms ipc message'32: MMON ospid 17040 sid 4 ser 46671, waiting for 'rdbms ipc message'33: D000 ospid 17044 sid 0 ser 0,
尽量不要去使用gdb去dump oracle数据库后台进程,有可能导致进程被kill(遇到过几次),如果系统没有hang死,也尽量不要在生产系统使用gdb做dump和调优
**
3. DBX介绍(AIX,Solaris)
**
AIX和Solaris系统中类似的命令为dbx 使用方法也类似,请参考如下
步骤:1.dbx -a PID
2.dbx() print ksudss(258)
3.dbx() detachIdentify a shadow process to useFirst, you will need to find a suitable shadow process. A good candidate would be a shadow from a sqlplus session, so we start by searching for a sqlplus session:% ps -ef |grep sqlplus
osupport 78526 154096 0 12:11:05 pts/1 0:00 sqlplus <User_Name>/<Password>
osupport 94130 84332 1 12:11:20 pts/3 0:00 grep sqlplusThen we search based upon the process id (PID) of the sqlplus session to identify the associated shadow process:% ps -ef |grep 78526osupport 28348 78526 0 12:11:05 - 0:00 oracles734 (DESCRIPTION=(LOCALosupport 78526 154096 0 12:11:05 pts/1 0:00 sqlplus <User_Name>/<Password>osupport 94132 84332 1 12:11:38 pts/3 0:00 grep 78526In this case we select shadow PID 28348,Use the debugger to attach to the shadow process
% dbx -a 28348
Waiting to attach to process 28348 ...
Successfully attached to oracle.
warning: Directory containing oracle could not be determined.
Apply 'use' command to initialize source path.
Type 'help' for help.
reading symbolic information ...
stopped in read at 0xd016fdf0
0xd016fdf0 (read+0x114) 80410014 lwz r2,0x14(r1)
(dbx)Enter the "print ksudss (XXX)" command to dump a systemstate (repeat as necessary). For a level 258 systemstate use
(dbx) print ksudss(258)If levels other than "258" are required, replace the "258" with the desired number.Detach & exit from the debugger
(dbx) q
The program is running.  Quit anyway (and detach it)? (y or n) yThe systemstate trace file can be found in the Oracle trace directory and will be named with the PID of the shadow PID that you used. For example:% ls -lrt *28348*
另外gdb、dbx还可以有其他参数可选
print ksdhng(3,1,0) 相当于oradebug hanganalyze 3print ksudps(10) 相当于oradebug dump processstate 10print curdmp() 相当于oradebug call curdmp(也就是oradebug dump cursordump)print ksdtrc(4) 相当于oradebug dump events 4(这里参数表示level,1–session,2–process,4–system)print ksdsel(10046,12) –相当于为attach的进程设置10046事件level 12print skdxipc() –相当于oradebug ipcprint skdxprst() –相当于oradebug procsta
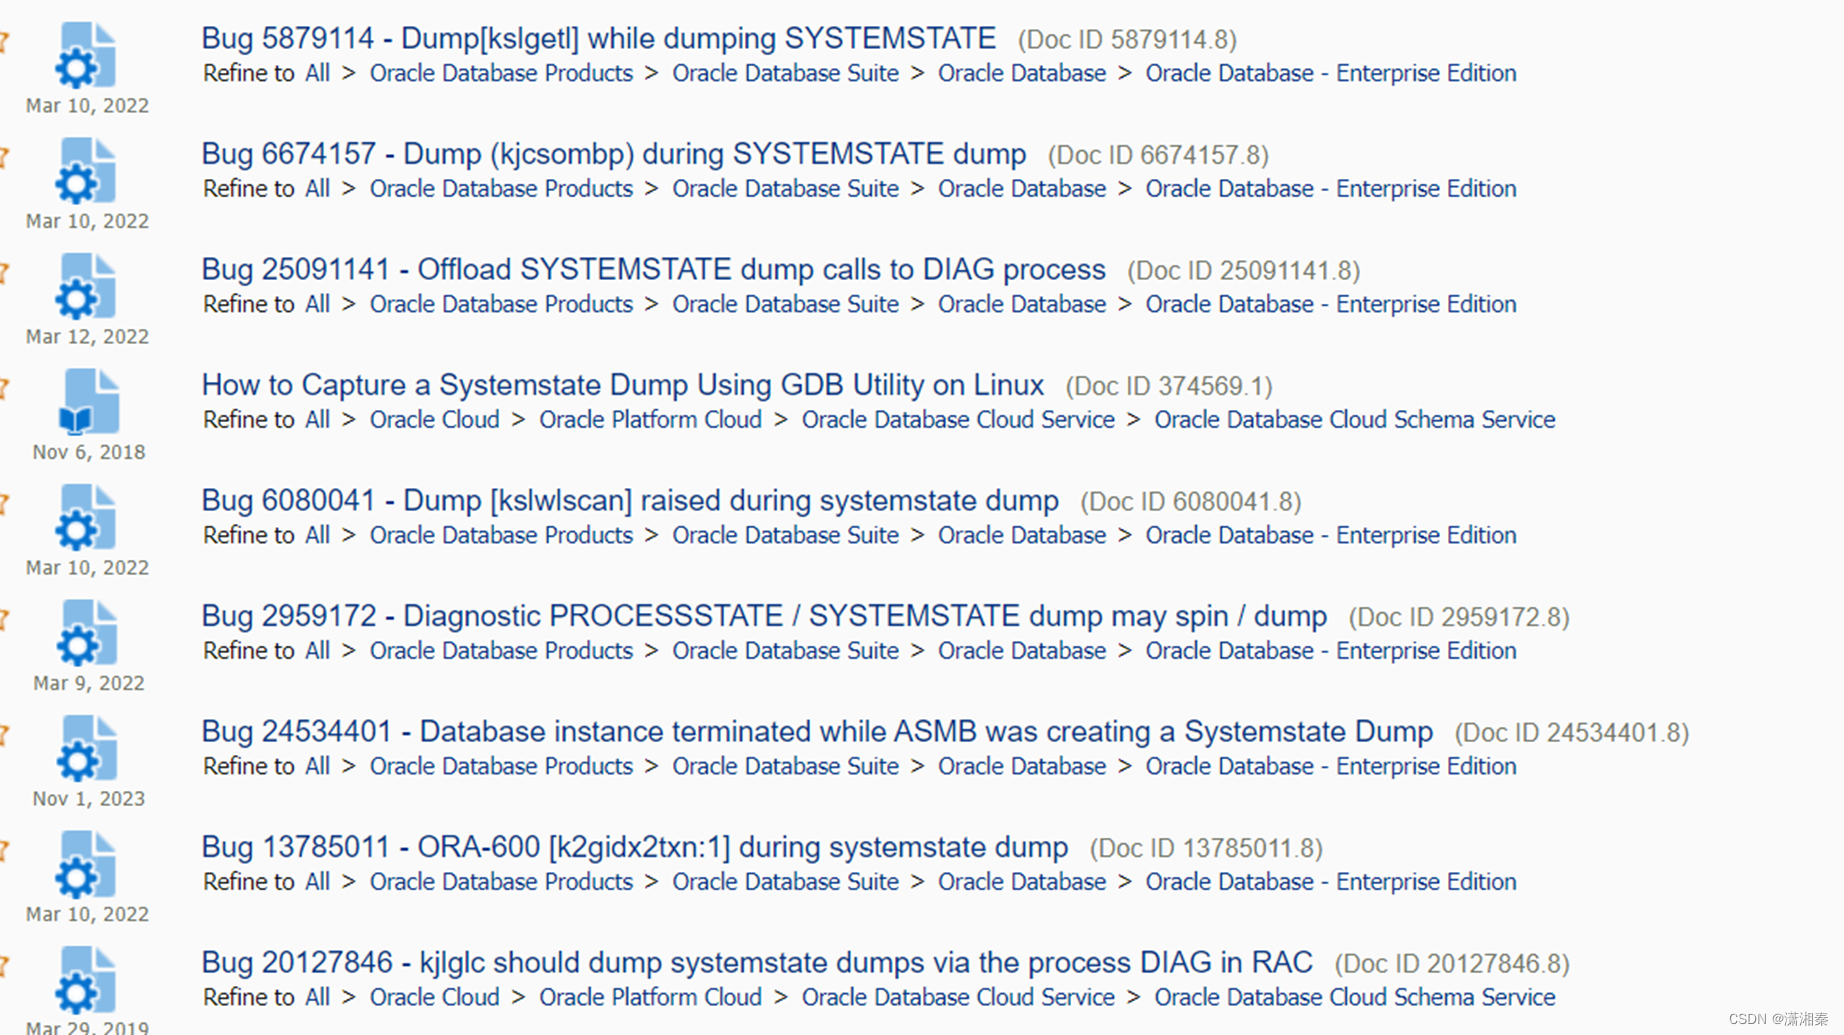
oracle systemstate dump相关的bug相当多,如果不是遇到数据库完全卡死等状况 不太建议直接使用systemstate dump或者gdb来对系统做诊断,oracle 数据库本身的AWR,ASH,ADDM等报表和EMCC平台等 完全可以应对绝大多数情况
附图部分systemstate dump相关bug list
参考资料
How to Capture a Systemstate Dump Using GDB Utility on Linux (Doc ID 374569.1)
How to Collect Systemstate Dumps When you Cannot Connect to Oracle (Doc ID 121779.1)
How to Collect Diagnostics for Database Hanging Issues (Doc ID 452358.1)
[https://www.modb.pro/db/63770
https://www.laoxiong.net/how_debugger_dump_oracle_state.html](https://www.modb.pro/db/63770
https://www.laoxiong.net/how_debugger_dump_oracle_state.html)
墨天伦,CSDN:潇湘秦 转载请注明出处